Oral Glucose Tolerance Test Report
| ✅ Paper Type: Free Essay | ✅ Subject: Sciences |
| ✅ Wordcount: 1551 words | ✅ Published: 19 Apr 2018 |
- Jason Taylor
Introduction
Glucose is a simple sugar that provides nearly half of the body’s energy, it can’t be eaten directly thus it is obtained from eating foods that contain carbohydrates. The liver stores about 1/3 of the body’s total glucose in the form of glycogen while muscle cells store 2/3 of glucose in the same form (Whitney & Rolfe, p99). The amount of sugar present in the blood is known as the blood sugar, these levels need to be tightly regulated by the body (Jiang & Zhang 2003). Eating food causes an increase in blood glucose levels, this stimulates insulin release from the pancreas into the blood stream, insulin stimulates glucose uptake into cells, stimulates liver and muscle cells to store it as glycogen and then the excess glucose is converted into fat (Whitney & Rolfe, p99). Low blood glucose levels are stimulated by the glucagon release from the pancreas, this causes the stored glycogen to be converted to glucose which causes an increase in the blood glucose levels (Whitney & Rolfe, p99).
Diabetes Mellitus is a group of disorders that have glucose intolerance in common, type I and type II diabetes are the most common. Type I diabetes mellitus is when the cells don’t produce enough insulin and its symptoms include excessive thirst and urination, lethargy, unexplained weight loss and wounds that heal slowly. Type I diabetes is due to the loss of beta cells in the pancreas which are responsible for the secretion of insulin (McCance & Huether, pg745). There have been two types of type I diabetes identified, type 1A is an autoimmune disease in which environmental and genetic factors trigger the destruction of beta cells. Type 1B is non-immune and it’s when individuals having varying amounts of insulin deficiency (McCance & Huether, pg746). Type II diabetes mellitus is less common and is when cells don’t respond to insulin, genetic factors such as a lack of insulin receptors combined with environmental influences like obesity can result in the pathophysiologic mechanisms for type II diabetes like decreased insulin secretion and insulin resistance. These are crucial for the development of type II diabetes mellitus (McCance & Huether, pg750).
There are numerous complications associated with diabetes such as hypoglycaemia, hyperglycaemia and diabetic ketoacidosis. Hypoglycaemia is when there’s low levels of glucose which is damaging as the brain and nervous system rely on glucose to function. Hypoglycaemia can be caused by too much insulin, strenuous physical exertion or inadequate food intake (Munter & Spiegelman, 2007). Impaired glucose regulation can lead to hyperglycaemia which is abnormally high levels of glucose in the blood, for this to occur at least 80-90% of the beta cell function have to be compromised (McCance & Huether, pg758).
Carbohydrates need to be broken down into monosaccharaides before they can be absorbed. Their digestion begins in the mouth when salivary amylase hydrolyses them to shorter polysaccharides, they then progress to the stomach that doesn’t play a role in carbohydrate digestion however its low pH inactivates the salivary amylase (Whitney & Rolfe, p101). The small intestine is where most of the digestion occurs, pancreatic amylase breaks down the polysaccharides to monosaccharide’s which are then absorbed (Whitney & Rolfe, p103).
A glucometer is used to calculate the concentration of glucose in the blood, a small drop of blood or a sample is placed on a disposable strip which is inserted into the glucometer which calculates the blood sugar levels (Whitney & Rolfe, 2013). An oral glucose tolerance test (OGTT) is used to detect diabetes mellitus, there are accepted minimum and maximum values for glucose levels in blood (mmol/L) to be within, if they are beneath or exceed them it could indicate a diabetic profile.
In this report we investigated the presence of glucose in urine samples as well as the BGL in prepared samples to determine if any of the patients showed a diabetic profile.
Methods
Most of the methods were followed as stated in: “RMB2530 Pathophysiology 1: Laboratory Manual, 2013” however due to safety and health issues real blood and urine samples were not taken.
Results
Table 3: Class Glucose Tolerance Test Results (Mary)
|
0 |
30 |
60 |
90 |
120 |
|
|
Glucose (mmol/L) |
4.9 |
9.2 |
5.7 |
4 |
1.9 |
|
4.1 |
0.3 |
2.9 |
4.1 |
1.4 |
|
|
2.1 |
4.8 |
7.2 |
6.2 |
4.4 |
|
|
2.9 |
7.7 |
7.6 |
3.9 |
3.4 |
|
|
5.3 |
8.3 |
8.8 |
5.1 |
4.7 |
|
|
Mean |
3.86 |
6.06 |
6.44 |
4.66 |
3.16 |
|
Standard Deviation |
1.344619 |
3.617043 |
2.267818 |
0.986408 |
1.470714 |
Table 3: Class Glucose Tolerance Test Results (Alex)
|
0 |
30 |
60 |
90 |
120 |
|
|
Glucose (mmol/L) |
4.5 |
7.4 |
25.9 |
18.3 |
11.1 |
|
4 |
3 |
9.2 |
7.7 |
2.8 |
|
|
4.4 |
8.5 |
7.2 |
10.1 |
11.9 |
|
|
4.1 |
7.1 |
19.9 |
18.6 |
11.9 |
|
|
5.5 |
8.2 |
23.6 |
22 |
11.9 |
|
|
Mean |
4.5 |
6.84 |
17.16 |
15.34 |
9.92 |
|
Standard Deviation |
0.595819 |
2.221036 |
8.48428 |
6.114982 |
3.995247 |
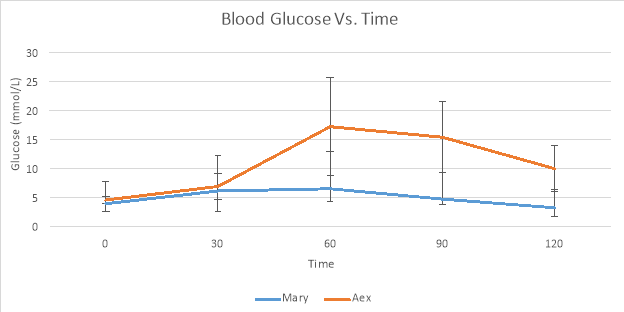
Graph 1: Blood Glucose Vs. Time for Mary and Alex
Discussion
Mary had a normal OGTT result as her blood glucose levels didn’t have a dramatic increase and they decreased efficiently as well. Mary’s blood glucose rose at 30 minutes (6.06 mmol/L) however the liver responded to the extra glucose by releasing insulin which promoted the uptake of glucose by cells and its storage as glycogen (Rubin & Strayer, pg680). Alex had an impaired response to glucose as his glucose levels rose at 30 minutes and kept rising till 60 minutes, his highest glucose reading was 16 mmol/L while Mary’s highest was 6 mmol/L. From 60 minutes onwards Alex’s blood glucose exceeded the maximum range acceptable for blood glucose levels. At 60 minutes his blood glucose was 17.16 mmol/L while the maximum accepted range is 8.9 mmol/L. This indicates a diabetic profile as a normal response is insulin release by the pancreatic beta cells that regulate glucose uptake in liver and skeletal muscle. The delayed decline in glucose suggests that the beta cells aren’t producing glucose or that the cells aren’t responding to the insulin (Rubin & Strayer, pg1090).
The liver is the primary organ involved in glucose homeostasis responding rapidly to fluctuation in blood glucose levels. The reason that there is an increase in blood glucose is due to the consumption of food. Eating foods causes an increase in blood glucose, this stimulates the release of insulin by the pancreas which is responsible for stimulating glucose uptake. Excess blood glucose is utilised by the body and stored as glycogen in liver and skeletal muscle while excess glucose is converted to fat (Whitney & Rolfe, p99). During periods of starvation or fasting, there is a lack of glucose. Low blood glucose levels are stimulated by the glucagon release from the pancreas, this causes the stored glycogen in the liver to be converted to glucose which causes an increase in the blood glucose levels. The conversion of glucose to glucose is known as glycogenolysis, gluconeogenesis is formation of glucose from non-carbohydrate sources such as amino acids and fatty acids and is utilised during fasting periods. Symptoms of patients with diabetes mellitus include excessive urination and thirst, lethargy, headaches, dizziness, mood swings and leg cramps.
Type I and II are the most commonly known diabetes forms however there are other types. Some people don’t have high enough blood glucose levels to be classified as diabetes, however since they are not normal it’s known as impaired glucose metabolism or pre-diabetes. There are two pre-diabetic conditions; impaired glucose tolerance (IGT) and impaired fasting glucose (IFG). IGT is when glucose levels are not high enough to be classified as diabetes, however they are still high while IFG are when blood fasting glucose levels escalated during fasting states but are yet again not high enough to be classified as diabetes. Gestational diabetes is a high blood glucose level during pregnancy as a result of the hormones, it usually goes away after the baby’s birth. Excessive thirst with large amounts of diluted urine is known as diabetes insipidus (DI), it occurs in two forms; central diabetes insipidus (CDI) and nephrogenic diabetes insipidus (NDI). CDI is due to an ADH deficiency, ADH or anti-diuretic hormone is responsible for retaining water. NDI is when the kidneys or nephrons are insensitive to ADH.
Glycosuria is the presence of glucose in the urine, glucose is usually filtered back into the bloodstream by the kidneys. Untreated diabetes mellitus is due to elevated glucose levels which leads to glycosuria. Filtrate pass through sieves in the kidney walls and get reabsorbed in to the blood. Damage to the filters results in filtrate excretion into urine. Urine sample A belonged to Alex and was positive for glucose as it changed from blue (negative) to dark green (+). Urine sample B belonged to Mary and it was negative for glycosuria. Alex’s positive urine sample could be due to his elevated glucose levels.
Any differences between individual results could be attributed to a number of different reasons, there could have been errors during the glucometer readings such as contaminating the glucometer stick. There could have been errors made during the pipetting of the stock glucose and water resulting in a different concentration to what was required. The experiment should be repeated again to add validity to the results.
Overall the experiment followed scientific expectations, the patient with diabetes mellitus was identified through measurement of the blood glucose levels as well as testing of a urine sample. The experiment should be repeated again to add validity to the results.
References
Tortora, GJ, Funke, BR, Case, CL (2010).Microbiology: An Introduction. 10th ed. San Francisco: Pearson Benjamin Cummings. 318, 586, 587, 710.
McCance, KL, Huether, SE, Brashers, VL, Rote, NS (2010).Pathophysiology:The biological Basis for Disease in Adults and Children. 6th ed. Missouri: Mosby Inc . 296, 1684.
Rubin, R, Strayer, DS (2012).Rubin’s Pathology: Clincopathologic Foundations of Medicine. 6th ed. Baltimore: Lippincott Williams & Wilkins. 332, 346, 348.
Jiang, G. & Zhang, B.B. 2003, “Glucagon and regulation of glucose metabolism”,American journal of physiology. Endocrinology and metabolism,vol. 284, no. 4, pp. E671-678.
Whitney, E & Rolfes, S (2012).Understanding Nutrition. 13th ed. Australia & New Zealand : Yolanda Cassio. Pg95-101.
Cite This Work
To export a reference to this article please select a referencing stye below:
Related Services
View all


DMCA / Removal Request
If you are the original writer of this essay and no longer wish to have your work published on UKEssays.com then please click the following link to email our support team:
Request essay removal