Epidemiological Data Sources and Measurements
| ✅ Paper Type: Free Essay | ✅ Subject: Sciences |
| ✅ Wordcount: 1437 words | ✅ Published: 23 Sep 2019 |
Epidemiological Data Sources and Measurements
Case 2
Question 1
This paper considers a limited aspect of rates in epidemiology, which entails calculations, measurements of diseases using statistical tools to generate frequencies, other measures of associations: bivariate analysis, multivariate analysis, correlations between variables, and a look at logistic regression. The main source for analysis comes from a conceived set of data of a non-concurrent cohort study. The writer/researcher understood that the limited nature of the variables in this assignment, and others issues from the data set compels a serious effort , not limited to statistical software such as the SPSS 13 integrated student version(2004), that makes this assignment a challenging endeavor. The information provided to muster this assignment, requires a keen mind to defray the difficulties. The goal is to satisfy the requirements, and capture the essence of epidemiological analysis of data sources and measurements. Nonetheless, it is a step in the right direction towards the preparation of a quantitative dissertation.
Measures of Associations
First, the measures of associations adopted by the writer/researcher for the study are: linear regression analysis, measures of correlation such as the Pearson coefficient factor, chi-square tests, bi-variate analysis, multivariate analysis, and ratio statistics. Measures of association are important in epidemiology because they provide opportunities to examine strengths, and characteristics of the data considered, in addition to clear understanding of ratio scales while using descriptive statistics, and restricted distributions of variables (Berk, 2004:Haug, 2019). Relative risk ratios, and odds ratios also play a vital role in descriptive statistical analysis, and cohort study (Myers, Gamst & Guarino, 2006). However, drawing causality inferences from variables can be challenging to measures of associations (Kranzler, 2003).
Second, in attempting to make sense of the dataset provided for the assignment, the writer/researcher created the following data file, using SPSS13 student integrated version (2004). The three tables are integrated in the data file, here enclosed, and can be seen under the data view:

The bulk of the analysis comes from the data file resulting from the dataset. For assumed variables A17, B24, and C32, the writer/researcher created value labels 1, 2, 3, respectively, while adding chronic disease as a variable name (Chronic disease). Patients with chronic disease with risk factors present are associated with PWCDRFP, and patients with chronic disease with risk factors absent as PWCDRFA. A nomenclature is presented throughout the various statistical analyses: TotalRFP for, total risk factors present, and TotalRFA, for total risk factors absent.
Bivariate Analysis and Multivariate Analysis
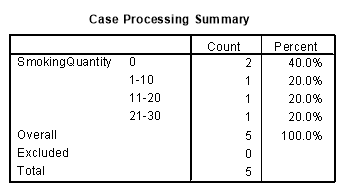
The measures of associations presented in table 1. Case processing summary (a), and case summaries below capture the cases with the three variables: A17, B24, and C32, and 2 others unknown variables presented in Table 2 of the assignment dataset. The case summaries in table1 shows the count for smoking exposure levels under the smoking quantity variable in relation to both chronic disease, and number of patients with chronic disease, and total patients for the total variables.
Bivariate analysis assessed the degree of relationship between the variables chronic disease, patients with chronic disease risk factor present (PWCDRFP), and the risk factors: 1= A17, 2= B24, and 3= C32. Through crosstabulations, tables 3, 4, and 5 show the relationship. The chi-square test in table 5 shows a Pearson chi-square value of 15.00 with a degree of freedom (df=9), and significance value of .091. Thus P<0.05, there is a statistically significant difference between these variables. The Kendall-tau-b value is .556, with an approximate significant value of .041 for the symmetrical measures. A Kendall’s tau-b test was performed for the categorical data used. Kendall’s tau-b test is a measure of correlation for ordinal or ranked measures where ties are taken into consideration. It is a non-parametric test that does not assume any assumptions related to distributions (Bobko, 2001).
In terms of analyzing the same relationship between the chronic disease, and patients with chronic disease risk factor absent (PWCDRFA), the chi-square tests, and Pearson chi-square value are the same in tables 6, 7, but the symmetrical values presented below in table 7 shows a Kendall-taub-b value of .778.
Table 1.Case Processing Summary (a) & Table 2. Case Summaries
|
Cases |
||||||
|
Included |
Excluded |
Total |
||||
|
N |
Percent |
N |
Percent |
N |
Percent |
|
|
ChronicDisease * NumberofPatientsWCD * TotalPatients * SmokingQuantity |
5 |
100.0% |
0 |
.0% |
5 |
100.0% |
|
PWCDRFP * NumberofPatientsWCD * TotalPatients * SmokingQuantity |
5 |
100.0% |
0 |
.0% |
5 |
100.0% |
|
PWCDRFA * NumberofPatientsWCD * TotalPatients * SmokingQuantity |
5 |
100.0% |
0 |
.0% |
5 |
100.0% |
|
TotalRFP * NumberofPatientsWCD * TotalPatients * SmokingQuantity |
5 |
100.0% |
0 |
.0% |
5 |
100.0% |
|
TotalRFA * NumberofPatientsWCD * TotalPatients * SmokingQuantity |
5 |
100.0% |
0 |
.0% |
5 |
100.0% |
a Limited to first 100 cases.
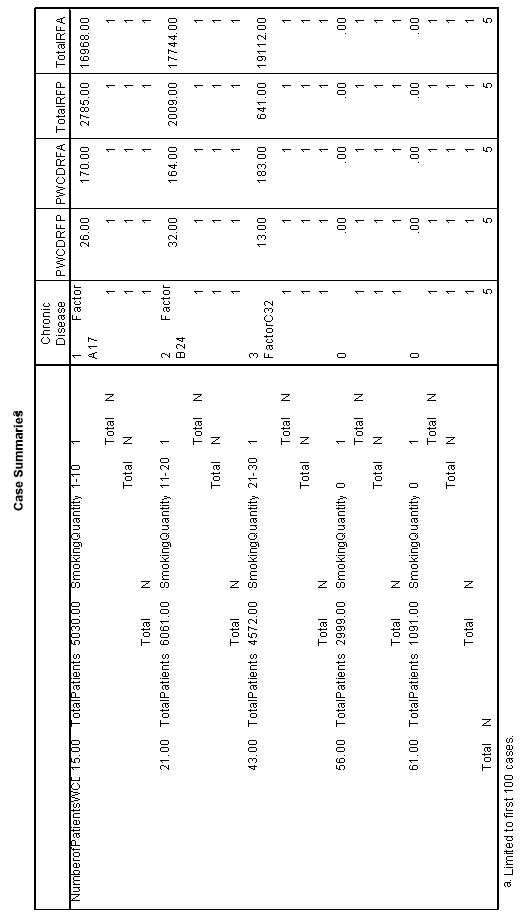
Table 3 Crosstabs Risk Factor Present and Risk factors Absent
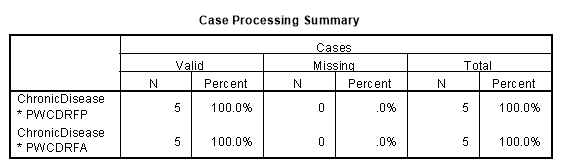
Table 4. Chronic Disease.Patients With Chronic Disease Risk Factors Present
ChronicDisease * PWCDRFP
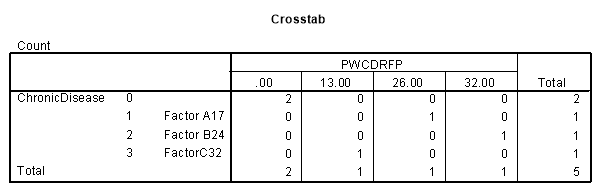
Table 5. Chi-Square Tests
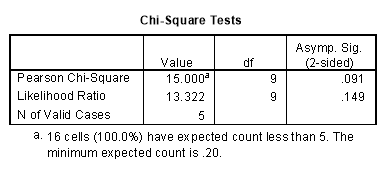
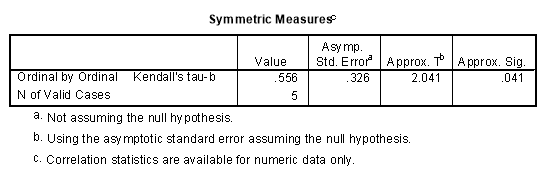
Table 6. Chronic Disease. Patients with Chronic Disease Risk Factors Absent
Chronic Disease * PWCDRFA
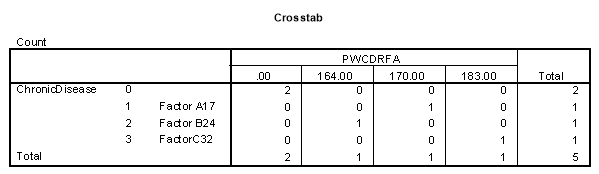
Table 7. Chi-Square Tests
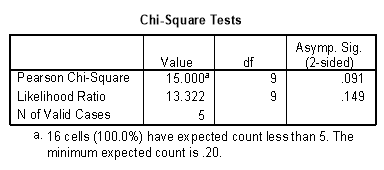
Table 8 ChronicDisease * PWCDRFA Chi-Square tests & Symetric Measures
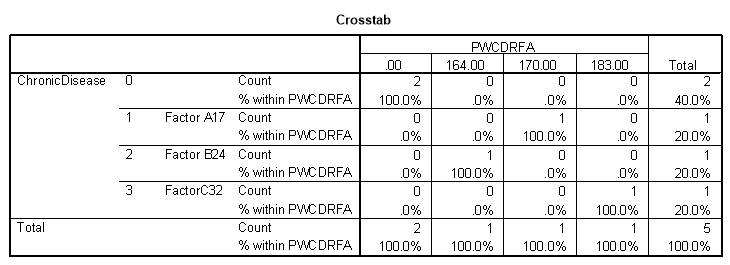
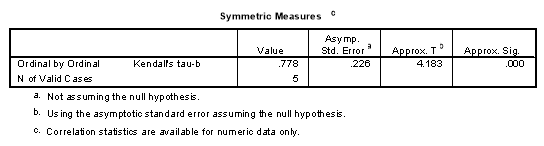
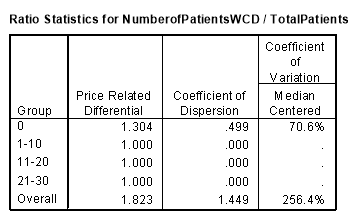
Table 9. Ratio Statistics & & Table 10 Number of Patients W Chronic Disease /Total Patients
Multivariate Analysis
Multiple regression analysis is performed to predict a quantitatively measured variable, or the dependent variable. In multivariate design, a researchers main focus is on the effects of two-group independent variables on two or more dependent variables (Meyers, Gamst & Guarino, 2006). The multivariate procedures (e.g., multiple regression, multivariate analysis of variance, factor analysis, etc.) assume that the variables in the analyses are related to each other in a linear manner. The writer/researcher did not run the multivariate analysis due to a glitch in SPSS 13 software.
Regression Analysis
To establish a process to analyze how two variables relate to a linear regression, the writer/researcher drew from the population with chronic disease with risk factors present(PWCDRFP) to examine how the distribution can help predict ways to somehow generalize the analyzes from the regression.
Table 10. Regression Analysis Descriptive Statistics
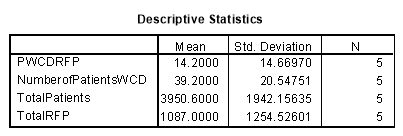
Table 11. Correlations
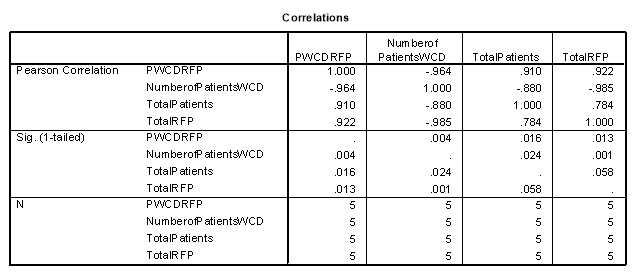
Table 12
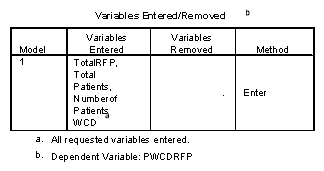
Table 13. Model Summary
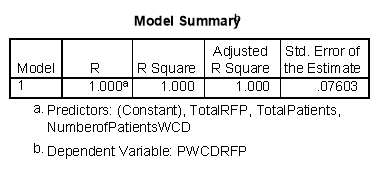
Table 14. ANOVA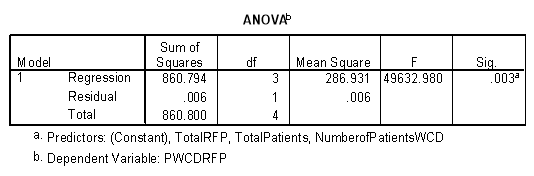
Table 15.Coefficients.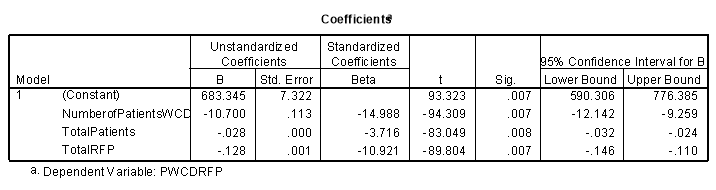
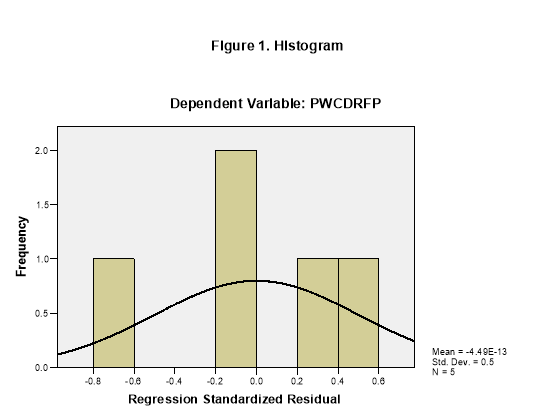
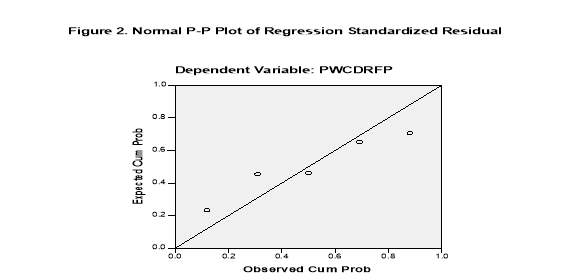
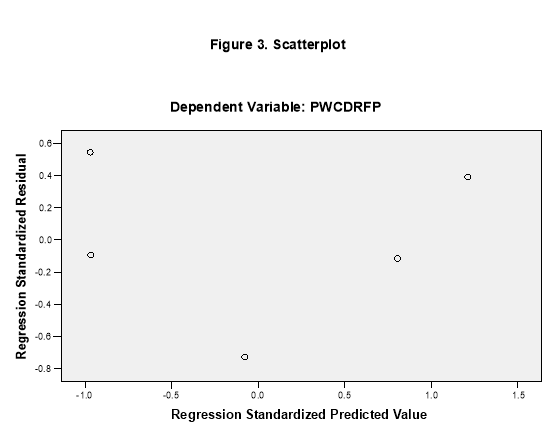
Figure 1, Histogram of the PWCDRFP (patients with chronic disease risk factors present) shows normal distribution with standard deviation of 0.5. Figure 2. Normal P-P plot exposed a positive observed cumulative probability with a conditional relationship with a straight line (Berk, 2004). Figure 3. Scatterplot of the dependent variable PWCDRFP shows the standard deviation of the residual around an average fit. Figures 1, 2, and 3 helped determined the linear regression outlook. Figure 1 Histogram of the PWCDRFP (patients with chronic disease risk factors present) shows normal distribution with standard deviation of 0.5. Figure 2. Normal P-P plot exposed a positive observed cumulative probability with a conditional relationship with a straight line (Berk, 2004). Figure 3. Scatterplot of the dependent variable PWCDRFP shows the standard deviation of the residual around an average fit.
Question 2
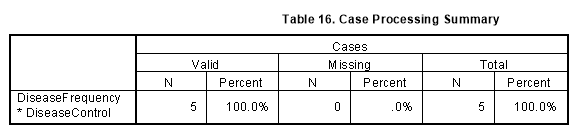
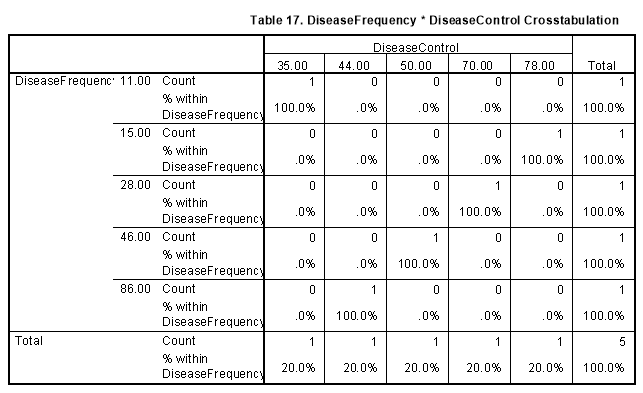
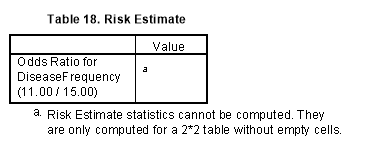
The case control study for the infectious disease presents some discrepancies in data for the factor BF variable. The difficulty in this assignment is evident. The writer/researcher has calculated the odds ratio for the disease frequency at 11/15. The relative risk could not be generated because the 2×2 table has some empty cells. Thus an interpretation was not possible. Tables 16, 17, and 18 captured the disease control and frequency presented in the case.
References
- Berk, R.A. (2004). Regression analysis. A constructive critique. Thousand Oaks, CA: Sage.
- Bobko, P. (2001). Correlation and regression: Applications for industrial organizational psychology and management. (2nd ed.). Thousand Oaks, CA: Sage Publications.
- Haug, M.G. (2019). Measure of association. Retrieved from http://www.britannica.com/topic/measure-of-association#ref 335771.
- Kranzler, J.H. (2003). Statistics for the terrified. (3rd ed.). Upper Saddle River, N.J: Prentice Hall.
- Myers, L. S., Gamst, G., & Guarino, A.J. (2006). Applied multivariate research. Design and interpretation. Thousand Oaks, CA: Sage.
Cite This Work
To export a reference to this article please select a referencing stye below:
Related Services
View all


DMCA / Removal Request
If you are the original writer of this essay and no longer wish to have your work published on UKEssays.com then please click the following link to email our support team:
Request essay removal