Determination of Nickel in Steel by Atomic Absorption Spectrometry
| ✅ Paper Type: Free Essay | ✅ Subject: Sciences |
| ✅ Wordcount: 2226 words | ✅ Published: 23 Sep 2019 |

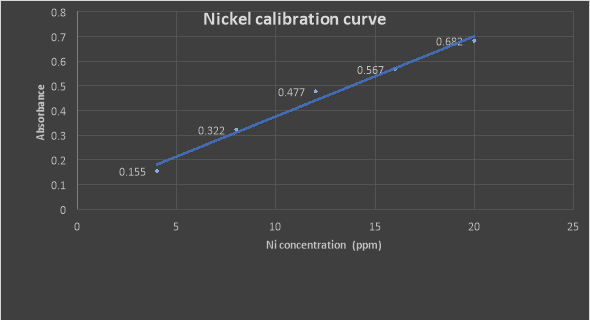
A plot of Absorbances Vs Ni concentrations (ppm)

The statistical values of the mean and standard deviation S of the Nickel standards and corresponding absorbance can be calculated from the expressions;
The above data give,
= Concentrations = 12 S concentrations = 6.32
absorbance = 0.44 S absorbance = 0.2
Absorbance of Nickel in the unknown sample was obtained to be 0.565. By using the calibration graph of the Nickel standard, we can calculate the concentration of Nickel in the steel sample.
Therefore;
From the calibration equation y = 0.0325x + 0.0509
Where y represents absorbance and x represents concentration, we can calculate the concentration x (ppm) of the unknown
As; 0.565=0.0325x +0.0509
x = 0.565 – 0.0509
0.0325
x = 15.82ppm nickel
Concentration of Nickel in steel = 15.82ppm.
But 0.3g of steel was dissolved in 1:1 HNO3 acid and solution made to 1000ml
This means, dilution factor is 1000/0.3 = 3333.3
Concentration of sample = Dilution factor x sample concentration
= 3333.3 x 15.82ppm
= 52732.81ppm.
The steel sample has 52732.81ppm of Ni.
The percentage concentration of Nickel = 52732.81/10000
= 5.27%. w/w nickel
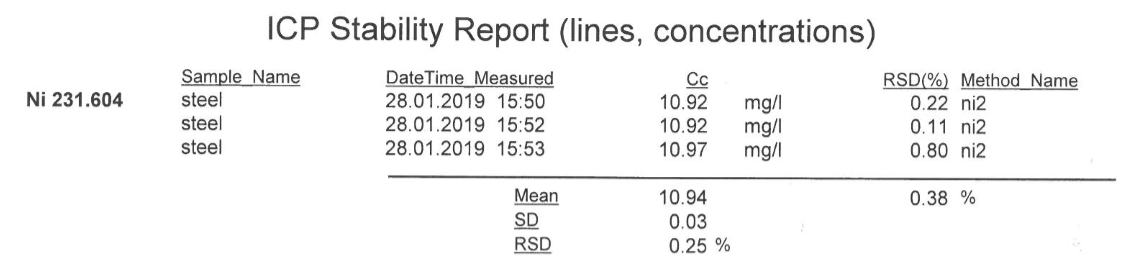
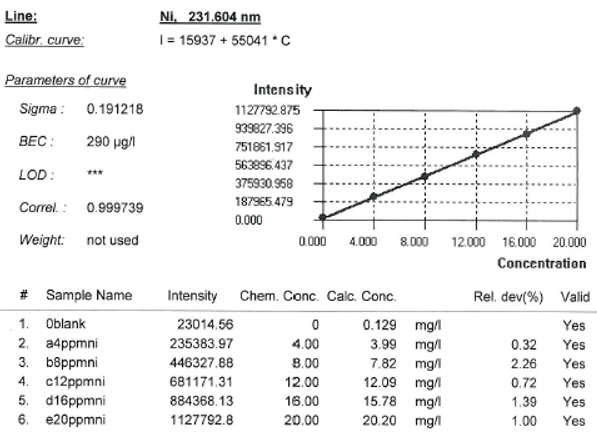
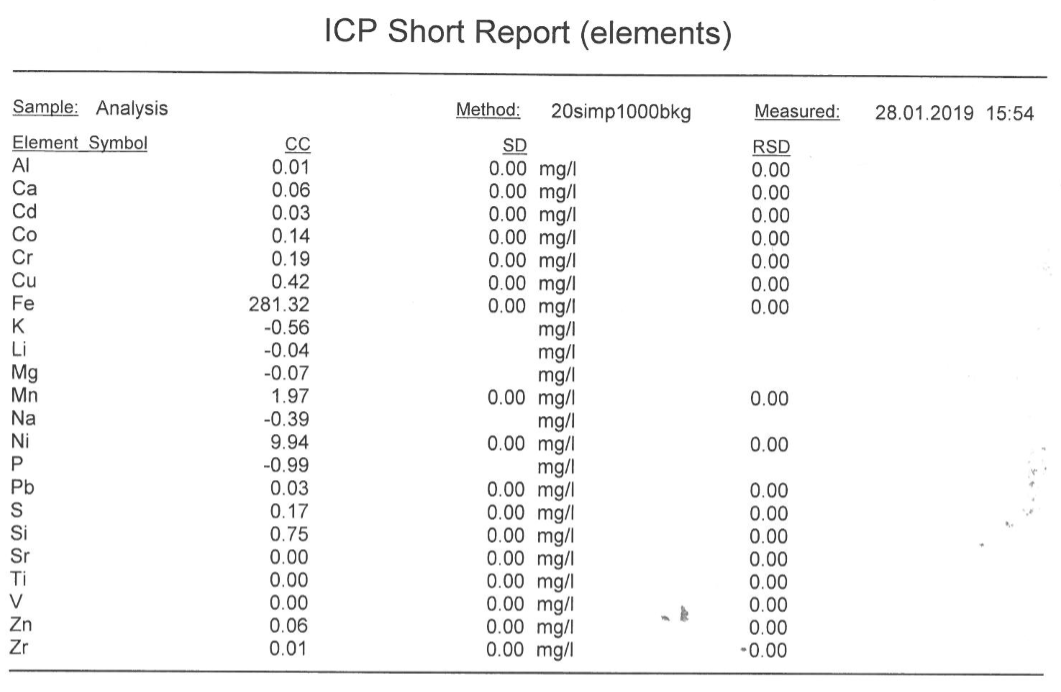
ICP-AES results gives 10.94ppm of nickel, after 4 replicate runs (see attached appendix for printed ICP report for elements, ICP-AES results)
This means 10.94ppm x Dilution factor
= 10.94 x3333.3 = 36466.302ppm Ni
The % w/w of Ni in the steel by ICP-AES method = 36466.302/10000
=3.647%w/w Ni
The AAS results is slightly different from the ICP-AES results. The variation cannot be statistically explained for this practical because only one set of analysis each was done for AAS and ICP-AES. So, for these results to be statistically acceptable, many tests need to be done such that the accuracy and precision of the methods and result is validated for a good statistical conclusion.

Precision explains the closeness of two or more measurements to each other. That is the random or indeterminate error associated with a measurement or result. For these results, precision is not worked out for Nickel because only one measurement of Nickel was taken using AAS and ICP-AES in the steel sample.
Accuracy is the closeness of an experimental measurement or results to the true or accepted value. The ICP-AES results (3.64%w/w) are close to the true or accepted value of 3.3%w/w Ni in the steel compared to AAS results which are 5.27%w/w Ni in the steel
Internal standard refers to substance included in constant amount to samples, blanks and calibration standards which is not like the analyte but comprises the same properties as the analyte.
Internal standards are used in circumstances where there are possibilities of sample to sample variability e.g. environmental samples.
Internal standards are helpful in analysis where one test done differs from the other test, this implies that the response will also differ in the same magnitude to the next response of the test.
They are useful in a situation where the analyst predicts sample loss earlier to analysis. The Samples could be lost in the process of preparation, storing and depredation. Same quantity of internal standard added to the unknown before sample loss should also be added to the standard analyte solution. This allow similar comparison of the signal from the analyte and the signal from the standard solution hence allow how much the analyte is present.
External standards also known as Certified Reference Materials (CRMs) refer to substances used for initial calibration process when performing an analysis. Their usage is mostly when we do not expect variation in samples and interference produced by complexity of the sample matrix.
External standards are made by testing a given sample to be made as the standard material repeatedly by different independent laboratories and statistical evaluation is done on the data to get the validated true or known value before being used as standard reference material. In using the external standards, different concentrations of the standard is made and plotted on a graph (calibration curve), then the unknown analyte is prepared in the same way as the standard and its concentration is obtained using the calibration graph.

The technique of standard addition is a kind of quantitative analysis whereby the standard is added directly to the aliquots of analysed sample.
This technique is used in circumstances where sample matrix contributes to the analytical signal, a condition known as the matrix effect, or interference arising from the complex nature of sample so making it difficult to compare the analytical signal between sample and standard using the calibration curve approach.
when the calibration curves are unreliable, we use Standard Addition technique. This is essential when the sample signal gives a non-linear relationship for the calibration curve. This is the case when the sample being tested is very complex and it is not possible to make standards that could represent that analysis.
The procedure for analysis using standard addition is as follows:
We take the unknown sample and put in a flask say 50ml and add a known standard amount of the same analyte on top of it and solution made to mark. This process is done for several samples where we can vary the amount of standard we added to the fixed volume of analyte in increasing sequence.
As the standard and unknown is mixed together, the standard will have the same complex components as the unknown analyte, so any interference would happen with standards as well.
If the signal measured rises as the amount of standard added also increases. This increase in signal will help one to deduce how much analyte was in the original sample, assuming signal is proportional to concentration of analyte.
A calibration graph for the signal of the standard and unknown (Y-axes) is plotted against calculated concentration of standard (X-axis). The intercept got will give us the concentration of the unknown by subtracting that value from the initial original concentration of analyte before the standard was added.
By calculation we can use,
Concentration of analyte in unknown = signal from unknown
Concentration of analyte + standard in mixture signal from the mixture
[X]i = Ix
[X]f +[S]f Ix+s
Where,
[X]i Initial concentration of unknown
[X]f Final concentration of unknown
[S]f Final concentration of standard after addition to the unknown
Ix Signal of the initial concentration of unknown
Ix+s Signal of the mixture after the standard addition
Considering the dilutions, M1V1=M2V2, similarly,
[X]f = [X]i(Vi/Vf) and [S]f = [S]i(Vi/Vf) where Vi and Vf are the volumes in the initial solution and volume of the final mixture of solution.
From this expression, the concentration of the unknown can be calculated.
Advantages of standard addition technique
– the method has no alterations in the matrix
– the technique could be used on any type of sample
– it minimises matrix effects that cause the analytes to respond differently.
– the technique is good in scenarios where the matrix is difficult to reproduce
Limitations of the technique
– it cannot solve or correct matrix effects that cause a response of its own.
– Requires at least three aliquots for each sample
– it’s a time-consuming practice throughout sample preparations.

AAS technology operates on the principle of atomic absorption, using a flame to atomize a sample. Most AAS instruments utilize flames fuelled by an air/acetylene mixture, which generates temperatures at about 2300° C, or nitrous oxide/acetylene mixture, which enables temperatures up to 2900° C. A liquid or dissolved sample is nebulized into an aerosol and introduced into the flame. The flame-generated ground state atoms can absorb radiation. Light of a specific wavelength, generated by an analyte element-specific hollow cathode lamp and passing through the flame, is partially absorbed by the atoms of the analyte element. Radiation absorbance is measured by a detector, and through an empirical calibration, the concentration of an element present in the sample is determined.
ICP-AES technology relies on atomic/ ionic emission, breaking down a sample within a high-temperature (typically up to 10000° C) argon plasma to generate atoms and ions. In the basic ICP-OES method, sample elements emit a characteristic number of specific spectral lines with different wavelengths when excited within the plasma. Emitted light is resolved into these separate lines by optical components such as diffraction gratings; the light is finally directed onto a detector array that quantifies light intensities at these different wavelengths. Elemental components of a sample may be identified and their concentrations determined using a suitable calibration.
Ease of Operation: AAS is widely used for routine analysis in industries because of its easy to operate/use.
Detection Limits: AAS provides Limits of detection (LOD) that are far better than ICP-AES for certain measurements such as analysis of group I elements like Sodium, Potassium and Lithium.
By contrast, ICP-AES is capable of providing significantly better LODs on refractory elements like Vanadium, Hafnium, Rhenium, Boron, Calcium, Aluminum and Titanium
AAS can analyse up to 67 elements and a specific hallow cathode lamp for specific element to be analyzed needs to be fitted onto the instrument. In contrast ICP-AES, uses no lamps at all, and is able to capture the entire relevant spectrum from 175-777nm in a single analysis. It can analyse up to 78 elements.
Throughput: For routine analysis of several elements from many samples, ICP-AES will give a higher throughput rate compared to AAS technique. For example, AAS may require 30seconds to analyse a particular element in a sample in three replicates whereas the ICP-AES is capable of analysing any number of elements in triplicates in 60 seconds (See attached sheet of elements analysed in one run in appendix). However, for analysis of few elements in few samples, AAS is a much faster and cheaper technique to use.
Automation: ICP-AES can be left to run safely unattended once set up whereas AAS will require frequent monitoring. The AAS technique is unsafe to be left to run automatically because it uses a flame and pressurized flame gases that could easily go off or even cause an explosion, hence the need for regular supervision. ICP-AES is then a better technique here since samples can be left to run the entire day or even overnight. It also produces a better throughput and relieves the analyst of some tasks as it runs automatically.
Range: AAS exhibits a fairly low linear dynamic range of 10-3 compared to ICP-AES which whose range is over 10-5. ICP-AES is suitable for samples with a wide concentration ranges and therefore it can analyse from parts per billion to hundreds of parts per million.
Gases: AAS gases are cheaper and are consumed less compared to Argon gas used in ICP-AES.
ICP-AES consumes more gas compared to AAS, this increases the operational cost making it an expensive technique of analysis. It is also very expensive equipment to buy and maintain.
Lamps: AAS uses Hollow cathode lamps during analysis of samples. Lamps are costly and they need replacements after certain time. ICP-AES does not require any lamps and therefore no costs are incurred in purchase and regular replacements.
Calibrations: AAS always requires regular calibrations before any analysis whereas in ICP-AES, there is no need for regular calibrations. This makes it a quicker technique and gives analyst extra time to be able to attend to other tasks in the laboratory. However, ICP-AES also faces poor long term stability which may require drift monitoring
Interferences
- AAS is affected by chemical interferences since because of its low temperature, this means some chemical bonds of metals cannot be broken. The ICP-AES on the other hand uses high temperature capable of breaking all bonds and the fore eliminates chemical interferences
- AAS does not experience spectral interferences since only one wavelength is used for each element analysed whereas in ICP-AES a lot of spectral interferences are encountered since the equipment is capable of viewing the entire spectrum.
- AAS requires use of buffers to counteract ionization interferences when analyzing group II elements whereas In ICP-AES, doesn’t require buffering since these interferences are minimal.
References
The Method of Standard Additions-https://www.tau.ac.il/~advanal/StandardAdditionsMethod.htm, accessed 05/02, 2019.
Thomson M. Standard addition: myth and reality. Analytical Methods Committee. March 2009. AMCTB No 37. website http://www.rsc.org/images/myth-reality-technical-brief-37_tcm18-214868.pdf, accessed 02 02, 2019.
Appendix
Cite This Work
To export a reference to this article please select a referencing stye below:
Related Services
View all


DMCA / Removal Request
If you are the original writer of this essay and no longer wish to have your work published on UKEssays.com then please click the following link to email our support team:
Request essay removal