Hemodynamics: Blood Flow
| ✅ Paper Type: Free Essay | ✅ Subject: Physiology |
| ✅ Wordcount: 2457 words | ✅ Published: 03 Oct 2017 |
- Introduction
Hemodynamics is the study of blood flow across the body and forces affecting it, often measured using various methods that are either invasive or noninvasive. Hemodynamic monitoring is necessary for making timely patient assessment, diagnosis, prognosis, and treatment decisions in case of cardiovascular malfunctions and imbalances caused in the amount of blood ejected by the heart. There are several invasive methods for monitoring blood flow like Thermodilution, Dye dilution and Fick methods. These methods are usually confined to hospitals and clinics with people having specific skills perform, also, these methods are associated with complications like infections, hemorrhage, arrhythmia etc. Impedance Plethysmography techniques which use the changes in electrical impedance over body surface for measurement of changes in the tissue volumes can be used to study hemodynamics. Impedance Cardiography (ICG) is a noninvasive and flexible method of calculating cardiac stroke volume providing information that is similar to invasive monitoring at low cost and risk. While invasive monitoring is done in pre-operative situations on patients already suffering from cardiovascular problems which involves catheter insertion, ICG can be performed on people any time for monitoring hemodynamic parameters that will help in diagnosis of problems occurring in near future. There are multiple ways of monitoring hemodynamics through ICG of which Thoracic Electrical Bioimpedance (TEB) is a basic variant that involves placement of electrodes on the root of the neck and at the cartilaginous section at the lower end of the sternum which is not attached to any ribs. The volume of blood flow varies during every cardiac cycle almost periodically. This changes the electrical impedance in thorax region . Negative time derivative of the measured impedance is called impedance cardiogram
 .
.
Research in the field of Impedance Cardiography started with the study of flow of fluids in body, especially in cardiac area using Impedace Plethysmography techniques since 1940s [1Bonjer]. By early 1970s Using ICG for calculation of cardiac parameters like cardiac stroke volume came on track [2Cooley]. Several comparative studies are done in the field between non-invasive ICG and invasive methods like Thermodilution which shown promising results in favour of ICG [3 Nechwatal, 4Denniston].In [5Quesnay] they discussed the implementation of ICG on subjects with heart diseases and while they were performing exercise. Results have shown that cardiac parameters measured during these tests are reliable and mostly accurate. With improvement in technology in ICG, wearable devices or garments are being designed for facilitating long term recordings and provide comfort to the patients or test subjects [6JUAN]. Since the inception of impedance cardiography there has been an increase in the reliability of the technique and improvement in measurement of cardiac parameters [7Greenfield – 13Dilek].
Measurement of ICG requires the subjects to lay in a supine position without any movement to cancel out the artifacts that are caused due to other body signals which lead to unwanted changes of the signal recorded and make the patient uncomfortable. Presence of these artifacts makes it difficult for the people reading the signals and also affect the diagnosis leading to results that are inaccurate. These artifacts have to be removed before monitoring the signals to take correct decisions through filtering. Most of these artifacts are non-stationary in nature and cannot be predicted. Artifacts that are prominent in TEB include those varying with the changes that occur in surroundings like power line interference which makes base line of the original signal to change and with the movement of patient. Some artifacts occur from inside our body like Respiratory artifact that is prominent in ICG .Often patients are required to hold their breath to cancel out this artifact, but it is shown in [5Quesnay] that this may affect the stroke volume parameter. There are also others like Motion artifacts and Electrode artifacts which bring changes to the signals that are unwanted.
Filtering methods for processing the artifacts are either adaptive or non-adaptive. Since the artifacts that are to be processed in the signals obtained are ever changing in nature, non-adaptive filters that have linear transfer functions doesn’t provide good results in the process. Whereas time varying potentials can be detected using adaptive filtering techniques whose filter specifications change at every step. In [14Huang] they used LMS algorithm based adaptive filter for cancellation fo motion artifacts and got satisfactory results. In [15Allan] Allan et.al used a scaled fourier linear combined (SFLC) technique is proposed for filtering noncorrelated noise in ICG. They have succeeded in proving that their proposed method could remove noises that are not in synchronization with heart rate. In [16Dormer] used SFLC-RLS filter which shows improvement in performance compared to SFLC-LMS filter used in [15Allan]. [17Pandey] used LMS based adaptive filtering to remove respiratory artifacts in Impedance cardiogram signal. In this paper we discussed application of Least Mean Square (LMS) algorithm and its variants Normalized LMS (NLMS), Time varying step size (TVSLMS) Adaptive step size (ASLMS) and Constrained stability LMS (CSLMS) in ICG signals for artifact removal. Along with these algorithms, signed regressor form of these variants which decreases the number of computations are also used. The artifacts that are considered in this paper are Power Line Interference (PLI), Respiratory artifacts, Motion artifacts (MA), Muscle artifacts. Section II describes the filtering techniques that are used on ICG signals in brief. Section III provides the information on data acquisition using VU-AMS device. The results and discussions of the techniques used are given in section IV followed by conclusions.
- Adaptive Filtering Techniques
- LMS
Invented by Widrow and Hoff in 1960, Least mean squares algorithm is a category of adaptive filters that adapt based on current value of error signal. Input to the LMS algorithm is a signal that needs filtering and a desired signal as reference, LMS is an iterative technique that minimizes the Mean Square Error (MSE) between these two signals. Low complexity is a significant feature of LMS algorithm which made it as a benchmark for other adaptive filtering algorithms. The process of filtering using LMS involves the following steps,
- Compute the output from the filter using inputs.
- Estimating the error between the output signal and desired signal.
- Changing the tap weights of the filter according to the error obtained above and a constant step size.
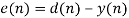
The above steps are executed iteratively to reduce the error between filter output and desired signal. Filter will be of length L, each time L samples from the input signal will be processed at a time in each step until entire samples are processed. Let x(n) be the input of the filter and d(n) be the reference signal. Input is taken from a sliding window over the input. For every step the window slides over required number of samples. Let y(n) be the output from the filter and w(n) is the weights of the taps, these weights can be different for every tap. u is the step size which is a constant. LMS algorithm can be summarized in the equations below that are in accordance with the steps above,


For the first iteration arbitrary tap weights are assumed and filtering is started. After a few iterations the weights adapt in accordance with the error signal to give desired signal as output. Step size is a main factor that influences weight update equation. If the step size is too small, the convergence of the signal will be too slow and filter requires more memory. If the step size is too high, convergence rate will be faster but there will be information loss.
- NLMS
The convergence of output towards desired signal depends on weight update equation. Tap weights that are updated are directly proportional to the present inputs. If the future inputs to the filter vary greatly with the present inputs of the filter, there will be an increase in the error signal. To solve this problem the step size in weight update equation is normalized with squared Euclidian form of input vector. The weight update equation of NLMS technique is written as,

Here b is a small constant added to avoid difficulties in case of small x(n) values. NLMS method can achieve faster convergence when compared to LMS. Since the step size of these filters does not change much, these are considered as linear filters which give linear output for linear input.
- CSLMS
This method is an improvement of NLMS algorithm to achieve faster stability conditions. Constrained Stability LMS method is described by the equations that follow,

Where 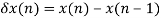 and
and  . A positive constant of small value in the denominator helps preventing problems when value of x(n) is too small. Here the value of error and input in weight update equation not only depend on present value but also previous value, unlike LMS and NLMS where the dependency of weight update equation is more on present values than all the past values combined.
- TVSLMS
Step size in the weight update equation decides the convergence rate of the filter. It is fixed for the filter depending on the input signal, desired signal and required convergence rate. If the input signal is varying with time in an undetermined way, it is difficult to set the value of step size. So, time varying step size method of LMS is proposed. The time variance of step size is determined by a decaying factor. TVSLMS method is described by the following equations,
The step size at each step can be varied according to the following function,

Where  is the decaying factor and C, a and b are positive constants that will determine the value of decaying factor. At each step the decaying factor is multiplied with initial step size. This method can achieve faster convergence rate compared to LMS algorithm with constant step size and also can remove the artifacts effectively.
- ASLMS
In an environment that is not stationary a gradient noise is added to the signal. In such case the value of tap weights change in random fashion instead of terminating on Weiner solution. To overcome this problem Adaptive step size algorithm is proposed where a fourth step is added to the LMS method which resembles the weight update equation. Step size of the filter is updated at each step as,

Here  is a small positive constant and y(n) is defined as the partial derivative of tap weight vector with respect to step size parameter at a sample or iteration.

ASLMS attains faster convergence rate since the step size of next iteration depends on the input and error at current iteration, unlike TVSLMS algorithm where step size of present iteration depends on the initial step size.
- Signed Regressor form
In the methods discussed in this section, from LMS to ASLMS the performance of filters increased with decrease in convergence rate but the computational complexity increased gradually. This will result in delay of attaining desired results. To regulate the problem we use signum function to find the polarity of input signal in weight update equation [21Eweda]. By using signum function to input signal we take into consideration only the sign of input signal as shown below,

The signum function is given as,

The methods discussed above in their signed regressor form have slightly inferior convergence rate and steady state error. But as the mean square error drops the filter speeds up with reduced computations.
- Simulation and results
ICG signals are acquired through VU-AMS (Vrije Universiteit Ambulatory Monitoring System) device under supervision of expert handlers. This device is used for recording ICG signals many a times and provided reliable outputs [18Gonneke- 20Annebet]. Signals are acquired from 19 subjects for a period of 30 minutes. Digitized signals are recorded at 360 samples per second. First 4000 samples of each ICG recording are used for simulation.
References
- Bonjer FH, van den Berg JW, Dirken MNJ. The origin of the variations of body impedance occurring during the cardiac cycle. Circulation. 1952; 6:415-420.
- Cooley WL, The calculation of cardiac stroke volume from variations in transthoracic electrical impedance. Biomed Eng 1972; 19:316-319.
- Nechwatal W, Bier P, Eversmann A, König E, The noninvasive determination of cardiac output by means of impedance cardiography: Comparative evaluation with a thermal dilution technique. Basic Res Cardiol 1976; 71:542-552.
- Denniston JC, Maher JT, Reeves JT, Cruz JC, Cymerman A, Grover RF, “Measurement of cardiac output by electrical impedance at rest and during exercise”. J Appl Physiol 1976;40:91-95.
- M.C. Du Quesnay, G.J. Stoute, and R.L. Hughson, “Cardiac output in exercise by impedance cardiography during breath holding and normal breathing,” J. Appl. Physiol., vol. 62(1), pp 101-107, 1987.
- Juan Carlos Márquez Ruiz, “Sensor-Based Garments that Enable the Use of Bioimpedance Technology: Towards Personalized Healthcare Monitoring”, Doctoral Thesis, Stockholm, Sweden, January 2013, ISBN 978-91-7501-603-0
- Harley A, Greenfield JC Jr. “Determination of cardiac output in man by means of impedance plethysmography”, Aerosp Med. 1968 Mar; 39(3): 248-52.
- R.P. Patterson, “Fundamentals of impedance cardiography,” IEEE Eng. Med. Biol. Mag., vol. 8(1), pp 35-38, 1989.
- Major M J World, “Estimation of Cardiac Output by Bioimpedance Cardiography”, J R Army Med Corps 1990; 136: 92-99
- Nancy M. Albert, “Bioimpedance Cardiography Measurements of Cardiac Output and Other Cardiovascular Parameters”, Crit Care Nurs Clin N Am 18 (2006) 195 – 202
- Chintan V Parmar, Divyesh L Prajapati, Pradnya A Gokhale, Hemant B Mehta, Chinmay J Shah, “Study of cardiac output based on non – invasive impedance plethysmography in healthy volunteers”, 2: 5 Sep – Oct (2012) 104 – 108.
- E.Pinheiro, O.Postolache, P.Girão, “Contactless Impedance Cardiography Using Embedded Sensors”, Measurement science review, Volume 13, No. 3, 2013
- Dilek Cicek Yilmaz, Belgin Buyukakilli, Serkan Gurgul and Ibrahim Rencuzogullari Mersin, “Adaptation of heart to training: A comparative study using echocardiography & impedance cardiography in male & female athletes”, Indian J Med Res 137, June 2013, pp 1111-1120
- Zhili Huang, Zhenshen Zheng, Yutian Wu, “Monitoring Impedance Cardiography By Adaptive Method During External Counterpulsation”, IEEE Engineering in Medicine and Biology Society. Vol. 13. No. 2, 1991.
- Allan Kardec Barros, Makoto Yoshizawa, and Yoshifumi Yasuda, “Filtering Noncorrelated Noise in Impedance Cardiography”, IEEE Transactions on biomedical engineering, VOL. 42, NO. 3, March 1995
- O. Dromer, O. Alata and O. Bernard, “Impedance Cardiography Filtering using Scale Fourier Linear Combiner based on RLS algorithm”, IEEE EMBS, Sep 2009.
- Vinod K. Pandey, Prem C. Pandey, “Cancellation of Respiratory Artifact in Impedance Cardiography”, EMBS, 27th Annual Conference, IEEE, 2005.
- Gonneke H. M. Willemsen, Eco J. C. De Geus, Coert H. A. M. Klaver, Lorenz J. P. Van Doornen, Douglas Carroll, “Ambulatory monitoring of the impedance cardiogram”, Psychophys;o/ogy, 33 (1996), 184- 193 . Cambridge University Press.
- Harriëtte Riese, Paul F. C. Groot, Mireille Van Den Berg, Nina H. M. Kupper, Ellis H. B. Magnee, Ellen J. Rohaan “Large-scale ensemble averaging of ambulatory impedance cardiograms”, Behavior Research Methods, Instruments, & Computers 2003.
- Annebet D. Goedhart *, Nina Kupper, Gonneke Willemsen, Dorret I. Boomsma, Eco J.C. de Geus, “Temporal stability of ambulatory stroke volume and cardiac output measured by impedance cardiography”, Biological Psychology 72, Elsevier(2006)
- E. Eweda, “Analysis and design of a signed regressor LMS algorithm for stationary and nonstationary adaptive filtering with correlated Gaussian data,” IEEE Transactions. Circuits Systems., vol. 37, no. 11, pp. 1367–1374, Nov. 1990.
Cite This Work
To export a reference to this article please select a referencing stye below:
Related Services
View all


DMCA / Removal Request
If you are the original writer of this essay and no longer wish to have your work published on UKEssays.com then please click the following link to email our support team:
Request essay removal