Experiment on Changes in Serum Levels of Irisin
| ✅ Paper Type: Free Essay | ✅ Subject: Physiology |
| ✅ Wordcount: 216 words | ✅ Published: 18 Sep 2017 |
Khaled Abdelfattah Abdelhamid Abulfadle, MD
Serum irisin level changes after propylthiouracil treatment of L-thyroxine induced hyperthyroidism in rats
ABSTRACT
Background: Thyroid hormones play an essential role in lipid, protein and carbohydrate metabolism; and they regulate thermogenesis and basal metabolic rate. Irisin is a myokine that is secreted as a product of fibronectin type III domain containing 5 (FNDC5) was shown to be present in many tissues, including the thyroid tissue.
Objective: To investigate the possible changes in serum levels of irisin that occurred in a rat model of hyperthyroidism and the effects of use of propylthiouracil (PTU) in its treatment.
Design: 18 male albino rats were divided into 3 groups. Group I was the intact control. Rats of group II and III received daily 0.3 mg/kg subcutaneous injection of L-thyroxine (LT4) for 12 consecutive days. On the thirteenth day, animals of group III (Hyperthyroid PTU treated) received 5 ml/kg i.p. injection of propylthiouracil (PTU) along with an equivalent amount of LT4 as administered to group II animals for more 15 days. Animals of group II (Hyperthyroid control) continued to receive LT4. On the day of termination (28th day of starting LT4 treatment), overnight (12hrs) fasted animals were sacrificed by decapitation under ether anesthesia.
Results: In the hyperthyroid control group, there was a significant decrease in serum level of TSH (P<0.001) and BMI (P<0.001), but, a significant increase in serum levels of T4 (P<0.001), T3 (P<0.001), and irisin (P<0.001) in comparison to that in the intact control group. On the other hand, there were insignificant changes (P>0.05) in serum levels of TSH, T4, T3 & irisin, and, BMI in hyperthyroid PTU group in comparison to that in the intact control group. In the hyperthyroid control group, there was a significant increase in the serum level of both glucose (P<0.001) and insulin (P<0.001), and, the value of HOMA-IR (P<0.001) in comparison to that of the intact control group. On the other hand, there were no significant changes in their values (P>0.05) in the hyperthyroid PTU treated group in comparison to that in the intact control group. In the hyperthyroid control group, there was a significant decrease in serum levels of both TC (P<0.001) and HDL-C (P<0.001) but, there were insignificant changes (P>0.05) in serum levels of both TG and LDL-C in comparison to that in the intact control group.
Conclusion: This study showed a significant increase in serum levels of irisin in L-thyroxine induced hyperthyroidism in rats. On using PTU, serum levels of irisin, thyroid hormones, metabolic parameters and BMI were significantly changed in comparison to the hyperthyroid control group.
Keywords: Irisin, T3, T4, TSH, Propylthiouracil, Hyperthyroidism.
Introduction:
Irisin is a myokine that is secreted as a product of fibronectin type III domain containing 5 (FNDC5) in the skeletal muscle (Samy, Ismail et al. 2015, Jin Zhang 2017, Nathan C. Winn 2017). FNDC5, which is the precursor of irisin was shown to be present in many tissues, including the thyroid tissue (Huh, Panagiotou et al. 2012). It is secreted by a peroxisome proliferator-activated receptor γ (PPARγ) coactivator 1α (PGC1-α) after an exercise (Aydin 2014). Irisin was found to have an anti-obesity effect as it replaces the white fatty tissue with brown fatty tissue by the increase of uncoupling protein-1 (UCP1) resulting in oxygen consumption and stimulation of thermogenesis (Boström, Wu et al. 2012, Castillo-Quan 2012, Roca-Rivada, Castelao et al. 2013, Jin Zhang 2017, Nathan C. Winn 2017). Stengel, Hofmann et al. (2013) found that irisin level was identified to be high in obesity and to be low in anorexia nervosa. On the other hand, thyroid hormones play an essential role in lipid, protein and carbohydrate metabolism; and they regulate thermogenesis and basal metabolic rate (Hulbert 2000). Also, hyperfunction of thyroid gland is a common endocrine disorder which is accompanied by metabolic imbalance, oxidative stress and abnormal energy homeostasis (Erdamar, Demirci et al. 2008). There were some controversies in the results of studying the effect of thyroid hormone level changes on serum levels of irisin as Yalcin, Akturk et al. (2016) found an increase in serum irisin levels in hyperthyroidism and they suggested that it might contribute to altered energy metabolism. Also, Samy, Ismail et al. (2015) stated that hyperthyroidism was associated with up-regulation of serum irisin in male rats, probably as a response to myopathy and/or oxidative damage observed in both conditions. Moreover, Ruchala, Zybek et al. (2014) reported a borderline elevation of serum irisin in hyperthyroid versus hypothyroid patients. On the contrary, Panagiotou, Pazaitou-Panayiotou et al. (2016) stated that changes in thyroid hormone levels did not affect circulating irisin levels in humans. Also, Stengel, Hofmann et al. (2013), Ellefsen, Vikmoen et al. (2014) and Gouni-Berthold, Berthold et al. (2013) reported lack of associations between levels of irisin, TSH and/or thyroid hormones. On the other hand, Zybek-Kocik, Sawicka-Gutaj et al. (2016) stated that irisin concentration was changed during prolonged thyroid function impairment. Also, AteÅŸ, Altay et al. (2016) found that, in hypothyroidism, there was a positive correlation between serum irisin levels and thyroid stimulating hormone (TSH) while a negative correlation was found between irisin levels and thyroxine (T4). Thus, this study was conducted to investigate the possible changes in serum levels of irisin that occurred in a rat model of hyperthyroidism and the effects of use of propylthiouracil (PTU) in its treatment.
Materials and Methods:
Animals’ preparations and experimental protocol:
In the Department of Physiology, Faculty of Medicine, Zagazig University, this experimental study was done from 6th of November 2016 to 28th of December 2016. 18 adult male albino rats, age and weight matched (170-195 gm), were purchased from the animal house of Zagazig University and were housed at 20-22°C on a 12-h light-dark cycle and for 5 days, to achieve acclimatization, they were supplied with tap water and a standard chow diet. Rats were divided into 3 groups of 6 each. Group I animals served as the intact control, whereas those of group II and III received daily subcutaneous injection of L-thyroxine (LT4) (Sigma, MO, USA) at a dose of 0.3 mg/kg for 12 consecutive days (Panda and Kar 2007). On the thirteenth day, animals of group III received propylthiouracil (PTU) (Sigma, MO, USA) 10 mg/kg intraperitoneally (Panda and Kar 2007) along with an equivalent amount of LT4 as administered to group II animals. PTU was intraperitoneally (i.p.) injected, in a volume of 5 ml/kg, dissolved in saline (Kim, Kim et al. 2012). Experiment was continued for more 15 consecutive days (from 13th LT4 treatment). Animals of group II continued to receive LT4 and acted as hyperthyroid control. Intact control rats were injected with 5 ml/kg/day subcutaneously with saline. On the day of termination (28th day of starting LT4 treatment), overnight (12hrs) fasted animals were sacrificed by decapitation under ether anesthesia. Blood from each animal was collected and by its centrifugation at 3000 rpm for 15 minutes, serum was separated and stored -20oc till the time of assay of different biochemical parameters (Kumar, Kar et al. 2014). PTU was used to treat hyperthyroidism by decreasing the amount of thyroid hormone produced by the thyroid gland (Nakamura, Noh et al. 2007), and it also inhibited the enzyme 5-deiodinase, which converts thyroxine (T4) to the active form triiodothyronine (T3) (Bahn, Burch et al. 2009). Also, it inhibited LT4-induced hyperthyroidisms in rats (Panda and Kar 2007).
Body mass index (BMI) changes:
BMI in gm/cm2 was calculated in the different groups, just before rats were sacrificed (under ether anesthesia), by dividing Body weight (gm) on Length2 (cm2) (Novelli, Diniz et al. 2007). A graduated (in centimeters) metal ruler was used for measuring the rat length by putting the zero end at the rat anus and recorded the reading which reached by the nose. BMI was used as a measure for the change in body weight of rats (Novelli, Diniz et al. 2007).
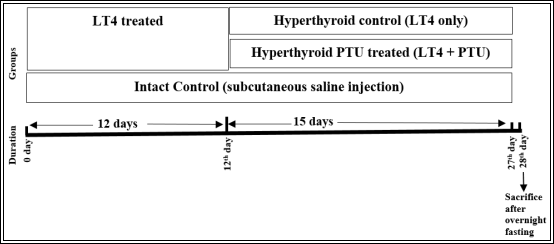
Figure-1: Experimental design. Rats were divided into 3 groups. Group I was the intact control. Rats of group II and III received daily subcutaneous injection of levothyroxine (LT4) for 12 consecutive days. On the thirteenth day, animals of group III (Hyperthyroid PTU treated) received i.p. injection of propylthiouracil (PTU) along with an equivalent amount of LT4 as administered to group II animals for more 15 days. Animals of group II (Hyperthyroid control) continued to receive LT4. On the day of termination (28th day of starting LT4 treatment), overnight (12hrs) fasted animals were sacrificed by decapitation under ether anesthesia.
Measurement of serum parameters:
Serum level of irisin was estimated (in ng/ml) using an irisin rat ELISA assay kit following the manufacturer’s instructions (Catalog# EK-067-52; Phoenix Pharmaceuticals Inc., Burlingame, California, USA) with a detection range of 0.1-1000 ng/ml. Quantitative immunoassaying of T3, T4 and TSH using commercially available kits as recommended by the manufacturer (cat#SE120091, SE120090, SE120135, ELISA Kits, Sigma-Aldrich). Both serum levels of total cholesterol (TC) and triglycerides (TG) were estimated using enzymatic colorimetric methods. Serum high density lipoprotein-cholesterol (HDL-C) was assayed using NS Biotec HDL-precipitating reagent. Serum low density lipoprotein-cholesterol (LDL-C) was calculated using the Friedewald formula:
LDL-C (mg/dl) = [(TC) – (HDL-C) – ( (Friedewald, Levy et al. 1972)
Estimation of both serum glucose levels, using an automated analyzer (YSI 2300; YSI Life Sciences, Yellow Springs, OH), and serum insulin levels, using ELISA kits (R&D Systems, Minneapolis, MN), were done. For assessing insulin resistance (IR), the homeostasis model assessment-IR (HOMA-IR) index was calculated by:
HOMA-IR = 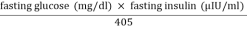 (Nayak, Hillemane et al. 2014).
There is a direct relation between insulin resistance and the value of HOMA-IR (Bonora, Targher et al. 2000).
Statistical analysis:
By the use of IBM SPSS Statistics for windows package version (24), data were analyzed and described as Mean± SEM. For calculation of the statistical significance, One-way ANOVA and Tukey HSD post hoc test for multiple group comparison were used. P‰¤0.05 indicated significance.
Results:
Table-1: Changes in serum levels of TSH, T4, T3 & irisin, and, BMI among different groups
|
Intact control |
Hyperthyroid control |
Hyperthyroid PTU treated |
|
|
TSH (ïIU/L) |
2.82±0.12 |
0.81±0.05a |
2.68±0.14b&c |
|
T4 (ïg/dl) |
5.33±0.14 |
16.2±0.2a |
5.36±0.18b&c |
|
T3 (ng/ml) |
1.29±0.04 |
3.52±0.11a |
1.36±0.04b&c |
|
Irisin (ng/ml) |
401.67±5.65 |
599.17±6.82a |
409.5±6b&c |
|
BMI (gm/cm2) |
0.54±0.01 |
0.44±0.01a |
0.51±0.01b&c |
Data was expressed as Mean±SEM. a P<0.001 in comparison to the intact control group. b P>0.05 in comparison to the intact control group. c P<0.001 in comparison to the hyperthyroid control group. TSH, thyroid stimulating hormone; T3, triiodothyronine; T4, thyroxin; PTU, propylthiouracil; BMI, body mass index.
Table-2: Changes in metabolic parameters among different groups
|
Intact control |
Hyperthyroid control |
Hyperthyroid PTU treated |
|
|
Glucose (mg/dl) |
91.5±0.92 |
113±2.33a |
91.33±1.2b&c |
|
Insulin (ïIU/ml) |
2.95±0.12 |
4.86±0.16a |
2.88±0.13b&c |
|
HOMA-IR |
0.67±0.02 |
1.36±0.05a |
0.65±0.03b&c |
|
TC (mg/dl) |
106.5±2.51 |
89.83±2.52a |
103.33±1.63b&d |
|
TG (mg/dl) |
55.17±1.22 |
52.33±0.67b |
53.17±0.95b&e |
|
HDL-C (mg/dl) |
54±1.15 |
43.33±0.88a |
51.33±0.99b&c |
|
LDL-C (mg/dl) |
41.47±3.27 |
36.03±3.07b |
41.37±1.92b&e |
Data was expressed as Mean±SEM. a P<0.001 in comparison to the intact control group. b P>0.05 in comparison to the intact control group. c P<0.001 in comparison to the hyperthyroid control group. d P<0.01 in comparison to the hyperthyroid control group. e P>0.05 in comparison to the hyperthyroid control group. HOMA-IR, homeostasis model assessment of insulin resistance index; TC, total cholesterol; TG, triglycerides; HDL-C, high density lipoprotein-cholesterol; LDL-C, low density lipoprotein-cholesterol.
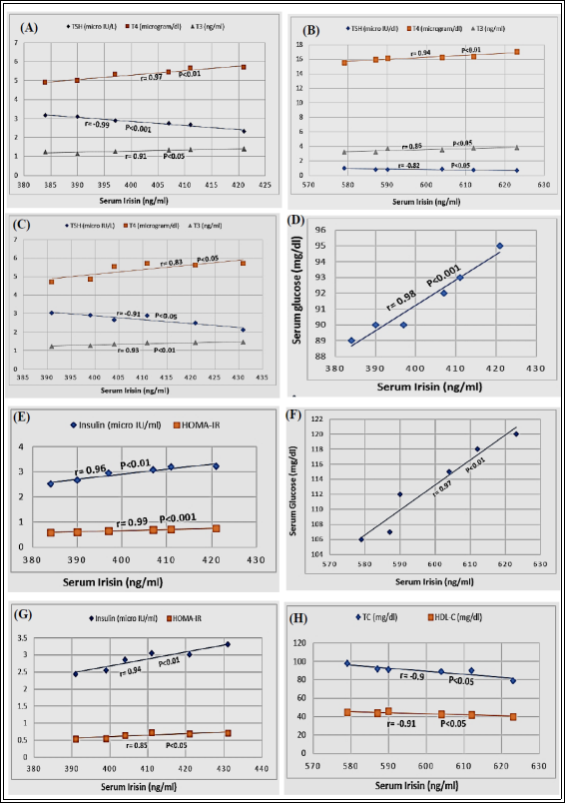
Figure-2: Correlations between serum irisin levels and: TSH, T4 & T3 in, the intact control group (A), hyperthyroid control group (B) and hyperthyroid PTU treated group (C); glucose in the intact control group (D); insulin & HOMA-IR in the intact control group (E); glucose in the hyperthyroid control group (F); insulin & HOMA-IR in the hyperthyroid PTU treated group (G); TC & HDL-C in the hyperthyroid control group (H). r is the correlation coefficient.
Table-1 showed changes in serum levels of TSH, T4, T3 & irisin, and, BMI among different groups. In the hyperthyroid control group, there was a significant decrease in serum level of TSH (0.81±0.05, P<0.001) and BMI (0.44±0.01, P<0.001), but, a significant increase in serum levels of T4 (16.2±0.2, P<0.001), T3 (3.52±0.11, P<0.001), and irisin (599.17±6.82, P<0.001) in comparison to that in the intact control
group (2.82±0.12), (0.54±0.01) (5.33±0.14), (1.29±0.04) and (401.67±5.65) respectively. On the other hand, there were insignificant changes (P>0.05) in serum levels of TSH, T4, T3 & irisin, and, BMI in hyperthyroid PTU group in comparison to that in the intact control group. Also, there was a significant increase in both serum level of TSH (2.68±0.14, P<0.001) and BMI (0.51±0.01, P<0.001), but, a significant decrease in serum levels of T4 (5.36±0.18, P<0.001), T3 (1.36±0.04, P<0.001), and irisin (409.5±6, P<0.001) in the hyperthyroid PTU treated group in comparison to that in the hyperthyroid control group (0.81±0.05), (0.44±0.01) (16.2±0.2), (3.52±0.11) and (599.17±6.82) respectively. Table-2 showed changes in metabolic parameters among different groups. In the hyperthyroid control group, there was a significant increase in the serum level of both glucose (113±2.33, P<0.001) and insulin (4.86±0.16, P<0.001), and, the value of HOMA-IR (1.36±0.05, P<0.001) in comparison to that of the intact control group (91.5±0.92), (2.95±0.12) and (0.67±0.02) respectively. On the other hand, there were no significant changes in their values (P>0.05) in the hyperthyroid PTU treated group in comparison to that in the intact control group. Moreover, there was a significant decrease in the serum levels of both glucose (91.33±1.2, P<0.001) and insulin (2.88±0.13, P<0.001), and, the value of HOMA-IR (0.65±0.03, P<0.001) in the hyperthyroid PTU treated group in comparison to that of the hyperthyroid control group (113±2.33), (4.86±0.16) and (1.36±0.05) respectively. On studying changes in the lipid profile among different groups, in the hyperthyroid control group, there was a significant decrease in serum levels of both TC (89.83±2.52, P<0.001) and HDL-C (43.33±0.88, P<0.001) but, there were insignificant changes (P>0.05) in serum levels of both TG (52.33±0.67) and LDL-C (36.03±3.07) in comparison to that in the intact control group (106.5±2.51), (54±1.15), (55.17±1.22) and (41.47±3.27) respectively. In the hyperthyroid PTU treated group, there was a significant increase in serum levels of both TC (103.33±1.63, P<0.01) and HDL-C (51.33±0.99, P<0.001) but, there were insignificant changes (P>0.05) in serum levels of both TG (53.17±0.95) and LDL-C (41.37±1.92) in comparison to that in the intact control group (89.83±2.52), (43.33±0.88), (52.33±0.67) and (36.03±3.07) respectively. Also, there were no significant changes (P>0.05) in serum levels of TC, TG, HDL-C and LDL-C in the hyperthyroid PTU treated group in comparison to that in the intact control group. Figure-2A showed a significant positive correlation between serum irisin levels and that of T4 (r=0.97, P<0.01) & T3 (r=0.91, P<0.05) but a significant negative one with serum TSH (r=-0.99, P<0.001) in the intact control group. Figure-2B showed a significant positive correlation between serum irisin levels and that of T4 (r=0.94, P<0.01) & T3 (r=0.86, P<0.05) but a significant negative one with serum TSH (r=-0.82, P<0.05) in the hyperthyroid control group. Figure-2C showed a significant positive correlation between serum irisin levels and that of T4 (r=0.83, P<0.05) & T3 (r=0.93, P<0.01) but a significant negative one with serum TSH (r=-0.91, P<0.05) in the hyperthyroid PTU treated group. Figure-2D showed a significant positive correlation between serum irisin levels and that of glucose (r=0.98, P<0.001) in the intact control group. Figure-2E showed significant positive correlations between serum irisin levels and both serum insulin (r=0.96, P<0.01) and HOMA-IR (r=0.99, P<0.001) in the intact control group. Figure-2F showed a significant positive correlation between serum irisin levels and that of glucose (r=0.97, P<0.01) in the hyperthyroid control group. Figure-2G showed significant positive correlations between serum irisin levels and both serum insulin (r=0.94, P<0.01) and HOMA-IR (r=0.85, P<0.05) in the hyperthyroid PTU treated group. Figure-2H showed significant negative correlations between serum irisin levels and that of both TC (r=-0.9, P<0.05) and HDL-C (r=-0.91, P<0.05) in the hyperthyroid control group.
Discussion:
This study was done to declare changes in irisin serum levels in a rat model of hyperthyroidism and the effect of PTU therapy on it. Also, to identify the association between serum irisin level changes in such conditions and some metabolic parameters including insulin resistance and lipid profile. The results of this study showed a significant decrease in serum level of TSH and BMI, but, a significant increase in serum levels of T4, T3, and irisin in the hyperthyroid control group, in comparison to that in the intact control group. Also, there was a significant positive correlation between serum irisin levels and that of T4 & T3 but a significant negative correlation with serum TSH in the hyperthyroid control group. These results were supported by Huh, Panagiotou et al. (2012) who stated that FNDC5, irisin precursor, was present in the thyroid tissue. Also, the present study results were supported by Irrcher, Adhihetty et al. (2003), Ruchala, Zybek et al. (2014), Sanchis-Gomar and Perez-Quilis (2014), Samy, Ismail et al. (2015) and Yalcin, Akturk et al. (2016) who found an increase in serum irisin levels in hyperthyroidism and they suggested that it might contribute to altered energy metabolism. Moreover, Irrcher, Adhihetty et al. (2003) reported that T3 increased the irisin precursor, PGC-1α, expression in muscle. Furthermore, Sanchis-Gomar and Perez-Quilis (2014) stated that serum irisin was increased in hyperthyroidism as a compensatory response to oxidative stress as it had an antioxidant effect. On the contrary, Gouni-Berthold, Berthold et al. (2013), Stengel, Hofmann et al. (2013) and Panagiotou, Pazaitou-Panayiotou et al. (2016) stated that changes in levels of thyroid hormones did not affect circulating irisin levels in humans. This discrepancy between their results and that of this study could be explained by species difference. Regarding the negative correlation between both irisin and TSH hormones which was present in this study, it was supported by Ruchala, Zybek et al. (2014). On the contrary, Stengel, Hofmann et al. (2013) and Ellefsen, Vikmoen et al. (2014) reported lack of correlation between serum levels of irisin and that of TSH and thyroid hormones. Regarding body weight changes with hyperthyroidism, the result of this study was supported by Janson, Karlsson et al. (1995), Voldstedlund, Tranum-Jensen et al. (1995) and Loeb (1996) who found a decrease in body weight with hyperthyroidism. Also, this study results were supported by Boström, Wu et al. (2012), Castillo-Quan (2012) and Roca-Rivada, Castelao et al. (2013) who found that irisin had an anti-obesity effect as it replaced the white adipose tissue with brown adipose tissue and increased oxygen consumption and thermogenesis. On the contrary, Stengel, Hofmann et al. (2013) and Saleh, et al. (2014) found that irisin level was high in obesity and low in anorexia nervosa. This discrepancy between their results and that of this study can be explained by species difference. On the other hand, this study results showed insignificant changes in serum levels of TSH, T4, T3 & irisin, and, BMI in hyperthyroid PTU group in comparison to that in the intact control group. This indicated the improvement that occurred with PTU therapy in cases of hyperthyroidism which was supported by Nakamura, Noh et al. (2007), Panda and Kar (2007) and Bahn, Burch et al. (2009). Also, the results of this study showed a significant increase in both serum level of TSH and BMI, but, a significant decrease in serum levels of T4, T3, and irisin in the hyperthyroid PTU treated group in comparison to that in the hyperthyroid control group. These results were supported by Park, Lee et al. (2016) who found that PTU administration ameliorated hyperthyroidism, reducing T4 and T3, and, increasing both TSH and BMI. Moreover, the results of this study showed a significant increase in the serum level of both glucose and insulin, and, the value of HOMA-IR in the hyperthyroid control group in comparison to that of the intact control group. Also, there was a significant positive correlation between serum irisin levels and that of glucose in the hyperthyroid control group. These results indicated occurrence of insulin resistance with hyperthyroidism which was supported by Loeb (1996). This was supported also by Saleh, et al. (2014) who stated that hyperglycemia gradually up regulated FNDC5/irisin expression in the skeletal muscles non-diabetic persons. Also, this study results were supported by Hee Park, Zaichenko et al. (2013), Liu, Wong et al. (2013) and Mehrabian, Taheri et al. (2016) who found a positive correlation between serum irisin and that of glucose. On the contrary, Mehrabian, Taheri et al. (2016) found that serum irisin was negatively correlated with serum glucose level. Opposite to the results of this study, Huh, Panagiotou et al. (2012), Choi, Kim et al. (2013) and Sanchis-Gomar and Perez-Quilis (2014) found that decreased blood irisin level was accompanied by insulin resistance development. Sanchis-Gomar and Perez-Quilis (2014) stated also, that irisin ameliorated insulin resistance by increasing betatrophin hormone expression which stimulated β-cell regeneration. Furthermore, the results of this study showed no significant changes in the serum level of both glucose and insulin, and, the value of HOMA-IR in the hyperthyroid PTU treated group in comparison to that in the intact control group. Also, there was a significant decrease in the serum levels of both glucose and insulin, and, the value of HOMA-IR in the hyperthyroid PTU treated group in comparison to that of the hyperthyroid control group which means improvement of insulin resistance with PTU treatment. On the other hand, Huh, Panagiotou et al. (2012) found that exposure to high blood glucose for a long time was associated with a significant decrease in irisin serum level. The discrepancy between their results and the result of this study could be explained by the difference in species and duration of the study. In the hyperthyroid control group, there was a significant decrease in serum levels of both TC and HDL-C but, there were insignificant changes in serum levels of both TG and LDL-C in comparison to that in the intact control group. Also, there were significant negative correlations between serum irisin levels and that of both TC and HDL-C in the hyperthyroid control group. On the other hand, in the hyperthyroid PTU treated group, there was a significant increase in serum levels of both TC and HDL-C but, there were insignificant changes in serum levels of both TG and LDL-C in comparison to that in the intact control group. Also, there were no significant changes in serum levels of TC, TG, HDL-C and LDL-C in the hyperthyroid PTU treated group in comparison to that in the intact control group. The results of this study was partly supported by Mehrabian, Taheri et al. (2016) found a negative correlation between irisin and TC but, a positive correlation with HDL-C in normal weight obesity. On the other hand, Liu, Wong et al. (2013) found a positive correlation between serum irisin level and TC in non- obese, non- diabetic persons. Also, Sanchis-Gomar, Alis et al. (2014) reported insignificant correlation between irisin and TC.
Conclusion
This study showed a significant increase in serum levels of irisin in L-thyroxine induced hyperthyroidism in rats and this could be related to changes in thyroid hormones, body weight and metabolic parameters. On using PTU, serum levels of irisin, thyroid hormones, metabolic parameters and BMI were significantly changed in comparison to the hyperthyroid control group and insignificantly changed in comparison to the intact control group which confirmed the improvement of the hyperthyroidism. Future studies are needed to confirm these results and to ensure the possible use of irisin as a biomarker for proper treatment of hyperthyroidism.
Cite This Work
To export a reference to this article please select a referencing stye below:
Related Services
View all


DMCA / Removal Request
If you are the original writer of this essay and no longer wish to have your work published on UKEssays.com then please click the following link to email our support team:
Request essay removal