Relationship Between a Conductor’s Length and Wire
| ✅ Paper Type: Free Essay | ✅ Subject: Physics |
| ✅ Wordcount: 2557 words | ✅ Published: 15 Sep 2017 |
Electricity has become very useful and has changed everyone’s life since the day it was discovered.
- What is Conductivity?
- What is Resistance?
- What is the best conductor of electricity?
- What is Nichrome Wire?
There are many factors that influence the electrical resistance in wires, going through a current in circuits. The length of the wire and the cross-sectional area are two very important variables. The flow of charge through wires is often compared to the flow of water through pipes. The resistance to the flow of charge in an electric circuit is analogous to the frictional effects between water and the pipe surfaces as well as the resistance offered by obstacles that are present in its path (The Physics classroom,2016)
The total length of the wires will affect the amount of resistance. The longer the wire, the more resistance that there will be. There is a direct relationship between the amount of resistance encountered by charge and the length of wire it must traverse. After all, if resistance occurs as the result of collisions between charge carriers and the atoms of the wire, then there is likely to be more collisions in a longer wire. More collisions mean more resistance.
The cross-sectional area of the wires will affect the amount of resistance. Wider wires have a greater cross-sectional area. Water will flow through a wider pipe at a higher rate than it will flow through a narrow pipe. This can be attributed to the lower amount of resistance that is present in the wider pipe. (The Physics classroom,2016) In the same manner, the wider the wire, the less resistance that there will be to the flow of electric charge. When all other variables are the same, charge will flow at higher rates through wider wires with greater cross-sectional areas than through thinner wires.[AR3]
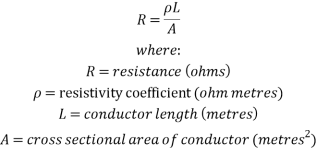
Another formula that will be used is the resistance formula which will
 (Physicsclassroom, 2016)
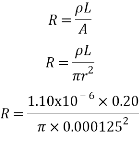
To work out the cross-sectional area of the wire, the formula

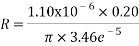
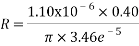
The wire that will be used in the experiment is nichrome 30 wire which has a radius of 0.000125m and also nichrome 22 wire, with a radius of 0.0346mm [AR4](3.46e-5m)
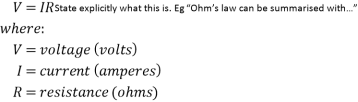
Ohm’s law deals with the relationship between voltage, current and resistance. Voltage is the difference in electrical potential energy. For example, if you have a simple circuit with a battery powering a lamp, the electrons will move from the negative side of the battery, through the lamp and then to the positive side. The voltage or the difference in electrical potential energy, between the positive and negative ends of the battery would be the amount labelled on the battery because the charge was used to move the electron around the circuit. A good analogy for voltage is a waterfall. The water at the top of the waterfall is similar to the negatively charged electrons and the water at the bottom of fall is similar to the discharged electrons. As the water flows from the top of the fall to the bottom it loses all of it gravitational potential energy just like the electrons losing their charge when they travel around the circuit. Current is the total amount of charge passing through a conductor over a period of time. The water analogy for current would be how fast the water is flowing or how much water is passing through a bit of river over a period of time. [AR5](Crash Course, 2016)
Ohm’s law can be summarised with
(Hyperphysics, 2016)
Since the results of the experiment will be recorded using a voltmeter and ammeter, the resistance will have to be calculated using ohms’ law re-arranged
 (Hyperphysics, 2016)
Resistivity P (Ohm M) = and a resistivity coefficient 1.10×10⁻⁶Ωm to 1.50×10⁻⁶Ωm at 20°C so this figure will be used in the resistance formula [AR6](Elert, 2016)
 4.481
4.481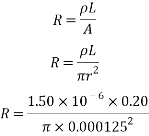

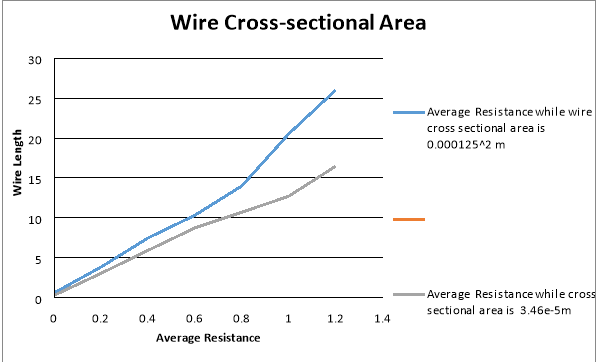
Change of conductor cross sectional area

R= 3.00

R= 6.00
|
Lengths of conductor |
Resistance wire area of |
Resistance wire area of 3.46e-5m |
|
0.2 |
4.481 |
3.000 |
|
0.4 |
8.964 |
6.000 |
|
0.6 |
13.44 |
9.011 |
|
0.8 |
17.92 |
12.015 |
|
1 |
22.4 |
15.019 |

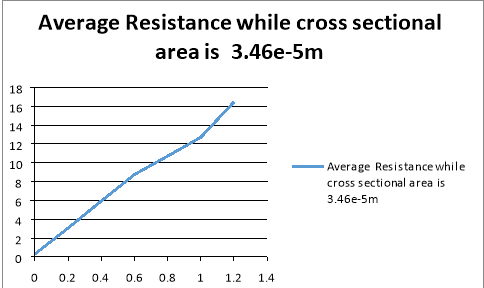
This process was repeated for all figures/ conductor cross sectional area and the following graph and tables gives the result[AR9]
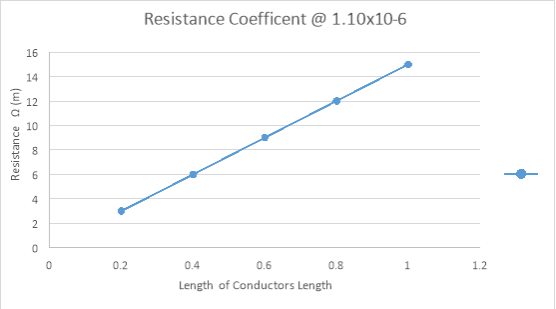
Figure 1 The graph above shows the resistance when the wire cross sectional area is at 3.46e-5m, while the length of the wire/ conductor changes
The above research prompts the following hypothesis:
If the length of an electrical conductor increases, then the conductor’s resistance will increase[AR10], if the cross-sectional area increases, then the resistance will increase because resistance occurs due to charge carriers and the atoms of the wire colliding, longer wire, more collisions[AR11][AR12].
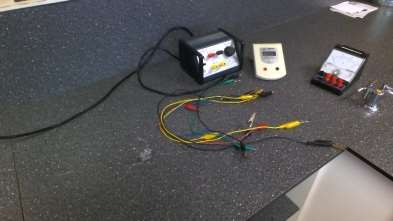
Equipment was gathered which included a voltmeter, ammeter, 12v power supply and nichrome wire were all joined together to making a complete circuit[AR14]. Alligator clip leads helped to complete the circuit. Pliers were used to straighten and scissors to cut the wire. 0.20m of nichrome wire was put into the circuit and was taped to the metre ruler to keep the wire as straight as possible so the length can be measured as accurate as possible. The length of varied, the wire went up by 0.20m intervals all the way up too 1.20m, starting from 0.20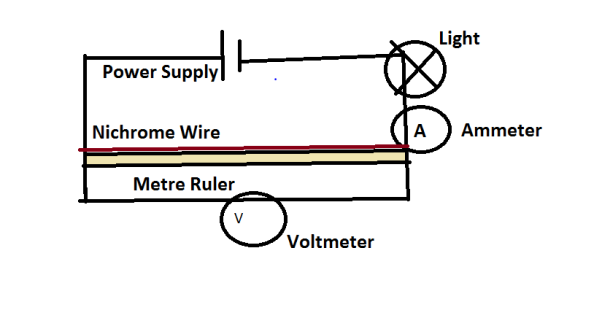
Figure 3: Self Drawn, Word
The voltmeter was in parallel to the exposed nichrome wire because it measured the energy difference between two points. If it was connected in series it would barley measure anything because the energy difference would be so insignificant. The ammeter measured the current passing through the wire. If it was connected in parallel, it would not be measuring the current through the nichrome wire. A light bulb was used to consume the energy to avoid a short circuit[AR16].
The independent variable was the length of the exposed nichrome wire. The dependent variable was the electrical resistance of the wire. The controlled variables included wire thickness, material, temperature, as these are all known variables that effect resistance, same equipment because small differences in calibration will affect their readings, same people doing the same jobs so that everything thing is done in the same way each time, same circuit/configuration as to not produce inconsistencies.
This experiment was hazardous, injury was avoided as precautions were taken. All sharp objects such as scissors and pliers were used with caution to avoid cuts and pinches. Eye protection was used when cutting to avoid pieces of wire flying into eyes. Electrocution was avoided by having dry hands and only modifying the circuit when the power supply was off.[AR17]
To find Resistance

This Formula above was used to find the Resistance
|
Resistance[AR19] coefficent @ 1.10×10⁻⁶m wire area of 3.46e-5m |
||||||||||
|
Wire Length (m) |
Current Trial 1 (A) |
Current Trial 2 (A) |
Current Trial 3[AR20] (A) |
Average Current |
Voltage Trial 1 (V) |
Voltage Trial 2 (V) |
Voltage Trial 3 (V) |
Average (V) |
Average Resistance |
|
|
0.00 |
0.088 |
0.088 |
0.088 |
0.0880 |
0.025 |
0.032 |
0.028 |
0.028 |
0.318 |
|
|
0.20 |
0.088 |
0.087 |
0.087 |
0.0875 |
0.276 |
0.272 |
0.264 |
0.270 |
3.068 |
|
|
0.40 |
0.088 |
0.087 |
0.087 |
0.0875 |
0.523 |
0.518 |
0.526 |
0.523 |
5.943 |
|
|
0.60 |
0.088 |
0.088 |
0.089 |
0.0885 |
0.775 |
0.772 |
0.762 |
0.770 |
8.75 |
|
|
0.80 |
0.087 |
0.084 |
0.083 |
0.0855 |
0.960 |
0.920 |
0.950 |
0.943 |
10.71 |
|
|
1.00 |
0.088 |
0.086 |
0.087 |
0.0860 |
1.120 |
1.122 |
1.120 |
1.120 |
12.72 |
|
|
1.20 |
0.088 |
0.089 |
0.088 |
0.0885 |
1.450 |
1.450 |
1.450 |
1.450 |
16.47 |
|
|
Resistance coefficent @ 1.10×10⁻⁶¦m @ wire area of |
||||||||||
|
Wire Length (m) |
Current Trial 1 (A) |
Current Trial 2 (A) |
Current Trial 3 (A) |
Average Current |
Voltage Trial 1 (V) |
Voltage Trial 2 (V) |
Voltage Trial 3 (V) |
Average (V) |
Average Resistance |
|
|
0.00 |
0.088 |
0.080 |
0.088 |
0.0850 |
0.050 |
0.056 |
0.054 |
0.055 |
0.625 |
|
|
0.20 |
0.088 |
0.088 |
0.088 |
0.0880 |
0.340 |
0.340 |
0.340 |
0.340 |
3.863 |
|
|
0.40 |
0.089 |
0.088 |
0.088 |
0.0885 |
0.599 |
0.659 |
0.659 |
0.659 |
7.488 |
|
|
0.60 |
0.088 |
0.088 |
0.088 |
0.0880 |
0.860 |
0.910 |
0.910 |
0.910 |
10.34 |
|
|
0.80 |
0.087 |
0.087 |
0.088 |
0.0875 |
1.134 |
1.234 |
1.233 |
1.233 |
14.01 |
|
|
1.00 |
0.088 |
0.088 |
0.088 |
0.0880 |
1.340 |
1.642 |
1.642 |
1.642 |
20.52 |
|
|
1.20 |
0.088 |
0.089 |
0.088 |
0.0885 |
1.601 |
1.601 |
1.601 |
1.601 |
26.008 |
|

From the results
It is nearly impossible to get perfect results as the independent are not able to be controlled. [AR22]
When the wire was at 0.20m,  the resistance was 3.865 Ω and when the wire area cross sectional was 3.46e-5m the resistance was 3.068 Ω Knowing that per the original hypothesis that “the wider the cross sectional, less resistance. So, when the wire was at 0.20m, it agrees with the hypothesis. Comparing the theoretical data to the actual results when the wire was 3.46e-5m were surprisingly close. Knowing that the result was 3.068 Ω and the theoretical data was 3.00 Ω.[AR23]
When the wire was at 0.40m, the resistance was 7.488 Ω and when the wire area cross sectional was 3.46e-5m the resistance was 5.943 Ω. Again, agreeing with the hypothesis. The theoretical data was also close the actual result. “If the length of an electrical conductor increases, then the conductor’s resistance will increase” was stated in my hypothesis and was supported by the results as the length increased to 0.40m and the end result of the resistance was increased from 3.865 to 7.488

When the wire was at 0.60m, the resistance was 10.34 and when the wire area cross sectional was 3.46e-5m the resistance was 8.75
When the wire was at 0.80m, the resistance was 14.01 and when the wire area cross sectional was 3.46e-5m the resistance was 10.71
When the wire was at 1.00m, the resistance was 20.52 and when the wire area cross sectional was 3.46e-5m the resistance was 12.72
When the wire was at 1.20m, the resistance was 26.008 and when the wire area cross sectional was 3.46e-5m the resistance was 16.47[AR24]
There are many possible errors with this experiment
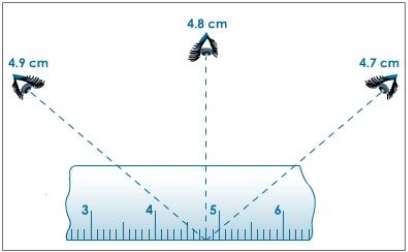 Parallax view is the difference of where the objects apparent positioning is, changing due to the change in viewing angle. This may have caused a problem as the ammeter and voltmeter both have needled in front of the scale/numbers. To get the correct numbers while using both these measuring instruments, it was a necessity to read the numbers perpendicular to both the ammeter and voltmeter. The makers of both of these instruments have thought of this and there will often will be a reflective strip below the scale so that the user can line up the real pointer with the pointer reflection so they know that their eye is perpendicular to the surface. Another simpler solution would be to use digital devices that tell you the exact number, leaving out the ability for human error.
Whenever a conductor has a current flowing through it, the resistance will generate heat, which then makes the conductor more resistive. In a conductor like nichrome, used in heating elements because of its high resistivity, it takes longer for it to heat up and to reach a resistance that is stable. If the resistance was measured when it wasn’t stable, then you would receive results that were lower than the actual value. The obvious solution to this is to wait a little bit after the power supply is turned on so the wire has time to heat up or to use a thermometer to make sure that the wire is the same temperature. [AR26](Electrical4u.com, 2016)
Another error was the length of the wire. Even though the wire was as straight as possible when put into the circuit, there were still slight bends in the nichrome wire making slightly longer than the actually measurement. This would affect the results as instead of the wire being exactly 0.80m; it might be 0.83m, which would be enough to change the resistance total.
Another error that I was faced with is, If a wire is bent past its minimum bend radius, the cross-sectional area of the damaged section will be smaller. Because a bent wire has a smaller cross sectional area, its resistance will increase. This applies to the experiment in terms of wire degradation and wire handling. The wires need to be of a consistent cross sectional area, otherwise, the results will inaccurate.[AR27]
References
Physicsclassroom.com. (2016). Ohm’s Law. [online] Available at: http://www.physicsclassroom.com/class/circuits/Lesson-3/Ohm-s-Law (Accessed 5 Mar 17).
Physicsclassroom.com. (2016). Resistance. [online] Available at: http://www.physicsclassroom.com/class/circuits/Lesson-3/Resistance (Accessed 5 Mar 17).
Pic Wire & Cable. (2016). Cable Bend Radius | Coaxial Cable Bend Radius | Triaxial Cable Bend Radius. [online] Available at: http://www.picwire.com/technical/bend_radius.php [Accessed 14 Nov. 2016].at: http://www.picwire.com/technical/bend_radius.php (Accessed 5 Mar 17).
Crash Course, (2016). Electric Current: Crash Course Physics #28. [image] Available at: https://www.youtube.com/watch?v=HXOok3mfMLM&list=PL8dPuuaLjXtN0ge7yDk_UA0ldZJdhwkoV&index=28 (Accessed 5 Mar 17).
Electrical4u.com. (2016). Joules Law of Heating | Electrical4u. [online] Available at: http://www.electrical4u.com/joules-law/ (Accessed 5 Mar 17).
[AR1]Put more detail into your abstract. See the document online titled “Deadly EEI”. They have a whole section abstracts:
An abstract is a paragraph, that if read by itself, summarises the project in the least possible words (usually 100 – 200). It should include the aim, principles/techniques employed and a very brief statement of your results and conclusions. The criteria used will be: The abstract is a clear, concise, accurate representation of the project, linking the main ideas together well without added interpretation or criticism, misunderstandings or unnecessary details.
1.Begin with a topic sentence that is the major thesis (the Aim).
2.Purpose: state the research question and hypotheses
2.Method: the design
3.Results: concisely
4.Conclusions: implications of results. Can be recommendations, evaluations, applications, suggestions, new relationships, and hypotheses accepted or rejected.
5.Other information incidental findings to the main purpose of the document but must not distract attention from main theme.
[AR2]Clearly presented.
Well chosen subjects.
Need more variety of communication methods. Eg tables, graphs, images, diagrams, to support explanation.
[AR3]You should discuss the formulae that links the variables for length and cross-sectional area here so your preliminary calculations make better sense.
[AR4]How do you calculate area?
[AR5]Good analogies. Again, use diagrams to support this.
[AR6]= and?
[AR7]Make sure you explain what’s happening, why this data was chosen, etc.
[AR8]Your table isn’t clearly labelled. If this is the resistivity of the wire, state as much in the table. Why did you label it as the resistance coefficient?
[AR9]This is just the same table.
[AR10]Describe the relationship here. Logarithmic? Linear?
[AR11]This part just refers to length, not resistance.
[AR12]Probably worth a C for your hypothsis. You can increase that by addressing the above points.
[AR13]These elements of your method are good, but it’s incomplete. You never said where you varied the length of the wire, for instance.
[AR14]Ensure you have someone proof read your draft before you submit it to pick up grammatical errors and run-on sentences.
[AR15]Good use of diagram.
[AR16]Good explanation of equipment used.
[AR17]Safety issues in detail. Good
[AR18]You’ll need to graph your results and put it beside your theoretical data for comparison in order to achieve the highest grade here.
[AR19]Extensive results. Good.
[AR20]This table is missing average current
[AR21]You’re just stating the results of the experiment. You should be exploring patterns and trends as well as anomalies. Ie “as the diameter increased…” or “as the length increased…” Without this, you may not pass this section.
[AR22]Didn’t you control them?
[AR23]Include units for resistance here. Cut and paste this one: Ω
[AR24]Where’s your conclusion?
[AR25]This is decent. Probably a C. Remember to suggest what can be explored from here eg. A modified hypothesis.
[AR26]Did you not do this?
[AR27]Good.
[AR28]Put this near the relevant section
[AR29].”Bibliography.” Your list and formatting is sufficient for a B.
Summary:
Ryan, you can improve your grade with the following:
- Remove plagiarism. Rewrite in your own words.
- Include more diagrams in the introduction.
- Explain what youre doing more thoroughly in the preliminary calculations.
- Reword your hypothesis more accurately.
- Finish your method.
- Add graphs to your results section.
- Analyse and discuss trends in your discussion/conclusion.
- Include a conclusion that links to the hypothesis.
- Plus anything else I’ve missed up there.
Without knowing how much you’ve cut and pasted from other sources it’s impossible to tell a grade, but I’m estimating between a C and a D. It’s possible to improve what you have here up to about a B.
Godspeed.
Cite This Work
To export a reference to this article please select a referencing stye below:
Related Services
View all


DMCA / Removal Request
If you are the original writer of this essay and no longer wish to have your work published on UKEssays.com then please click the following link to email our support team:
Request essay removal