Coincidence Counting With NAI Scintillation Detectors
| ✅ Paper Type: Free Essay | ✅ Subject: Physics |
| ✅ Wordcount: 2718 words | ✅ Published: 30 Jan 2018 |
ABSTRACT
Coincidence counting is a technique employed in nuclear medicine for PET imaging. This technique utilizes a positron emitting radionuclide that is injected into patients to track biochemical and physiological processes. The positron annihilates with an electron and emit two 0.511MeV gamma rays which are detected simultaneously by two scintillation detectors. In the experiment, two gamma ray sources, 60Co and 22Na were used with a NaI scintillation counter. A single channel analyzer (SCA) was used to count the number of voltage pulses whose height fell within the gate width. The absolute efficiency and intrinsic efficiency was obtained as a function of distance. Real and random coincidences were determined from the spectrum obtained with varying gate width and gate delay for each source. The optimum gate width obtained was 5µsec for both sources with gate delays of 1.2µsec and 0.2µsec for 22Na and 60Co respectively. The real coincidences for 22Na and 60Co were found to be 200.1 ± 2.3 and 76.5 ± 1.7 respectively. The random coincidences obtained were 25.1 ± 3.4 and 13.4 ± 2.6 for 22Na and 60Co respectively. This was determined by using the LINEST function. The percentage thus of random to real coincidences obtained in this experiment was 12.54 ± 1.85 % and 17.52 ± 3.81 % for 22Na and 60Co respectively. It was deduced that the uncertainty in determining a random coincidence was higher in 60Co than in 22Na. the magnitude of the uncertainty is as a result of fluctuations in the instrumentation. Hence the Na system is more efficient for coincidence counting and so it is useful in the PET system.
INTRODUCTION
Coincident counting is a radiological measuring technique that is utilised in the nuclear medicine in the PET scan whereby two photons emitted from an event are detected simultaneously by a ring of detectors. Sodium Fluoride (F18-NaF) is the positron-emitting radionuclide employed in PET for bone imaging [1]. Upon decay, the positron are emitted which travels for a short distance and under Compton’s scattering thereby loosing most of its energy. It then undergoes annihilation with an electron and emit two high energy 0.511MeV photons. The 0.511MeV photons are emitted 180 degrees apart and interact with the PET detector rings at opposite sites. [2] The detectors are made up of scintillation crystals coupled with photomultiplier tubes powered by a high voltage which produces a pulse with a height proportional to the gamma-ray energy. A SCA counts the number of voltage pulses whose height falls within a predetermined window of photon energies.
Coincidence measurement is utilised when a single detector cannot produce all the information expected, as gamma rays are randomly produced, hence the need to set several detectors. Real coincidences occur when two photons are emitted in coincidence from the same annihilation event and are detected simultaneously within a certain time frame set by the gate width. Random coincidences occur when two photons emitted from different events are detected simultaneously within the time frame of the gate width. [3] The gate width determines the time window within which the simultaneous emission of the gammas are detected. The optimum gate width therefore will ensure that the maximum number of real coincidences are detected to minimise the events of random coincidences. In the ideal situation when the gate width is zero the real coincidences can be observed, and with an increase in gate width the random coincidences can be observed.
In the PET scan, this will ensure efficiency of the coincidence system. The need for the gate delay is to enable the second pulse to be detected within the time frame of the gate width and this is usually a minute time frame. It takes into account the minute fluctuations that occur at time of pulses. By alternating the gate delay and gate width, the rate of coincidence can be determined.
In this experiment the two sources used were 60Co and 22Na. 60Co emit two gamma rays upon beta decay at energies 1.3325Mev and 1.1732MeV with 60Ni daughter nuclide. The 22Na undergoes a beta decay and electron capture decay with the emission of a 1.275MeV gamma photons and two 0.511Mev upon interactions with the detector material. The positron from the beta decay of 22Na annihilates an electron of the detector and emit the two gammas at 0.511Mev energies at 1800. The coincidence counting system records just a certain portion of events depending on the solid angle as a function of distance. Coincidence counting as a function of distance is maximum in the middle and zero at the edge [4].
The photons can undergo several interactions in the detector before they are detected and that render the detector inefficient and so there is the need for its efficiency to be determined. The efficiency can be classed into two as absolute and intrinsic efficiencies and they are defined as
Absolute efficiency εabs = Number of pulses recorded [3]
Number of radiation quanta emitted by source
Intrinsic efficiency εint = Number of pulses recorded [3]
Number of radiation quanta incident on detector
These efficiencies are related by
εint = εabs * (4/Ω) [3]
where Ω is the solid angle of the between source and detector. The solid angle is dependent on the distance between source and detector (d) and the radius of the detector (r) and it is determined by the this equation,

 Ω = 2 1 – d [3]
√d2 + r2
To determine the efficiency of the coincidence system, the absolute efficiency for real and random coincidences were also determined for both sources based on the equations below.
- εabs for real coincidences for 22Na = εabs * εint
- εabs for random coincidences for 22Na = (εabs)2 * Activity * Intensity * Time
- εabs for real coincidences for 60Co = εabs * εabs
- εabs for random coincidences for 60Co = (εabs)2 * Activity * Intensity * Time
METHOD
Two NaI detectors coupled with photomultipliers with high voltages and preamplifiers were used for this experiment. The inputs were connected to spectroscopic and SCA amplifiers. Detector 1 was first corrected for background by counting for 5 minutes. The 22Na gamma ray source was varied with distance and the absolute efficiency of the detector was determined as a result. Detector 2 was introduced and set at a distance of 10cm apart from Detector 1. 22Na was positioned in the middle and the counting was set to 5 minutes. The gate width and gate delay were varied and their spectrum observed. The experiment was repeated for the second gamma ray source, 60Co.
The optimum gate delay was determined and varied with the gate width to obtain the optimum gate width. A linear graph of count rate against gate width was obtained that showed the real and random coincidences based on the slope gradient obtained. The percentage ratio of the random to real coincidences were determined and the uncertainty associated with the experiment was also determined.
RESULTS/DISCUSSION
- The background spectrum was corrected in the count reading for both sources. The background radiation is as a result of scattered radiation associated with the experiment.
- The absolute efficiency of the detector was determined for both sources as shown in Figure 1 and Figure 2 and Table 1a & 1b and Table 2a & 2b for 22Na and 60Co respectively. The absolute efficiency was obtained using the formula
Absolute efficiency = Sum of count
Intensity x Activity
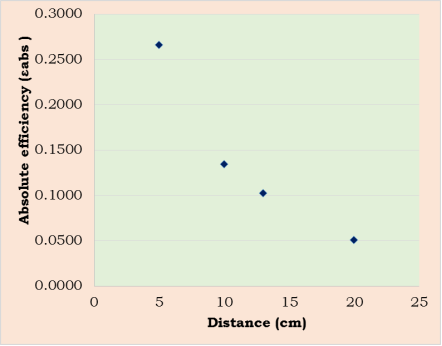
Figure 1: Absolute efficiency as a function of the distance between the 22Na source and detector
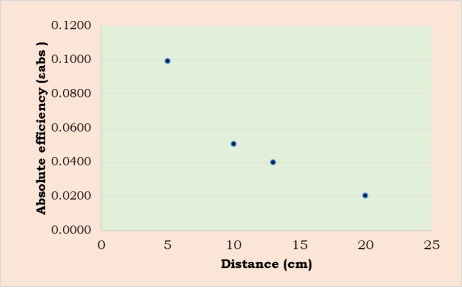
Figure 2: Absolute efficiency as a function of distance between the 60Co source and detector
The 22Na revealed a gradual decrease in efficiency with increasing distance, whereas 60Co revealed a rapid drop in efficiency as a function of distance. 60Co revealed lower absolute efficiencies since the measure of the number of pulses obtained by the 60Co was less than the number of photons emitted by the gamma ray source. This could have been due to Compton scattering reducing the number of photons actually detected as a pulse. The 22Na however revealed quite high absolute efficiencies and so can be confirmed that the detector was efficient in detecting the 22Na than the 60Co.
- The intrinsic efficiency was determined using the equation below.
εint = εabs * (4/Ω)
The solid angle was determined for the detector when the distance between both detectors was varied between 5cm to 20cm and the radius of the detector was measured as 10cm.
This is shown in Tables 3 and 4 and Figures 3 and 4 for 22Na and 60Co respectively.
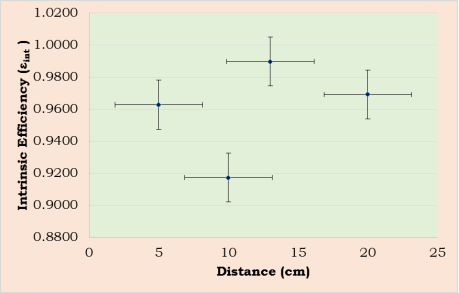
Figure 3: Intrinsic efficiency as a function of distance between the 22Na source and detector
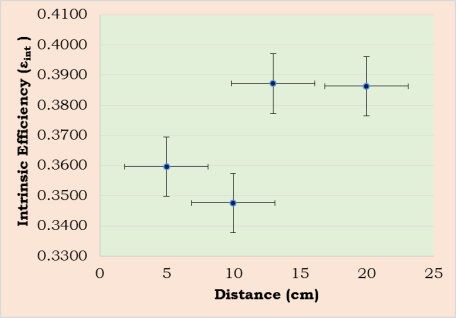
Figure 4: Intrinsic efficiency as a function of distance between the 60Co source and detector
The intrinsic efficiency for 60Co was lower than 22Na. It can be deduced that the number of 60Co photons incident on the detector was more than the number of pulses recorded. Hence signifying that the detector was not efficient in detecting the 60Co. The 22Na however displayed high intrinsic efficiency almost approximating the maximum value for intrinsic efficiency. The intrinsic efficiency were found to be fluctuating with the highest being 0.9898 and 0.3872 with a solid angle of 1.3029 at 13cm distance from detector for 22Na and 60Co respectively. This is as result of the detector’s geometry detecting the photons at different solid angles. The solid angle determines how much of the photons can be detected as a function of distance. The overlap of the error bars signifies the uniformity of the errors.
- The probability of a 0.511MeV gamma travelling in the direction of the detector and being absorbed by it, will imply that the second 0.511MeV will also travel in the correct direction. Both detectors detecting the two 0.511MeV gammas can be determined to yield the absolute efficiency for real coincidences. This can be deduced from the notion that photons travelling in the right direction will be absorbed in the right direction by both detectors. The results of absolute efficiencies for real and random coincidences for 22Na and 60Co is shown in Table 5 & 6 and Figure 5, 6, 7 & 8. The efficiencies for both sources decreased with distance and it was lower for 60Co. The absolute efficiency for random coincidences was however for both sources than the absolute efficiency for real coincidences. It can thus be inferred that the absolute efficiencies for real coincidences for both 22Na and 60Co yields less probability of detection of real coincidence with 60Co as compared to the 22Na. The absolute efficiencies for random coincidences was however comparable for both sources as the probability of detecting the second event within the gate width is possible for both sources.
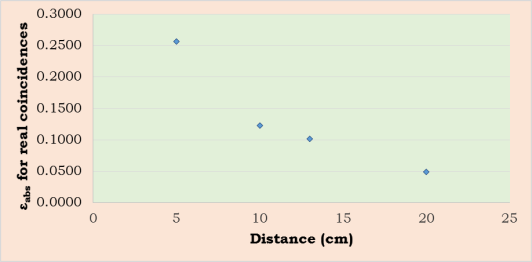
Figure 5: Absolute efficiency for real coincidences as a function of distance for 22Na
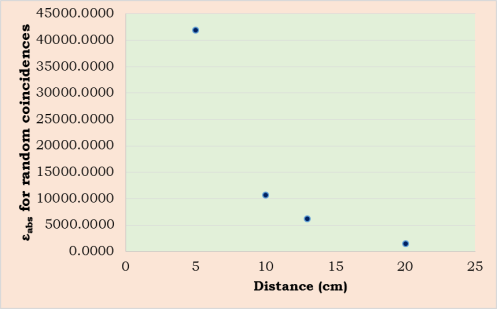
Figure 6: Absolute efficiency for random coincidences as a function of distance for 22Na
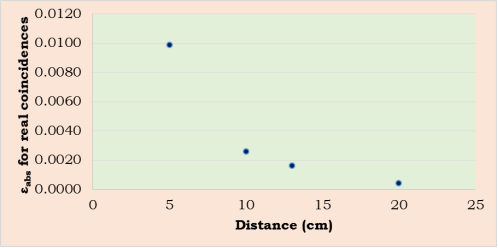
Figure 7: Absolute efficiency for real coincidences as a function of distance for 60Co
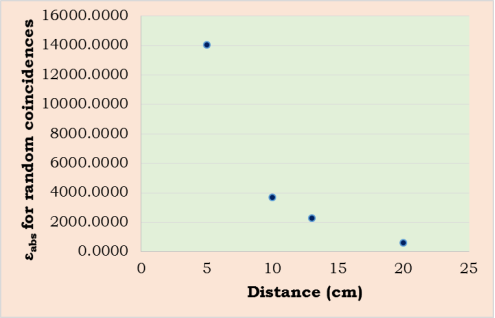
Figure 8: Absolute efficiency for random coincidences as a function of distance for 60Co
- The gate delay was varied with gate width to obtain the optimum values of delay and width. The optimum gate delay was obtained as 1.2µsec and 0.2µsec for both 22Na and 60Co respectively and was used for the experiment. A linear graph of count rate as a function of gate width was obtained and a fixed gate width was obtained as shown in Figure 5 and 6 and table 7 and 8
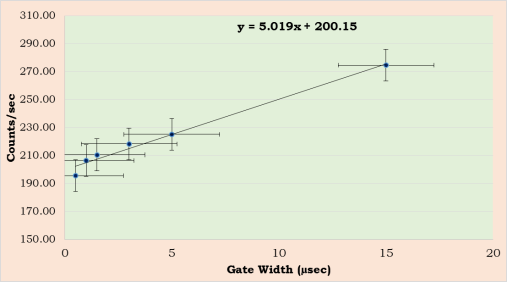
Figure 5: A linear graph of count rate as a function of gate width applying a 1.2µsec gate delay for 22Na
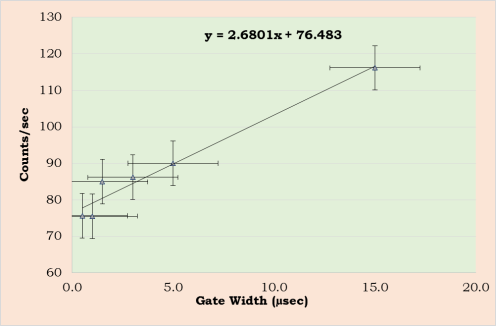
Figure 6: A linear graph of count rate as a function of gate width by applying a 0.2µsec gate delay for 60Co
Real coincidences occur on the intercept of the linear slope gradient, whereas random coincidences can be found with the slope.
- For 22Na the optimum gate width obtained was 5µsec. The graph of count rate as a function of gate width yielded a slope gradient of y = 5.019x + 200.15. By applying the optimum gate width and correcting for the gate delay, the real and random coincidences were determined using the LINEST function. The real coincidences was found to be 200 ± 2.3 whereas the random coincidences was found to be 25.1 ± 3.4. The percentage thus of random to real coincidences obtained in this experiment was 12.54 ± 1.85 %. This gives the value of pure coincidences that are not dependent on gate width.
- For 60Co, the optimum gate width was 5µsec. The graph of count rate as a function of gate width yielded a slope gradient of y = 2.6801x + 76.483. When the optimum gate width was applied whilst correcting for the minute gate delay, the real and random coincidences were determined using the LINEST function. The real coincidences was found to be 76.5 ± 1.7 whereas the random coincidences was found to be 13.4 ± 2.6. The percentage of random to real coincidences obtained in this experiment was 17.52 ± 3.81 %.
- The above results was compared with the measured values obtained from the graph. The intercept gave the real coincidences as 200.15 and 76.48 for 22Na and 60Co respectively. The point of data convergence on the straight line gave the optimum gate width and the count equivalent was found as 225.28 and 90.02 for 22Na and 60Co respectively. The difference between this value and the real coincidences yielded the random coincidences as 25.13 and 13.56 in 22Na and 60Co respectively. Hence the percentage ratio of the random and real coincidences was obtained as 12.49% and 17.73%. This is equivalent to the values obtained from the calculated coincidences with the differences being due to uncertainties.
- The uncertainties with this experiment were with the NaI detector which contributed to scatter around the cover. The count rates resulted in some uncertainties as well and has been sown in table 8 for both detectors. The solid angle presented an uncertainty as the measurements for the detector could incur a large margin of errors.
From all the results synthesized for both sources it could be gathered that the 22Na was an efficient source for coincidence counting compared to the 60Co. This is as a result of the geometry of the detectors as the Co system does not show a coincidence system and so there is more likelihood of a random coincidence than a real coincidence as compared to the Na system. This concludes that the 22Na will be efficient in a PET system, hence the reason for positron emitting radioisotopes being used in the PET system to ensure the maximum number of coincidences are being detected
CONCLUSION
The experiment was performed to examine the coincidence counting in two gamma ray sources and to determine the real and random coincidences as a function of gate width.
The optimum gate width obtained was 5µsec for both sources with gate delays of 1.2µsec and 0.2µsec for 22Na and 60Co respectively. The real coincidences for 22Na and 60Co were found to be 200.1 ± 2.3 and 76.5 ± 1.7 respectively. The random coincidences obtained were 25.1 ± 3.4 and 13.4 ± 2.6 for 22Na and 60Co respectively. This was determined by using the LINEST function. The measured count rates was also determined from the graph and resulted in real coincidences for 22Na and 60Co respectively as 200.15 and
76. 48 and random coincidences of 25.13 and 13.56. The percentage thus of random to real coincidences obtained in this experiment was 12.54 ± 1.85 % and 17.52 ± 3.81 % for 22Na and 60Co respectively. This gave the quality of the uncertainty in the coincidence system. It was deduced that the uncertainties in determining a random was higher in 60Co than in 22Na hence the Na system is more efficient for coincidence counting and very useful in the PET system.
REFERENCES
[1] The detection of bone metastases in patients with high-risk prostate cancer:99mTc-MDP planar bone scintigraphy, single- and multi-field-of-view SPECT,18F-fluoride PET, and18F-fluoride PET/CT.Even-Sapir et al, J Nucl Med(2006)47:287–97
[2] The Physics of Medical Imaging, ed. S. Webb. IoP publishing
[3] Radiation and Detection Measurement, Glen N Knoll, 3rd Edition
[4] Coincidence Counting, E. K. A. Advanced Physics Laboratory, Physics 3081, 4051
APPENDIXES
|
Distance(cm) |
Number of Counts |
Time(sec) |
Counts/sec |
Activity(Bq) |
Intensity |
|
5 |
157311 |
293.57 |
535.8552 |
5915.2777 |
99.944 |
|
10 |
79423 |
294.755 |
269.4543 |
5915.2777 |
99.944 |
|
13 |
60672 |
295.874 |
205.0603 |
5915.2777 |
99.944 |
|
20 |
30247 |
296.33 |
102.0720 |
5915.2777 |
99.944 |
Table 1a: Counts rate as a function of distance between source and detector for 22Na
|
Distance(cm) |
Absolute efficiency (εabs) |
Standard deviation of count rates |
Uncertainty of the Standard deviation |
|
5 |
0.2661 |
396.6245076 |
±1.351 |
|
10 |
0.1343 |
281.8208651 |
±0.956 |
|
13 |
0.1026 |
246.3168691 |
±0.833 |
|
20 |
0.0512 |
173.9166467 |
±0.587 |
Table 1b: Absolute efficiency as a function of distance between source and detector for 22Na
|
Distance(cm) |
Number of Counts |
Time(sec) |
Counts/sec |
Activity(Bq) |
Intensity |
|
5 |
141485 |
288.638 |
490.1815 |
14234.898 |
99.99 |
|
10 |
72463 |
288.179 |
251.4514 |
14234.898 |
99.99 |
|
13 |
57144 |
290.331 |
196.8236 |
14234.898 |
99.99 |
|
20 |
29024 |
291.047 |
99.7227 |
14234.898 |
99.99 |
Table 2a: Counts rate as a function of distance between source and detector for 60Co
|
Distance (cm) |
εabs |
Standard deviation of count rates |
Uncertainty of the Standard deviation |
|
5 |
0.0994 |
376.1449 |
±1.30 |
|
10 |
0.0509 |
269.1895 |
±0.93 |
|
13 |
0.0401 |
239.0481 |
±0.82 |
|
20 |
0.0204 |
170.3643 |
±0.59 |
Table 2b: Absolute efficiency as a function of distance between source and detector for 60Co
|
Distance(cm) |
εabs |
Ω |
4 |
εint |
|
5 |
0.266 |
3.473 |
12.5664 |
0.9628 |
|
10 |
0.134 |
1.8403 |
12.5664 |
0.9174 |
|
13 |
0.103 |
1.3029 |
12.5664 |
0.9898 |
|
20 |
0.051 |
0.6633 |
12.5664 |
0.9693 |
Table 3: Intrinsic efficiency as a function of distance between source and detector of 22Na
|
Distance(cm) |
εabs |
Ω |
4 |
εint |
|
5 |
0.09940 |
3.473 |
12.57 |
0.35967 |
|
10 |
0.05091 |
1.8403 |
12.57 |
0.347637 |
|
13 |
0.04015 |
1.3029 |
12.57 |
0.387221 |
|
20 |
0.02039 |
0.6633 |
12.57 |
0.386319 |
Table 4: Intrinsic efficiency as a function of distance between source and detector for 60Co
|
Distance(cm) |
εabs |
Ω |
4 |
εint |
εabs for real coincidences |
εabs for random coincidences |
|
5 |
0.2661 |
3.473 |
12.5664 |
0.9628 |
0.2562 |
142.5853 |
|
10 |
0.1343 |
1.8403 |
12.5664 |
0.9174 |
0.1232 |
36.1992 |
|
13 |
0.1026 |
1.3029 |
12.5664 |
0.9898 |
0.1016 |
21.0445 |
|
20 |
0.0512 |
0.6633 |
12.5664 |
0.9693 |
0.0496 |
5.2222 |
Table 5: εabs for real and random coincidences as a function of distance for 22Na
|
Distance(cm) |
εabs |
Ω |
4 |
εint |
εabs for real coincidences |
εabs for random coincidences |
|
5 |
0.09940 |
3.473 |
12.57 |
0.35967 |
0.0994 |
48.7255 |
|
10 |
0.05091 |
1.8403 |
12.57 |
0.347637 |
0.0509 |
12.8015 |
|
13 |
0.04015 |
1.3029 |
Cite This Work
To export a reference to this article please select a referencing stye below:
Related Services
View all


DMCA / Removal Request
If you are the original writer of this essay and no longer wish to have your work published on UKEssays.com then please click the following link to email our support team:
Request essay removal