Development of Vision over the First 12 Months of Life
| ✅ Paper Type: Free Essay | ✅ Subject: Medical |
| ✅ Wordcount: 3071 words | ✅ Published: 23 Sep 2019 |
Describe and discuss the development of vision over the first 12 months of life.
Contents
2) The changes in vision from birth to twelve months
2.c.i) Directional sensitivity
3) Ruling out factors that have a minimal effect on visual acuity
4) Factors that influence visual acuity
4.a) The development of the fovea
1) Introduction
The first half of the essay will discuss changes in infant vision such as visual acuity, contrast sensitivity and motion perception. Visual acuity is defined as the clarity of vision and is dependent on optical and neural factors. Examples of these factors are the ability of the retina to focus and form a sharp image. The health and performance of the retina. And, how the brain interprets the visual signals to an image. The contrast sensitivity function (CSF), demonstrates the visual framework’s sensitivity to sinusoidal gratings of different spatial frequencies in adults and infants (Kellman and Arterberry, 2006a). The manner in which it is resolved is by finding the most reduced contrast expected to see light/dull grinding of shifted fineness or spatial frequency. Motion perception will be broken down to directional sensitivity, velocity sensitivity and perception of motion. The second portion of the essay will evaluate the reasons to the changes in infant vision and the amount of influence these changes have on acuity and perception in a healthy infant. It essential for researchers to carry out investigations on infant vision as there has to be a basic idea on what is ‘normal’. This allows a comparison to be made when they eventually get their eyes checked for any vision problems.
2) The changes in vision from birth to twelve months
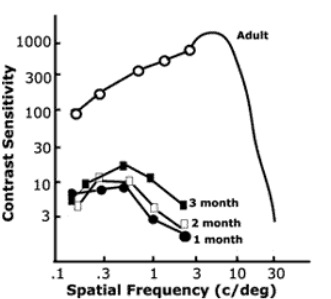
The visual acuity of an adult is typically measured by a chart such as Snellen or Landolt C. However, infant’s acuity is measured by the finest stripes that they can see and is known as their threshold stimulus. There are different methods that can determine the threshold stimulus. One of the methods called forced preferential looking was carried out by (Banks and Salaphatek, 1978a). Their findings in figure 1 show estimated values of 2.4 cy/deg for 1-month-olds, 2.8 cyl/deg for 2-month-olds, and 4.0 cy/deg for 3-month-olds. These results are further supported by Bowman et al (2009a) through a different method called the Teller Acuity Card procedure and is shown in figure 2.
It can be interpreted from the data below that infants start with low acuity which gradually increases relative to their age. Poor acuity in infants means they can only see nearby large objects such as their mother’s hair or face but with the lack of detail. Having a closer look at the table it displays at 6 months of age, acuity has enhanced from being around 40 times to 8 times worse when compared to adults. During this period, infants become more sensitive to detail like internal features of the face which leads to the ability to recognise a familiar face (Maurer and Salapatek, 1976). Furthermore, Vecera and Johnson (1995) proposed that infants are able to see small differences such as the direction of eye gaze. These small differences that infants are able to see at 6 months of age is an indicator of how rapid their vision has changed from birth to now. Hence, Courage and Adams (1990) proposed that over time their vision improves substantially and reaches adult values at approximately 4-6 years of age depending on what type of method has been carried out.

Figure 1. Depicts the values of the average contrast sensitivity function from 1-3 months of age (Banks and Salaphatek, 2006b).

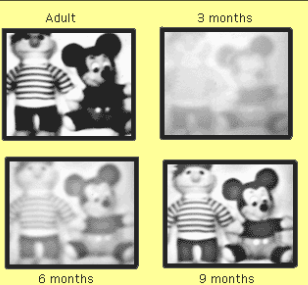
The adult CSF has a peak sensitivity of 3 to 5 cycles/degree. At dynamically higher or lower spatial frequencies such as 50 or 0.5 cycles/degree the sensitivity falls dramatically. This is considered as the cut off, which is the finest grating an adult can detect when the contrast between the stripes is 100%. In figures 3 and 4 shown below it can be observed that the contrast sensitivity in infants follows similar patterns to adults. They both have a specific value of spatial frequency that will cause the sensitivity to peak and vice versa. Although, in infants their sensitivity is generously lower approximately 9 for 1-month-olds, 12.5 for 2-month-olds, and 15 for 3-month-olds while the peak contrast sensitivity for adults is 500. In addition, figure 4 not only demonstrates that the peak in adults is high by its values, but through the fact that the peak is shifted to the left. In contrast, there are differences between adults and infants which is that the shape of the graph in infants is a “low pass” rather than a “band pass” function. Further investigation by Peeples and Teller (1975) highlights by measuring the increment threshold of young infants they were able to detect vertical stripes that differed by only 10% in intensity from the stripes and background. By using the reciprocal of the contrast threshold, a contrast sensitivity was worked out to be 19. In figure 5 below it depicts how infants might see contrast information and interestingly by 9 months they are able to see fine detail in low contrast (University of Calgary, 2019a). Finally, it is important to note that spending on the method that has been conducted. It can cause values to vary as measurements with the visual evoked potential have higher sensitivity estimates than behavioural techniques and is particularly represented in figure 4.
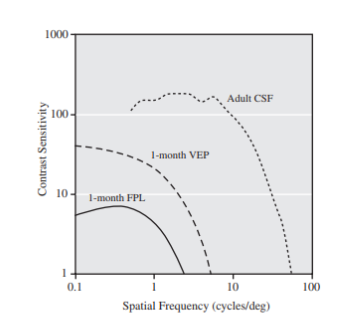
Figure 3. Represents the adult CSF measured using a psychophysical strategy, alongside infant CSFs measured using forced preferential looking and visual evoked potential at 1 month (Kellman and Arterberry, 2006b)
Motion perception is an important process as it gives information such as speed and direction of an object which forms our perception of events and spatial layout (J. Gibson, 1966, 1979; Johansson, 1970).
2.c.i) Directional sensitivity
Directional sensitivity is the ability to observe motion direction and is considered one of the most important perceptual capacities. Behavioural and visual evoked potential (VEP) led by Wattam-Bell (1991, 1992) are used to measure directional sensitivity in longitudinal studies. The VEP studies were carried out by measuring the electrical response of movement in a checkerboard. It was found at an average of 74 days they could recognise 5 degrees/second patterns and 90 days for 20 degree/second patterns. In the behavioural studies Wattam-Bell, (1992) used an alternative type of method which appeared to be a vertical strip of dots that are moving coherently. The vertical movement was appeared against a background having opposite direction motion. In the event that a new-born child recognised the vertical target strip it was expected they took a longer look at the display. The displacement of the vertical moving dots was altered to achieve a maximum displacement (dmax) that supported motion detection. The younger infants (8 to 11 weeks) could tolerate only about 0.25 degree of visual angular displacement, whereas 14 to 15-week-olds showed a dmax of about 0.65 (Kellman and Arterberry, 2006a).
It is the ability to perceive motion over a great range of velocities. In adults, the minimum velocity to detect motion is up to 1 to 2 minutes of visual angle while the maximum is up to 15 to 30 degrees/second, at which the motion is too fast and causes blurring (Kaufman, 1974). In infants the slowest speed to which they react is varied. Volkmann and Dobson (1976) utilised the checkerboard method and found a moving object was more preferred in 2-and 3-month-olds for a speed as moderate as 2 degrees/second compared to a stationary one. Whilst, one-month, year olds showed a weaker preference to 2 degrees/second. However, other studies by Kaufmann, Stucki, and Kaufmann-Hayoz (1985) used rotary motion displays which assessed limits at about 1.4 degrees/second at 1 month and 0.93 degrees/second at 3 months. Similar results were obtained using the preferential technique. Dannemiller and Freedland (1989) evaluated limits at around 5 degrees/second for 16-week-olds and about 2.3 degrees/second for 20-week-olds. For vertically moving gratings, Aslin and Shea (1990) discovered velocity thresholds of around 9 degrees/second at about a month and a half, dropping to 4 degrees/second at 12 weeks (Kellman and Arterberry, 2006a). The variation in measurements could have been due to the methods carried as they might have not been accurate enough to measure velocity sensitivity accurately enough or that infants might have not cooperated properly. Regardless, it could be noted that the velocity sensitivity is lower in infants.
Stability and motion of moving objects are believed to be strongly tied to non-moving objects and surfaces as stationary. The perception of an environment as stationary during observer motion, such as eye, head, or body movements is called position constancy. To form a perception of a steady world, there has to be more than just the brain interpreting the image on the back of the retina but contributions from the vestibular system and optic flow. There is some indication from (Kellman, Gleitman, and Spelke, 1987) that suggests that moving infants are able to differentiate moving from stationary conditions. More direct investigations of position consistency and movement observation have been completed by (Kellman and von Hofsten, 1992). In these investigations, new-borns were moved horizontally while seeing a variety of objects. On every preliminary, one item in the field of view, either on the left or right, moved while others stayed stationary. The object movement was parallel to the onlooker’s movement. Both 8-and 16-week-olds had a directed attention when the object and observer moved opposite in phase. However, it was noted that just the 16-week-olds seemed to distinguish the movement when item and themselves moved in phase (Kellman and von Hofsten, 1992). Further investigation showed that motion detection was eliminated in monocular viewing. It creates the impression that some capacity to recognise moving and stationary items amid onlooker movement develops as early as 8 weeks of age and that binocular convergence may provide essential information to take this task (Kellman and von Hofsten, 1992).
3) Ruling out factors that have a minimal effect on visual acuity
To determine possible reasons to poor acuity in infants there are factors to be considered. For example, ocular media would not have an impact. This is because the ocular media has two aspects that are known to change with age. These are the optical density of the crystalline lens and the macular pigment. Thus, the transmittance is slightly higher in new-borns compared to adults, especially at short wavelengths (Bone et al 1988; Werner, 1982). This becomes an advantage to infant’s acuity to a certain extent. Other minuscule impediments are the pupil size and the amount of spherical and chromatic aberrations. Finally, infants tend to inaccurately accommodate until 12 weeks of age, but it is believed that it does not impose on visual acuity.
4) Factors that influence visual acuity
4.a) The development of the fovea
The fovea is located in the macula of the retina and is known as the part of the retina that contains no rods. Due to the fovea only consisting of cones it provides the clearest vision to the eye. The formation of the fovea in neonates begins with having a larger diameter of 5.4 degrees compared to adults and then as it matures it decreases to 2.4 degrees (Kellman and Arterberry, 2006a). Another significant change that occurs in the development of the fovea is that at birth it has three layers of neurons. These layers are the photoreceptors, neurons and retinal ganglion cells, which later the layers develop and form one layer which only consists of photoreceptors.
Moreover, the shape of the cones from birth to adult changes and are known as immaturities in the retina. Generally, in adults the cones are densely packed and well aligned. They have slender outer and inner segments that guide light to the fovea. In new-borns their cones are the opposite short, stumpy, and sparsely packed. Furthermore, their outer segments have small diameters that misalign with their wide inner segments. The adult foveal cone lattice is better at capturing photons of light and converting them into signals. However, in new-borns’ their cones are 350 times less efficient at capturing light than at those in the adult fovea (Maurer and Lewis, 2001). These retinal immaturities are considered to have a significant impact on acuity and is considered as a major limitation to acuity in infants.
Jacobs & Blakemore (1998) explored how visual signals at birth can be lost as the retina is not fully developed which can cause poor acuity.
5) Conclusion
Overall, there is an appropriate amount of research that evaluates the changes in infant vision and their development. A strong and clear relationship shown in all research is that infant vision increases relative to their age and after a specific time it plateaus to adult vision. However, there are some indicators that more research has to be done to give a more credible numeral to what is being measured. Particularly, in directional sensitivity as the values kept fluctuating due to many factors such as the method or infant cooperation. Furthermore, in all observations it emphasises that at birth acuity is poor. Thus, the factors that influence vision have been explored and it could be said that retinal immaturities play a major role in the reason of infant vision being so poor at birth.
6) References
- Aslin, R. N. and Shea, S. L. (1990). Velocity thresholds in human infants: Implications for the perception of motion. Developmental Psychology, 26(4), pp. 589–598.
- Banks, M. and Salphatek, P. (1978a). Acuity and contrast sensitivity in 1-, 2-, and 3-month-old human infants. [online] Iovs.arvojournals.org. Available at: ://iovs.arvojournals.org/pdfaccess.ashx?url=/data/journals/iovs/933079/361.pdf [Accessed 10 Jan. 2019].
- Banks, M. and Salphatek, P. (1978b). Average CSF’s for 1-, 2-, and 3-month-old infants. Contrast sensitivity (the reciprocal of contrast threshold) is plotted as a function of spatial frequency. The logarithm of contrast sensitivity is also shown [Figure 1]. Available at: ://iovs.arvojournals.org/pdfaccess.ashx?url=/data/journals/iovs/933079/361.pdf [Accessed 10 Jan. 2019].
- Banks, M. and Bennett, P. (1988). Optical and photoreceptor immaturities limit the spatial and chromatic vision of human neonates. Journal of the Optical Society of America A, 5(12), pp.2059.
- Bone, R. A., Landrum, J. T., Fernandez, L., & Martinez, S. L. (1988). Analysis of macular pigment by HPLC: Retinal distribution and age study. Investigative Ophthalmology and Visual Science, 29, 843–849.
- Bowman, R., McCulloch, D., Law, E., Mostyn, K. and Dutton, G. (2009a). The ‘mirror test’ for estimating visual acuity in infants. British Journal of Ophthalmology, 94(7), pp.882-885. [online] Available at: https://bjo.bmj.com/content/bjophthalmol/94/7/882.full.pdf [Accessed 10 Jan. 2019].
- Bowman, R., McCulloch, D., Law, E., Mostyn, K. and Dutton, G. (2009b). Equivalent grating, Snellen and mirror distance acuities for different ages [Figure 2]. Available at: https://bjo.bmj.com/content/bjophthalmol/94/7/882.full.pdf [Accessed 10 Jan. 2019].
- Courage, M. and Adams, R.J (1990). Visual Acuity Assessment from Birth to Three Years Using the Acuity Card Procedure: Cross-Sectional and Longitudinal Samples. Optometry and Vision Science, 67(9), pp.713-718.
- Dannemiller, J. L. and Freedland, R. L. (1989). The detection of slow stimulus movement in 2- to 5-month-olds. Journal of Experimental Child Psychology, 47(3), pp. 337–355.
- Jacobs, D. S. and Blakemore, C. (1988).Factors limiting the postnatal development of visual acuity in the monkey. Vision Research, 28, pp. 947–958.
- Johansson, G. (1970). On theories for visual space perception: A letter to Gibson. Scandinavian Journal of Psychology, 11(2), pp. 67–74.
- Gibson, J. J. (1966). The senses considered as perceptual systems. Boston, MA: Houghton Mifflin.
- Kaufman, L. (1974). Sight and mind: An introduction to visual perception. Oxford, England: Oxford U. Press.
- Kaufmann, F., Stucki, M., and Kaufmann-Hayoz, R. (1985). Development of infants’ sensitivity for slow and rapid motions. Infant Behaviour and Development, 8(1), pp. 89–98.
- Kellman, P. J. and Short, K. R. (1987). Development of three-dimensional form perception. Journal of Experimental Psychology: Human Perception and Performance, 13(4), pp. 545–557.
- Kellman, P. J. and Hofsten, V. C. (1992). The world of the moving infant: Perception of motion, stability, and space. Advances in Infancy Research, 7, pp. 147–184.
- Kellman, P. J. and Arterberry, M.E. (2006a). Infant Visual Perception. [online] Kellmanlab.psych.ucla.edu. Available at: http://kellmanlab.psych.ucla.edu/files/kellman_arterberry_2006.pdf [Accessed 10 Jan. 2019].
- Kellman, P. J. and Arterberry, M.E. (2006b). Visual acuity estimates at different ages. The highest detectable spatial frequency of a high-contrast grating stimulus is plotted as a function of age. Circles: Visual evoked potential estimates. Squares: Optokinetic nystagmus (OKN) estimates. Triangles: Forced-choice preferential looking estimates. [Figure 3]. Available at: http://kellmanlab.psych.ucla.edu/files/kellman_arterberry_2006.pdf [Accessed 10 Jan. 2019].
- Maurer, D. and Salapatek, P. (1976). Developmental Changes in the Scanning of Faces by Young Infants. Child Development, 47(2), pp. 523.
- Maurer, D. and Lewis, T. (2001). Visual acuity: the role of visual input in inducing postnatal change. Clinical Neuroscience Research, 1(4), pp.239-247. [online] Available at: http://psych.mcmaster.ca/maurerlab/Publications/Maurer_Acuity.pdf [Accessed 10 Jan. 2019].
- Peeles, D. and Teller, D. (1975). Color vision and brightness discrimination in two-month-old human infants. Science, 189(4208), pp. 1102-1103.
- University of Calgary (2019a). Vision Development. [online] Available at: https://psyc.ucalgary.ca/PACE/VA-Lab/Marcela/Pages/page35a.html [Accessed 10 Jan. 2019].
- University of Calgary (2019b). Infant CSFs Compared to an Adult [Figure 4] Available at: https://psyc.ucalgary.ca/PACE/VA-Lab/Marcela/Pages/page35a.html [Accessed 10 Jan. 2019].
- University of Calgary (2019c). Simulation of Infant & Adult Contrast Perception [Figure 5] Available at: https://psyc.ucalgary.ca/PACE/VA-Lab/Marcela/Pages/page35a.html [Accessed 10 Jan. 2019].
- Vecera, S. and Johnson, M. (1995). Gaze detection and the cortical processing of faces: Evidence from infants and adults. Visual Cognition, 2(1), pp.59-87.
- Volkmann, F. C., & Dobson, M. V. (1976). Infant responses of ocular fixation to moving visual stimuli. Journal of Experimental Child Psychology, 22(1), pp. 86–99.
- Wattam-Bell, J. (1991). Development of motion-specific cortical responses in infancy. Vision Research, 31(2), 287–297.
- Wattam-Bell, J. (1992). The development of maximum displacement limits for discrimination of motion direction in infancy. Vision Research, 32(4), pp. 621–630.
- Werner, J. S. (1982). Development of scotopic sensitivity and the absorption spectrum of the human ocular media. Journal of the Optical Society of America, pp. 72, 247–258.
Cite This Work
To export a reference to this article please select a referencing stye below:
Related Services
View all


DMCA / Removal Request
If you are the original writer of this essay and no longer wish to have your work published on UKEssays.com then please click the following link to email our support team:
Request essay removal