Statistics with Aviation Application
| ✅ Paper Type: Free Essay | ✅ Subject: Mathematics |
| ✅ Wordcount: 1354 words | ✅ Published: 18 Sep 2017 |
Christopher Wright
A. Type ofstatistical testyou planto conduct(check one, and giverelevantdetails)
 1-sample t-test
a) Target population:
b) Research variable:
c) Research question:
d) Expected result:
 matched pairs t-test
a) Target population(s):
b) The research variable will be the difference
between and
c) Research question:
d) Expected result:
✓ 2-sample t-test
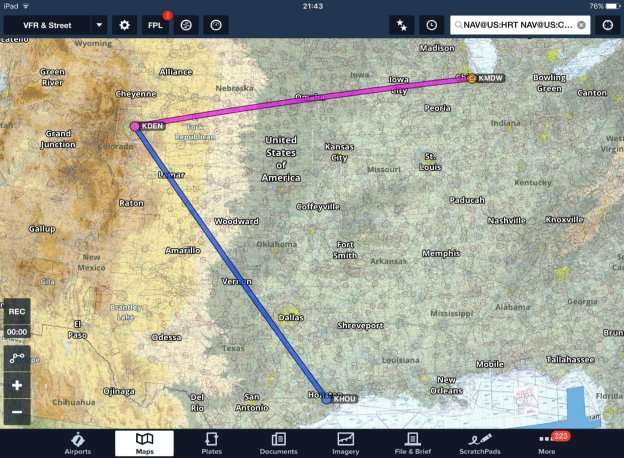
a) Target populations (2): Total travel time between Midway and Denver & Houston and Denver
b) Research variable: Average total travel time
c) Research question: Is the average total travel time flying into Denver from Midway and Houston the same?
d) Expected result: The average total travel time is not the same.
B. Data collection plan(check one,and give relevant details)
✓ I will use data from a file. Give name of file and details below.
I will be using the “Southwest Airline Data” found in StatCrunch to test my hypothesis.
ï‚¨ï€ I will obtain data from a website(s). Give Name of website(s), full URLs and details below.
 Other data collection plan: Give specific details below.
Project plan is: NOT Accepted x AcceptedDate 3/2/17 Instructor Initials SH
Introduction
The intent of this t-Test project is to study and determine the average total travel times between Midway International airport (MDW) and Denver International airport (DEN) & William P. Hobby airport (HOU) and Denver International airport (DEN). Geographically speaking, both routes travel nearly the same distance with the final destination being DEN. This begs the question, is the average total travel time flying into DEN from MDW and HOU the same? To test this question, this paper will review a random sample of travel times between both routes of travel. Common sense tells us that even though the distance traveled to DEN for both routes is nearly the same, there are other variables (ex. ground delays, maintenance and weather) that can affect the total travel time of an aircraft. Therefore, the hypothesis will be that the average total travel time between the two routes will not be the same.
This study will only be discussing all Southwest Airline flights departing from MDW and HOU traveling to DEN. A random sample of 50 routes will be collected and tested. The focus variable will be the average total travel time between the two respective locations and will be collected and calculated in minutes.
It is important to note that the result of this test will only be valid within the test parameters.
(Source: ForeFlight)
Study Design
The study will be conducted as a two-sample t-Test with a 95% confidence interval and a 0.05 level of significance.
Hypotheses:H0: μ1 = μ2 (MDW-DEN and HOU-DEN routes have the same mean travel time)
Ha: μ1 ≠μ2 (MDW-DEN and HOU-DEN routes do not have the same mean travel time)
To test whether the total travel for both routes is the same, we will state that the null hypothesis is that the total travel time for both routes is the same. The alternative hypothesis will propose that the total travel time for both routes is not the same. The formulation of the hypothesis for this study will produce a two-tailed (left and right) result.
Data
The data for this study was collected and is maintained by Embry-Riddle. It is located on the StatCrunch website under the MATH 211/222 data set group. The data that was collected was a sample of overall operations with Southwest Airlines at the Midway (MDW), Houston (HOU), and Dallas Love (DAL) airports. Southwest airlines operates from these airports almost every day and at multiple times during the day. For the sample to be representative of the overall population, it would have to mimic these population parameters. The sample that was collected does just that. It is representative of the overall population of all Southwest Airline operations at MDW, HOU, and DAL because the data includes information from different days and times. This fact also lends itself to the avoidance of bias. The other key with avoiding bias is to be as random as possible while still representing the parameters of the overall population. Furthermore, for the purposes of this assignment we will assume that the appropriate steps were taken by Embry-Riddle to provide its students that avoided bias to the best extent possible.
From the large compilation of data, we will now shift the focus to the specific data to be tested. The data from Figure 1, located in the appendix, is the 50 specific data points that will be tested and includes the total travel times of both routes. To continue with preparation for the t-Test, we will ensure that the samples are independent and that the size is normal. The samples are independent because you can only be on one route of flight at a time, either traveling from MDW or HOU to DEN. Finally, for the purposes of this study will say that 50 data points (meeting the assignment requirement) is large enough, and therefore normal.
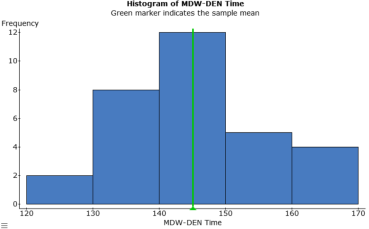
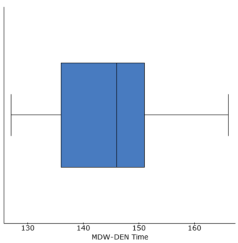

Figure 2
Figure 3Figure 4
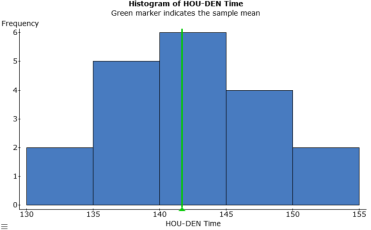
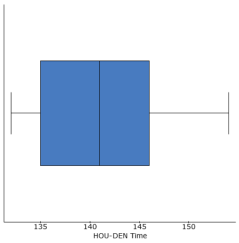

Figure 5
Figure 6Figure 7
 Descriptive Statistics
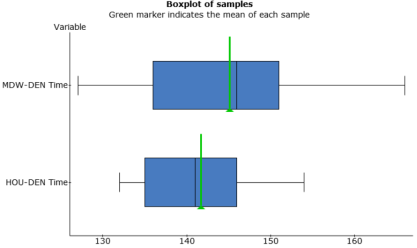
After ensuring that the data meets all conditions required for our particular confidence level of 95%, it is important to describe the data through statistical analysis and graphs (Figures 2 through 8). Figures 4 and 7 show that both sets of data have symmetrical distribution with little skew in either direction. Note thought that figure 4 displays Figure 8 a greater standard deviation. The boxplots (figures 3 and 6) help better describe figures 2 and 5, but are more effectively displayed with a side by side plotting as shown in figure 8. There we see that the medians are within 5 minutes of each other and that the data is not vastly separated. We can see that most of the data points from the HOU-DEN route would fit within the MDW-DEN IQR; and that all of the HOU-DEN sample data would fit within the bounds of the min and max data points for MDW-DEN. This side by side comparison makes a strong argument that even through there are differences between the data of both routes, those differences may not be statically large enough to reject the null hypotheses.
Findings
Original Question: Is the average total travel time flying into DEN from MDW and HOU the same?
Hypotheses:H0: μ1 = μ2 (MDW-DEN and HOU-DEN routes have the same mean travel time)
Ha: μ1 ≠μ2 (MDW-DEN and HOU-DEN routes do not have the same mean travel time)
As we previously discussed, the initial look and plotting of the data showed that even though the routes were different, the data was close enough that it may not be statistically different enough to reject the null hypotheses. When looking at figure 10 and 11 to comparing the p-value (0.1627) to the significance level (0.05), we find that the p-value is larger and therefore we do not reject the null hypothesis. This supports the expected findings and shows that even though the data between the two routes was slightly different, it was still not statistically different enough to reject the null hypothesis.
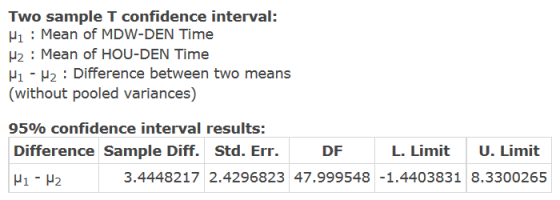
In figure 9, the 95% confidence interval is 4.885 ± 3.445, or about (-1.44, 8.33). This confidence interval includes 0 and therefore both the null and alternate hypothesis are plausible. Only after conducting the hypothesis test were we able to conclude not to reject the null hypothesis.
Confidence Interval and Hypothesis Test Results
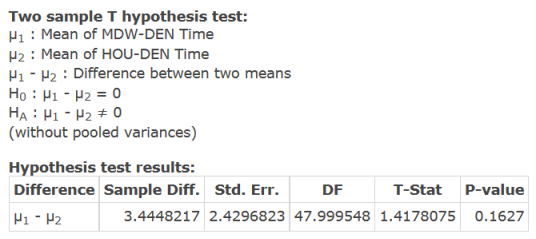
Figure 9
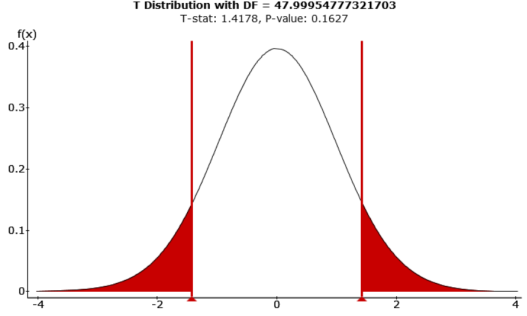
Figure 10
Figure 11
Final Discussion
In conclusion, we see that the average travel times between MDW and DEN & HOU and DEN are very similar. So similar that we were unable to reject the alternative hypothesis that they were not the same. The results we obtained in the test were expected, especially considering that the distance traveled for each route is nearly the same. The biggest take away from this project is how close all of the data was for both routes. This shows just how accurate Southwest Airlines can be when it publishes the average times of travel for these routes, and also how effectively the can plan out their flying schedule. Specifically for the test conducted, we can see just how consistent their average flying time is between destinations separated by the same approximate distance.
Appendix
Total Travel Time Samples
|
MDW-DEN Time |
HOU-DEN Time |
|
151 |
154 |
|
157 |
149 |
|
144 |
140 |
|
146 |
141 |
|
163 |
136 |
|
146 |
135 |
|
148 |
143 |
|
133 |
134 |
|
131 |
135 |
|
136 |
132 |
|
135 |
135 |
|
128 |
142 |
|
127 |
141 |
|
139 |
146 |
|
138 |
138 |
|
131 |
148 |
|
144 |
153 |
|
145 |
144 |
|
163 |
146 |
|
131 |
|
|
165 |
|
|
150 |
|
|
151 |
|
|
147 |
|
|
143 |
|
|
144 |
|
|
166 |
|
|
149 |
|
|
149 |
|
|
148 |
|
|
151 |
Figure 1
Sources:
ForeFlight. Vers. 8.2.3. N.p.: ForeFlight, 2007-2017. Computer software application
StatCrunch. Computer software. www.statcrunch.com. Pearson Education, 2007-2017. Web. 6 Mar. 2017.
“Southwest Airline Data.” StatCrunch – Data analysis on the Web. Embry-Riddle Aeronautical University, n.d. Web. 06 Mar. 2017.
Cite This Work
To export a reference to this article please select a referencing stye below:
Related Services
View all


DMCA / Removal Request
If you are the original writer of this essay and no longer wish to have your work published on UKEssays.com then please click the following link to email our support team:
Request essay removal