Mathematical Modeling of Diseases: Varicella Infection Rates
| ✅ Paper Type: Free Essay | ✅ Subject: Mathematics |
| ✅ Wordcount: 570 words | ✅ Published: 23 Sep 2019 |
To what extent can varicella be eradicated with the usage of vaccines?
Mathematical Modeling of Diseases: Varicella Infection Rates
Table of Contents:
Introduction . . . . . . . . . . . . . . . . . . . . . . . . . . . . . . . . . . . . . . . . . . . . . . . . . . . . . . . . . . . 3
Varicella Background . . . . . . . . . . . . . . . . . . . . . . . . . . . . . . . . . . . . . . . . . . . . . . . . . . . . 4
Basic Reproductive Number . . . . . . . . . . . . . . . . . . . . . . . . . . . . . . . . . . . . . . . . . . . . . . 5
Geometric Sequence and Series . . . . . . . . . . . . . . . . . . . . . . . . . . . . . . . . . . . . . . . . . . . . 5
Herd Immunity . . . . . . . . . . . . . . . . . . . . . . . . . . . . . . . . . . . . . . . . . . . . . . . . . . . . . . . . . 7
Case Trends . . . . . . . . . . . . . . . . . . . . . . . . . . . . . . . . . . . . . . . . . . . . . . . . . . . . . . . . . . . 9
Conclusion . . . . . . . . . . . . . . . . . . . . . . . . . . . . . . . . . . . . . . . . . . . . . . . . . . . . . . . . . . . . 10
Appendix . . . . . . . . . . . . . . . . . . . . . . . . . . . . . . . . . . . . . . . . . . . . . . . . . . . . . . . . . . . . . . 11
Abstract:
In this paper, I will examine the mathematical modeling of infectious diseases, utilizing the example of varicella, commonly known as the chicken pox. I will discuss the mathematics behind the model, as well as its implications for public health. By analyzing the rate of transmission and yearly presence in the United States, we can better judge the effectiveness of countermeasures and control methods.
Introduction:
As part of the UCI Summer Pre-med Program I attended this past summer, I had the opportunity to explore many medical topics, ranging from practicing laparoscopy to watching a live coronary angiography. Yet a new subject caught my interest: epidemiology. Scribbling down notes at a lecture, I became fascinated by modern medicine’s ability to interpret simple data and transform it into tools applicable to the fields of public health, clinical research, and preventative healthcare. One particular vaccination discussed, and the focus of this investigation, was varicella. Upon further research, I was shocked to learn that in 2017, there were “more than 3.5 million cases of varicella, 9,000 hospitalizations, and 100 deaths are prevented by varicella vaccination”[1] Thus said, without the 1995 implementation of the varicella vaccination in the US, there would now be an epidemic like so many others in the past.[2] When I went to get my flu shot this past season, its significance escaped me, but since learning these statistics, I know how crucial it is maintaining a healthy society and wanted to learn more. In this investigation, I aim to interpret the presence of varicella in the United States. Furthermore, I will calculate the extent to which varicella can be eradicated with the usage of vaccines.
Varicella Background:
Varicella is commonly known as the Chicken Pox, and it is a viral infection afflicting nearly 95% of people in their lifetime. People experience headache, fatigue, itching, swelling, and fever among other symptoms during the fourteen to sixteen day incubation period. Its symptoms are visually manifested in the form of irritated red spots, blisters, and ulcers.[3] Due to its distinct appearance, it is usually self- diagnosable. Normally, the sick try to stay isolated as to not spread the virus by fluid contact of airborne transmission, but it is extremely contagious with a 65- 85% transmission rate. [4]
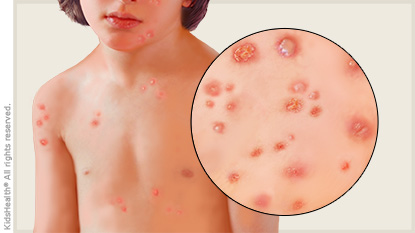
Figure A. Visual representation of varicella[5]
Basic Reproductive Number:
To find out just how infectious varicella is, we look to its Basic Reproductive number. A disease’s Basic Reproductive Number, denoted as R0 , is the average number additional infectious cases caused by a parent second case in an epidemic.[6] The R0 for varicella is reported to be somewhere between 3.5 and 5. For purposes of this paper, we will consider the extreme case to ensure precaution; our R0 is 5.0.
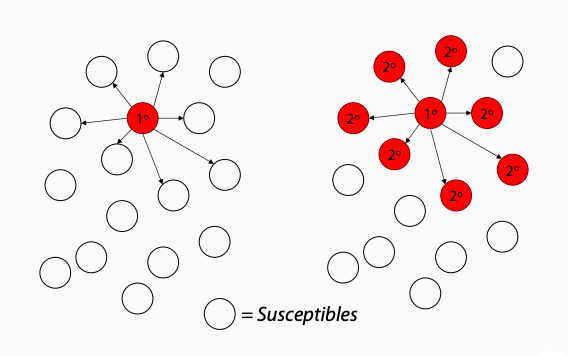
Figure B. Example of an epidemic with the Basic Reproductive Number ( R0) of 7.[7]
Geometric Sequence and Series Application:
Let’s say there are 2,000 unvaccinated and susceptible students in a school. If one student becomes infected and passes it on to five other people, and each of those five infects five more people, then how many “generations” would it take for everyone to be infected? We can apply the Geometric Sequence and Series theorem to find out.
→ (1) 25 = 25
= 125
= 625
= 3125
|
Generation |
Infected per generation |
Total infected |
|
1 |
1 |
1 |
|
2 |
5 |
6 |
|
3 |
25 |
31 |
|
4 |
125 |
156 |
|
5 |
625 |
781 |
|
6 |
3125 |
3906 |
Based off of our equation, it would take just 6 generations to infect the entire school. This illustrates the dire need for vaccinations to grant immunity.
Herd Immunity:
Herd immunity is a large factor in the infection rates within a population. It dictates that “for each person that is vaccinated the risk of infection for the rest of the community decreases.”[9] In other words, Herd immunity is when the recovered, who are immune, outnumber the healthy susceptible, leading to little chance of creating an epidemic. Vaccination serves as somewhat of a bridge from the susceptible to the recovered, in that the individual never goes through the disease. Vaccination is very important to society because it creates herd immunity superficially; the amount of people who are infected or recovered can be vastly smaller than a naturally-occurring setup. The Herd Immunity Threshold is the portion of the population that needs to be immune to control transmission of a disease. The Diekmann and Heesterbeek equation for Herd Immunity Threshold is
Ht =
= 1-
This equation can help us uncover the percentage of people needed to be immune to protect the population. As previously stated, the average number of secondary transmissions from one person is 5 (R0 = 5.0) so plugging that into the equation would give us
1 –
= 1 – (
) =
)
Therefore, 80% of the population needs to be either immune vaccinated in a totally susceptible environment in order to stop the spread of varicella. [10]
As more and more people are vaccinated, the herd immunity threshold also
increases. By decreasing the number of susceptible individuals, the herd immunity threshold decreases.
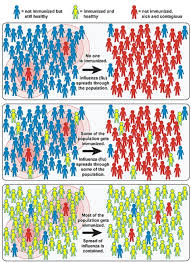
Figure C. Visual representation of Herd Immunity taking effect in a population.[11]
Case Trends:
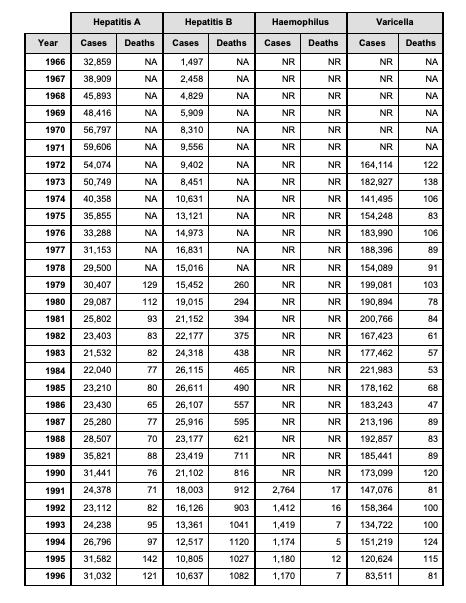
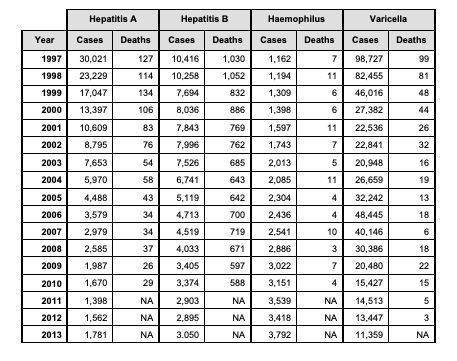
As vaccinations have become more and more standardized in society and widely implemented, we have experienced a decrease in not only varicella rates but many other diseases as well. Using data from the Morbidity and Mortality Weekly Reports (MMWR), I was able to create a graph.
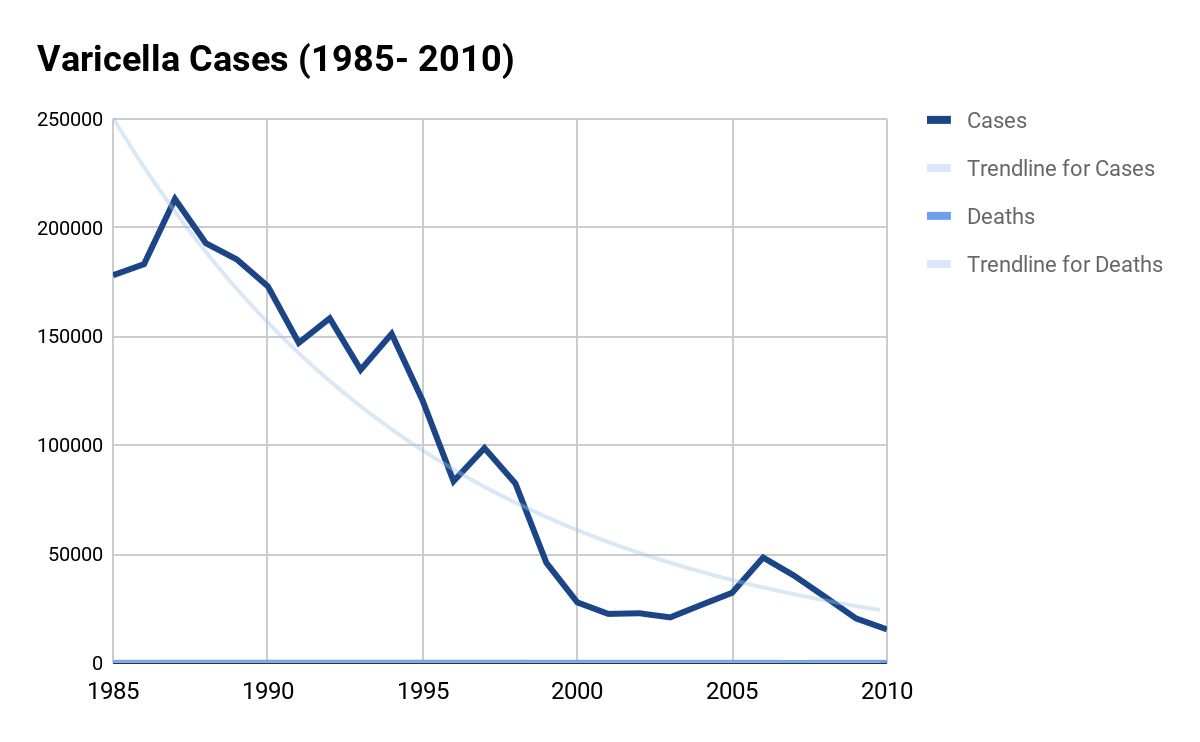
Based off of this graph and the data points, I used my calculator to find an equation for the Cases line of best fit.
The graph was very eye-opening because it really pointed out the drastic downward trend of cases throughout the last few decades. It seemingly will hit zero soon, however that is improbable due to human error; many people do not have access to the varicella vaccine or choose not to partake in it. Since the origins of vaccination, some people have opposed the practice on the grounds that it is not “natural”, or may contain harmful chemicals. In the 1970s, people began to falsely believe that the vaccinations could actually do harm, and blamed cases of autism on the vaccinations. [12] Since 2001, the percentage of people who choose not to vaccinate has quadrupled.
Conclusion:
I went into this IA with minimal information on the dynamics of epidemiology, and furthermore the importance of vaccination. Every year when I get my shots, I think little of it, but this report highlighted just how much they matter. I regret having the limited scope of just the United State’s data, because I know that in other countries it would vary vastly due to cultural views on anti-vaccination, as well as simply limited access to health care. I felt very privileged and humbled that I live in a place where these options are available to me. If I were to further my research, I would extend my perspective globally, and compare with other countries. Additionally, if there was sufficient data available then I could compare my data with epidemics of the past, particularly ones which wiped out populations.
I have an interest in working in the healthcare field, particularly in research; in the future, I believe that medicine will advance to further eradicate disease and viruses.
Appendix:
Bibliography
- “Chickenpox (for Parents).” Edited by Shayan T. Vyas, KidsHealth, The Nemours Foundation, July 2017, kidshealth.org/en/parents/chicken-pox.html.
- “Chickenpox | Monitoring Vaccine Impact | Varicella | CDC.” Centers for Disease Control and Prevention, Centers for Disease Control and Prevention, www.cdc.gov/chickenpox/surveillance/monitoring-varicella.html.
- “Chickenpox (Varicella).” History of Vaccines, www.historyofvaccines.org/index.php/content/articles/chickenpox-varicella.
- “Chickenpox.” Mayo Clinic, Mayo Foundation for Medical Education and Research, 1 Nov. 2018, www.mayoclinic.org/diseases-conditions/chickenpox/symptoms-causes/syc-20351282.
- “Chicken Pox (Varicella Zoster Virus) Infection Information.” MyVMC, 31 May 2018, www.myvmc.com/diseases/chicken-pox-varicella-zoster-virus/.
- “Epidemiology and Prevention of Vaccine-Preventable Diseases.” Centers for Disease Control and Prevention, Centers for Disease Control and Prevention, 11 Aug. 2015, www.cdc.gov/vaccines/pubs/pinkbook/varicella.html.
- “Facts about Chickenpox.” US National Library of Medicine, Pediatric Children’s Health, Sept. 2005, www.ncbi.nlm.nih.gov/pmc/articles/PMC2722564/.
- Facts About Chickenpox and Shingles for Adults. National Foundation for Infectious Diseases, Aug. 2009, www.nfid.org/publications/factsheets/varicellaadult.pdf.
- “History of Anti-Vaccination Movements.” History of Vaccines, www.historyofvaccines.org/content/articles/history-anti-vaccination-movements.
-
Marangi L, Mirinaviciute G, Flem E, Scalia Tomba G, Guzzetta G, Freiesleben de Blasio B, et al.
(2017) The natural history of varicella zoster virus infection in Norway: Further insights on exogenous boosting and progressive immunity to herpes zoster. PLoS ONE 12(5): e0176845. https://doi.org/10.1371/journal.pone.0176845 - MATHguide.com. “Geometric Sequences and Series.” MATHguide Is the Source for Interactive Mathematics for Students, Parents and Teachers Called MATHguide, www.mathguide.com/lessons/SequenceGeometric.html.
- “R Nought and Vaccine Coverage.” Khan Academy, Khan Academy, www.khanacademy.org/science/health-and-medicine/current-issues-in-health-and-medicine/ebola-outbreak/v/r-nought-and-vaccine-coverage.
- “Reported Cases and Deaths from Vaccine Preventable Diseases, United States, 1950-2013.” Centers for Disease Control and Prevention Epidemiology and Prevention of Vaccine-Preventable Diseases, 13th Edition , Apr. 2015, vaccines.procon.org/sourcefiles/cdc-reported-cases-and-deaths-from-vaccine-preventable-diseases.pdf.
- “The Mathematics of Diseases.” The Mathematics of Diseases, 25 July 2018, plus.maths.org/content/mathematics-diseases.
- “Varicella (Chickenpox): Questions and Answers.” Vaccine Information, Immunization Action Coalition, www.immunize.org/catg.d/p4202.pdf.
- Wharton M. The epidemiology of varicella-zoster virus infectionsExternal. Infect Dis Clin N Amer. 1996;10:571–81.
- “What Is Herd Immunity?” PBS, Public Broadcasting Service, www.pbs.org/wgbh/nova/article/herd-immunity/.
[1] “Chickenpox | Monitoring Vaccine Impact | Varicella | CDC.” Centers for Disease Control and Prevention, Centers for Disease Control and Prevention, www.cdc.gov/chickenpox/surveillance/monitoring-varicella.html.
[2] “Varicella (Chickenpox): Questions and Answers.” Vaccine Information, Immunization Action Coalition, www.immunize.org/catg.d/p4202.pdf.
[3] “Facts about Chickenpox.” US National Library of Medicine, Pediatric Children’s Health, Sept. 2005, www.ncbi.nlm.nih.gov/pmc/articles/PMC2722564/.
[5]“Chickenpox (for Parents).” Edited by Shayan T. Vyas, KidsHealth, The Nemours Foundation, July 2017, kidshealth.org/en/parents/chicken-pox.html.
[6] Marangi L, Mirinaviciute G, Flem E, Scalia Tomba G, Guzzetta G, Freiesleben de Blasio B, et al. (2017) The natural history of varicella zoster virus infection in Norway: Further insights on exogenous boosting and progressive immunity to herpes zoster. PLoS ONE 12(5): e0176845. https://doi.org/10.1371/journal.pone.0176845
[7] Glass, Gregory E. “Measuring Disease Dynamics in Populations: Characterizing the Likelihood of Control.” Johns Hopkins Bloomsberg School of Public Health, 2006, ocw.jhsph.edu/courses/PublicHealthBiology/PDFs/Lecture2.pdf.
[8]MATHguide.com. “Geometric Sequences and Series.” MATHguide Is the Source for Interactive Mathematics for Students, Parents and Teachers Called MATHguide, www.mathguide.com/lessons/SequenceGeometric.html.
[9]“The Mathematics of Diseases.” The Mathematics of Diseases, 25 July 2018, plus.maths.org/content/mathematics-diseases.
[10] “R Nought and Vaccine Coverage.” Khan Academy, Khan Academy, www.khanacademy.org/science/health-and-medicine/current-issues-in-health-and-medicine/ebola-outbreak/v/r-nought-and-vaccine-coverage.
[11] “What Is Herd Immunity?” PBS, Public Broadcasting Service, www.pbs.org/wgbh/nova/article/herd-immunity/.
[12] “History of Anti-Vaccination Movements.” History of Vaccines, www.historyofvaccines.org/content/articles/history-anti-vaccination-movements.
Cite This Work
To export a reference to this article please select a referencing stye below:
Related Services
View allDMCA / Removal Request
If you are the original writer of this essay and no longer wish to have your work published on UKEssays.com then please click the following link to email our support team:
Request essay removal


