How Rostow’s theory of development and the Harrod Domar Model link to India
| ✅ Paper Type: Free Essay | ✅ Subject: International Studies |
| ✅ Wordcount: 2878 words | ✅ Published: 23 Sep 2019 |
How Rostow’s theory of development and the Harrod Domar Model link to India
There are several development models and each model has a different process that leads to growth and development. Some of them include the classical school which included the work of Adam Smith with his “Wealth of Nations”, David Ricardo with his one sector growth model and Thomas Malthus. Other models include Rostow and his 5 stages to growth model and the Dual economy models for example Lewis’ unlimited supplies of labour and the Ranis and Fei dual sector model. In my essay, I am going to look at the work of Rostow and the Harrod Domar Model and link it to India.
There are 5 stages to Rostow’s leading growth sector model. The 1st stage is the “traditional society and the main features are that the agricultural economy exists which has a high labour force and during this stage the population has a low perspective on technology.” The 2nd stage is the “pre-conditions to take off which is where society has begun to develop and there’s more of an international rather than a regional view on society. The 3rd stage is the “take off which is a short, intensive period of growth. One of the main events that started in this stage was that the process of industrialisation started to happen. Workers and institutions started to focus on new industries,” The 4th stage is the “drive to maturity stage. This period takes place over time and key events that happen includes rising living standards and technology being used more. This can lead to rising economic growth and diversification.” The last stage is the “age of high mass consumption stage where the economy has transformed into a capitalist economy and the main feature of this stage is high production and consumption.” (thoughtco.com)
In Rostow’s model one of his main assumptions were that “all countries are in one of the stages and that as they started to develop, they climb upwards through each stage.” (thoughtco.com) There are other assumptions which include the fact that “development can only happen through capitalism and industrialisation, the process is a stage by stage process and development can be measured by an increase in GDP.” (academia.edu)
The Harrod Domar model is a model of economic growth where “the rate of economic growth in GDP is mainly determined by net savings/savings ratio(s) and the net capital to output ratio(c). The simplified equation is: rate of growth in GDP (change in y/y) =s/c” (Todaro M and Smith S (2015 p122). The equations shows us that with increased savings in an economy, the rate of growth increases but the rate depends on the denominator which is the net capital to output ratio. If c>s, then there will be growth in an economy but at a slower rate. The model “implies that there’s a negative relationship between net savings and the net capital to output ratio when looking at an economy’s growth. Another implication is that production may rise through increased capital accumulation which may happen through increased savings.” (intelligenteconomist) An increase in capital accumulation increases the quantity of capital which in turn leads to greater productivity and output. This then leads to greater long term economic growth.
There are several assumptions of the Harrod Domar model. Some of them include the fact that “there is no government intervention, the average and marginal propensities to save are the same and there’s no time lags between investment and the existence of productive capacity.” (yourarticlelibrary). The average propensity to save is the fraction of income that is saved and the marginal propensity to save is the fraction of an increase in income that is saved.
Rostow’s growth model links to India. Let’s start by looking at India’s growth rate. “Since the 1970’s, their growth rate has steadily grown over time. For example during the 1970s and 1980s, their grown rate was 4.4% a year, between the 1990s and 2000s, their growth rate had increased to 5.5% a year and over the last decade, the growth rate had increased further to 7.1%.” (worldbank.org).We can see that India’s growth rate has accelerated not only “through aggregate GDP but also through an increase in per capita GDP.” One of the assumption of the model are met as GDP has increased so we can conclude that that development has risen. India’s “growth rate has been stable which was mainly due to stability in every sector and the fact that over time India have been moving towards the service sector.” (worldbank.org)
We can bring in the idea of leading sectors in India. This is because India “has grown faster in the service sector and in industry but have grown the least in agriculture.” In the long run, India have had an “increase in the rate of investment and an increase in exports.” (worldbank.org) This shows that the service sector and industry are 2 of the leading sectors in India. This can be further shown as one of India’s current leading sectors is in “banking and insurance.” (internationalbanker) This is a tertiary sector hence it is a service sector. There has been a “massive growth rate in this sector which was supported by large amounts of investment in IT which can be shown through the increase in the banking sector index which is between 10-12% a year.” India’s insurance sector has also been booming and we can show this as they have been “ranked 5th in the largest global markets and they’ve had a growth rate of 15%.” Another one of India’s leading sectors is the “InfoTech industry” which is another service/industry sector due to it being “an IT sector which has got stronger due to an increase in knowledge and the success of professionals.” We can use the fact that India export a lot (in the long run) as “India’s IT sector is export driven and contributes to over 60% of GDP.” and can also be shown as Bengaluru can be considered as “the IT capital of India” as their IT sector contributes 25% of total exports.” (internationalbanker) This shows that one of the key determinants of GDP hence growth is the IT sector due to its large volume of exports both as a whole and in Bengaluru.
We can continue to look at how Rostow’s model links to India from the 5 stages in his model. The 3rd stage is take off and Rostow argues that “India have shown characteristics of this stage through industrialisation and diversifying into other leading sectors for example chemicals and engineering.” (indiatoday.in) This is an example of take off as industrialisation started to occur and workers started to diversify and specialise in new sectors. Here, one of the assumptions of the model is met here as India can be considered to be in the 3rd stage of development.
With their traditional/agricultural sector, “Rostow implied that modernisation is important as while some sectors are booming other sectors are still in stage 1. India can use this traditional sector to help consumption as a base to drive mass production.” (indiatoday.in) Mass production can lead to mass consumption which satisfies Rostow’s 5th stage in his theory.
We can show how the capitalism assumption in Rostow’s theory is satisfied due to capitalism in India growing over time. Due to an excellent financial system and government in India, “they have made a quick and easy transition into capitalism.” (theglobalist) With this increase in capitalism, India has benefited a lot for example “in Delhi, there has been a massive increase in welfare standards and this has increased the standards of living for the poor people as well as they have access to more information and are richer.” (huffingtonpost) This shows that benefits have trickled down to the poor which is a benefit of having a stable government. Here another of the assumptions are met as with an increase in capitalism, development has risen and another reason why development has risen is due to standards of living rising which is a component of the Human development Index needed for development. The assumption about development occurring through industrialisation can also be satisfied as India’s “leaders believed that industrialisation was key for development due to India being a large country and the fact that they have a large amount of natural resources.” (countrystudies.us)
The Harrod Domar can be linked to India. Let’s look at their growth rate.
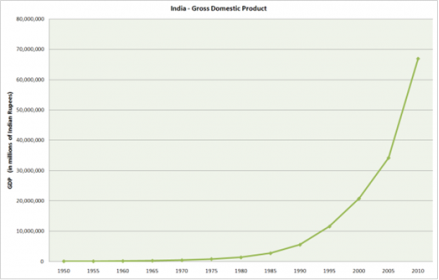
(economicshelp.org)
In the diagram above we can see that India’s growth rate was very low in the 1960s and 1970s. From the diagram, we can see that after the 1970s, India’s growth rate started to rise at a very fast rate. This may have been down to the fact that “India were emerging as they had access to financial capital due to an improvement in the financial system.” (rwer.wordpress) From the equation and the information above this implies that savings fell as there was a fall in investment so the numerator was low and the capital to output ratio rose so the denominator is high. Therefore the rate of growth was low. To help India achieve high economic development, their “leaders were more socialist and there was high government intervention in the economy. An example includes state ownership of certain industries.” (countrystudies.us) This shows that India had a command economy as there was high government intervention. However this doesn’t meet one of the assumptions of the Harrod Domar model as one of the assumptions was to have no government intervention but India has a lot 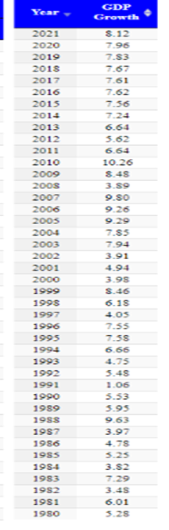 of it.
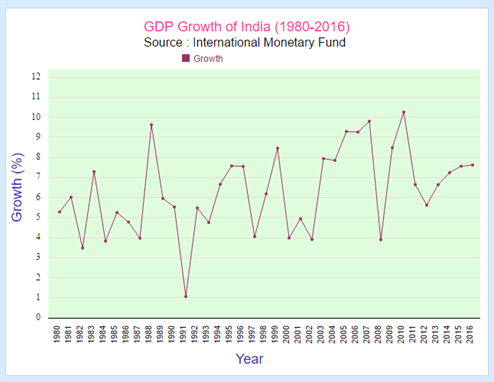
(statistictimes)
In the diagram and the data above we can see that the main trend of economic growth of India is that it has risen but has suffered major drops in the growth rate for example between “1990 and 1991, growth fell from 5.53 to 1.06 and between 2007 and 2008 where growth fell from 9.80 to 3.89.” (statistictimes) One of the key reasons as to why the growth rate fell between 2007 and 2008 may be the 2008 financial crisis and the recession that followed.
The main link between the Harrod Domar model and India is the “1st 5 year plan which happened between 1951 and 1956 and helped out with government strategies. The targets of the plan were to be implemented between 25 and 30 years and the main aim of the plan was to focus on the agricultural sector to invest in irrigation projects for example dams.” (sanaasaluja.wordpress) This links to the policies that India pursued after they had gained independence. During this period, India were starting to perform well for example their “net domestic product increased by 15%, per capita income went up by 8% and due to population growth, national income rose at a faster rate than per capita income.” (sanaasaluja.wordpress) The increase in population growth may have been down to the Indian government being able to channel in and allocate resources to health and therefore the population becoming more healthier.
In the 1st 5 year plan of India which was “introduced by India’s prime minister at the time, one of the key events to happen during this project was that India started many irrigation projects including the Bhakra, Hirakud and Mettur Dam.” (economywatch.com) One of the critiques of the Harrod Domar model is that “the model assumes a reliable finance system.”(sanaasaluja.wordpress). This may be a problem in some developing countries, however, it doesn’t apply to India as they have a reliable system and stable government especially as they had started irrigation projects which showed that the Indian government were able to channel in money to spend on these investments. This links to the Harrod Domar model as the money may have come from net savings and according to the Harrod Domar equation, this can lead to higher growth.
During this plan, India’s budget was “2069 rupees. Not only did India invest in just irrigation projects, they invested in other key areas which included transport and communications, social services and the industrial sector.” (economywatch.com) These areas are key for the Indian economy as with transport and communications, India can transport their goods and services to other countries increasing growth and world trade. The role of the government here is reinforced as without a stable government/state, India won’t have been able to channel money in to invest in all these key areas. Again the assumption of having no government intervention with the Harrod Domar model can’t be satisfied as the government helped with allocating resources to each area discussed above.
In India, the policies pursued were split into 2 distinct categories. During the time India were part of the British colony/being ruled by the British Empire, policies in India “were mainly focused on the strengthening and advancement of the British economy without taking any interest on the Indian economy. This may be a reason why at this time, India’s economic development was low which can be further shown due to the British government having monopoly power over the trade in India.” (indianeconomicsbyrahularora) This means that the British government owned more than 25% of the market for trade in India. One of the reasons for this was that India was under the order of the British Empire; they hadn’t gained independence from Britain. During the time Britain ruled India, “India’s economy focused on being an agricultural economy and they employed 85% of their population. However, even though they focused on this, the sector’s growth rate was very low.” (indianeconomicsbyrahularora).
However, after India gained independence on the “15th August 1947”, they pursued different objectives. Just after they gained independence, “they were low in economic development and a lot of people were very close to poverty and they pursued long term objectives which included raising their growth rate and improving their standard of living which was very low; raising this was one of the main objectives of the 5 year plans.” (historydiscussion) These objectives may have been pursued to offset the current situation India were in as soon as they gained independence which may have been down to India being under the power of the British empire.
Another objective was to “achieve social justice which was a prime objective and a lot of commitment went into it to achieve this. It was a predominant objective in the nine 5 year plans which was a massive part of government policy.” (historydiscussion) To achieve this, India needed to make sure that they had a stable government that would be able to achieve these objectives by making sure that they channelled in funds. This links well into the Harrod Domar model and the 1st 5 year plan as India were able to start achieving their objectives through the several 5 year plans which required investment which is a key component of the Harrod Domar model.
Overall, both models link well with India. Rostow’s model when looking at the leading sectors in India and especially when looking at the growth over time in India, we can link it to the different stages of Rostow’s model. We also meet several assumptions in the model. The 1st 5 year plan is the main link to the Harrod Domar Model. However, in the Harrod Domar model, we do not satisfy one main assumption (that there’s no government intervention) as India had a high amount of this after gaining independence.
References
- Jacobs, J (2018) Why Is Rostow’s Stages of Growth Development Model Often Criticized? At https://www.thoughtco.com/rostows-stages-of-growth-development-model-1434564 accessed 15/11/18
- Okwuosa, O (2018) A critical analysis of Rostow’s model of development at: http://www.academia.edu/11317934/Critical_Analysis_of_Rostows_Model_of_Development accessed 28/11/18
- Todaro,M and Smith S. (2015) Economic development. Harlow: Pearson Education Limited P122
- Agarwal P (2017), The Harrod Domar Model, at: https://www.intelligenteconomist.com/harrod-domar-model/ accessed 05/12/18
- Chand, S (2018) The Harrod-Domar Models of Economic Growth, at: http://www.yourarticlelibrary.com/macro-economics/growth-models/the-harrod-domar-models-of-economic-growth/31169 accessed 29/11/18
- Gupta,P (2018) India’s remarkably robust and resilient growth story, at http://blogs.worldbank.org/endpovertyinsouthasia/india-s-remarkably-robust-and-resilient-growth-story accessed 15/11/18
- Springfield C (2014) Indian Economy growth sectors and significant opportunities, at: https://internationalbanker.com/finance/indian-economy-growth-sectors-significant-opportunities/ accessed 01/12/18
- Ninan,T (2014) Indian economy is now in the post take-off stage: Walt Whitman Rostow, at: https://www.indiatoday.in/magazine/economy/story/19831031-indian-economy-is-now-in-the-post-take-off-stage-walt-whitman-rostow-771141-2013-07-15, accessed 19/11/18
- Das, G(2003) Democracy and Capitalism in India, at: https://www.theglobalist.com/democracy-and-capitalism-in-india/ accessed 28/11/18
- Parramore,L (2015) How India’s Traumatic Capitalism Is Reshaping the World, at: https://www.huffingtonpost.com/lynn-parramore/how-indias-traumatic-capi_b_6800262.html?guccounter=1 accessed 28/11/18
- The Role of Government in the Economy, at: http://countrystudies.us/india/94.htm accessed 30/11/18
- Strengths of Indian economy, at: https://www.economicshelp.org/india/strengths-indian-economy/ accessed 18/11/18
- Chandrasekhar,C (2017), The Indian Economy: 70 years after independence, at: https://rwer.wordpress.com/2017/08/30/the-indian-economy-70-years-after-independence/ accessed 06/12/18
- International Monetary Fund (2017) GDP growth of India, at: http://statisticstimes.com/economy/gdp-growth-of-india.php accessed 30/11/18
- Sanaasaluja (2015) The Harrod Domar model of economic growth, at: https://sanaasaluja.wordpress.com/2015/08/05/the-harrod-domar-model-of-economic-growth/ accessed 18/11/18
- Economywatch (2010) 1st Five Year Plan of India, at: http://www.economywatch.com/five-year-plans/1st.html accessed 03/12/18
- irahularora (2015) Focus of the economic policies, at: https://indianeconomicsbyrahularora.wordpress.com/2015/07/22/focus-of-the-economic-policies-pursued-by-the-colonial-government-in-india-and-its-impacts/ accessed 03/12/18
- Aggarwal M, Economic policies and the Planning Process of India, at:http://www.historydiscussion.net/economics/economic-policies-and-the-planning-process-of-india/686 accessed 03/12/18
Cite This Work
To export a reference to this article please select a referencing stye below:
Related Services
View all


DMCA / Removal Request
If you are the original writer of this essay and no longer wish to have your work published on UKEssays.com then please click the following link to email our support team:
Request essay removal