Performance of Maruti Suzuki India Analysis
| ✅ Paper Type: Free Essay | ✅ Subject: International Business |
| ✅ Wordcount: 3821 words | ✅ Published: 23 Sep 2019 |
Milestone Three: Data Analysis
Data Analysis
Descriptive Statistics
From the case study, the data displayed on the performance of Maruti Suzuki India in the a-segment can be used to properly analyze descriptive statistics. Both qualitative and quantitative data sets were provided for different periods and different products. The appropriate data sets that will be used will be the quantitative data and measures of central tendencies will be used such as mean, median and mode will be evaluated for the data set. Also, measures standard deviation and the analysis that make up the descriptive statistics. However, most of the data that has been provided, is statistically analyzed to give a mean in different markets and conditions.
Exhibit 2: Sales of Passengers Cars
The data set below shows the different models of cars in India and also those sold by Maruti Suzuki India Limited from 2008-2013. Using descriptive statistics, the most important measures to apply would be mean and the standard deviation. The data in the case were analyzed using segments in periods. The segments inculed are entry hatch, mid hatch, and pemium hatch for the A-sgement. Sedan, SUV etc have all been included in the total car industry. The main focus in the research is the A segment. The total sales for the A- segment are below.
2008/2009
Segment India MSIL
Entry-hatch 294.5 262.0
Mid-hatch 497.6 188.8
Premium-hatch 128.2 110.1
Totals 920.3 560.9
Mean sales 306.77 186.97
SD 185.01 75.97
2009/2010
Segment India MSIL
Entry-hatch 340.9 268.2
Mid-hatch 581.2 218.7
Premium-hatch 262.7 179.3
Totals 1148.8 666.2
Mean sales 382.93 221.1
SD 165.98 44.55
2010/2011
Segment India MSIL
Entry-hatch 478.4 373.3
Mid-hatch 628.8 252.1
Premium-hatch 438.9 209.6
Totals 1546.1 835
Mean sales 515.37 278.33
SD 100.20 84.94
2011/2012
Segment India MSIL
Entry-hatch 486.7 331.5
Mid-hatch 527.4 177.3
Premium-hatch 499.8 218.3
Totals 1513.9 727.1
Mean sales 504.63 242.37
SD 20.77 79.86
2012/2013
Segment India MSIL
Entry-hatch 435.1 284.6
Mid-hatch 415.1 156.2
Premium-hatch 531.8 244.0
Totals 1381 684.8
Mean sales 460.33 228.27
SD 62.41 65.63
The above analysis of the sales of passenger cars in the A-segment was done using mean and standard deviation. Standard Deviation has been incorporated to show the variety and spread of the values of the segments. Additionally, this may not apply in major way due to its not hugely significant information about the segments or periods. On the other hand, the mean is appropriate because it shows the mean changes in sales over the years. The mean sales for MSIL compared to the rest of India change from one year to the next year. After looking at the statical sanlysis shows that they had downward chabge in the mean sales from 2018-2013. Overrall from 2008-2009 the data shows that MSIL was making more money than 2012-2013. The mean indicates that the company attracted many customers the trend continued until 2013 when it drppped due to the problems with management and product production.
Exhibit 3: Year-wise Market Share Projections of Major Car Manufacturers in India
Manufacturer 2008/09 2009/10 2010/11 2011/2012 2012/13
MSIL 46.51 44.63 45.28 38.27 39.12
Hyundai 15.72 16.14 14.37 14.78 14.28
Tata 14.86 14.65 13.96 14.12 11.71
Mahindra 6.8 7.72 7.2 9.34 11.57
Toyota 3.02 3.27 3.36 6.09 6.16
General Motors 3.96 4.46 4.28 4.08 3.28
Ford 1.8 1.89 3.94 3.52 2.87
Honda 3.38 3.17 2.38 2.07 2.74
Volkswagen 0 0.21 2.06 2.98 2.44
Renault 0 0 0 0.14 1.95
Nissan 0.01 0.02 0.52 1.26 1.38
Skoda 0.89 0.9 0.92 1.3 1.08
Others 3 2.94 1.73 2.05 1.42
Above is the market share in percentage and it focuses on the trend covered by MSIL over the years. It also shows the mean market share for each year. MSIL – 45.51%, 44.63%, 45.28%. 38.27%, 39.12% meaning the over the years MSIl suffered some gain and loss over the years.
The analysis of the data descriptively mean shows that there has been change over the years in market command. Some organizations show an upward trend in market share but MSIL lost a lot of share and gained very little percentage. Overall, the data shows that MSIL is losing more that it can gain which centers on an internal problem.
Exhibit 4: Tata Nano Sales Figures and Some Explanation
The data presented has presented with sales and time. Tata drop in sales of up to 200 units in November 2010. The drop was primarily due to the safety of the products and the payment options of the product which discouraged down payments. Although there was sales gain in May 2011 it was due to the extended warranty and Nano version launch. It is important to note that Tata was on of MSIL biggest competitors and has been able to increase sales by identifying the problems in its product management and adjusting the business model.
Exhibit 6: Profile of existing A-Segment Consumers in India
In this exhibit the mean average household income people who earn about 50,000-75000 and are first time buyers in the entry-hatch segment. The average age is about 37 years old who are mostly self -employed with middle sized families. The data shows that anyone who is making less that 50,000 it is very hard for them to afford MSIL vehicles. (Mukherjee, Mathur & Dhar, 2015). Having disposable income and the average family size are great factors that come into play when trying to buy a vehicle.
Exhibit 10: Motivation for A-segment Cars Purchased from Maruti Suzuki
The data for the total industry of entry-hatch, mid-hatch and premium hatch sows that most customers are attracted to buying their first cars from MSIL. One reason being that they are cheaper to purchases than others in India. On the other hand, the percentage is low on people who will buy another vehicle from MSIL which probably has to do with the product and the poor product management. The lowest is replacing parts for the MSIL vehicle. (Mukherjee, Mathur & Dhar, 2015) It is clear that having to get spare parts for the care is too expensive than purchasing new vehicle and the lack of innovative products customers are choosing to not return.
Exhibit 11: Sales Trends for Diesel and Petrol Vehicle
In this exhibit, it shows a trend for the years 2007-2012. The statistical analysis gives the mean for the years in percentage and indicated that vehicles in the entry and mid hatch will reduce from 5% to 2%. Also, diesel vehicles are expected to increase significantly has well. Also, there is reduction in the projected sales of cars as well as diesel cars for premium hatch. Sedan and SUV/ MUV segments. (Mukherjee, Mathur & Dhar, 2015) . Overall statistics indicate that the total diesel cars will reduce significantly because of the petrol cars are really determined on the lifestyle of the person who wants the vehicle.
Graph and Tables
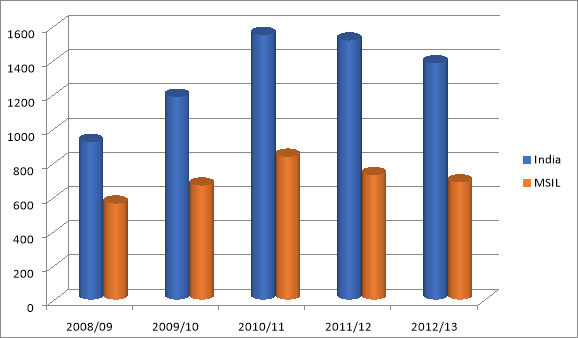
The graph above shows the sales of MSIL are seen to incrase in the second and third year but drop in the fourth and fifth year. The decrease in sales of the company is caused by poor product management and poor innovation and high replacement costs.
Exhibit 3: Year-wise Market Share Projections of Major Car Manufacturers in India Graph
The graph below shows the market share. Information about MSIL has been extracted from the data to show the trend of the market share of the company over the years. The reduction in market share is a result of the reduction of sales and due to poor product management.
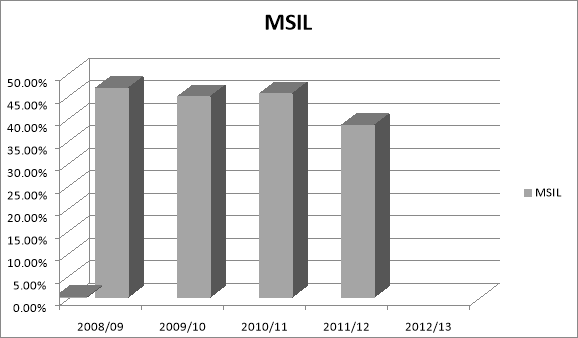
Exhibit 6: Profile of exiting A-Segment Consumers of India Graph
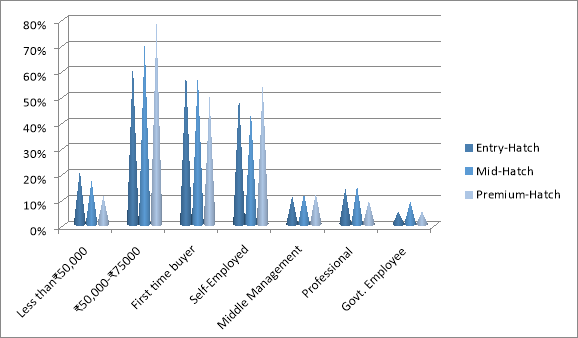
The above graph is representation of a profile of the consumers in the A-segment. The shows the different component of the consumer profile on the different axis. The graph shows that it is clear the major consumers are people with a higher income. Majority of the buyers are also first time buyer’s and self- employed. (Mukherjee, Mathur & Dhar, 2015). The graph also shws that the cheap costs attracts the first-time buyers for all vehicles and Disposable income is deciding factor in determining the purchase level. Family size also plays a part as to who is able to purchase the vehicle.
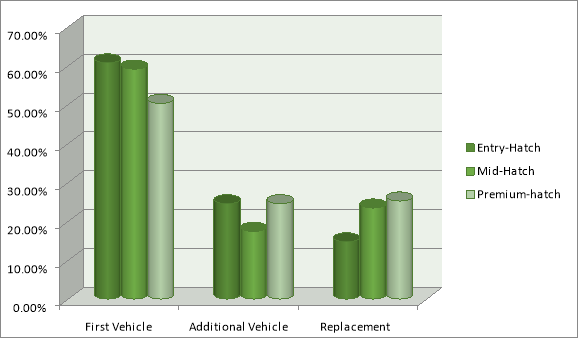
The above graph shows the percentage of sales made by first time buyers on their first vehicle. (Mukherjee, Mathur & Dhar, 2015) The sales decrease in the second vehicle as most the first buyer has no other reason to purchase the same product because of the lack of innovativeness and the cost for replacement parts is costly which discourages consumers.
Exhibit 11: Sales Trends for Diesel and Petrol Vehicles
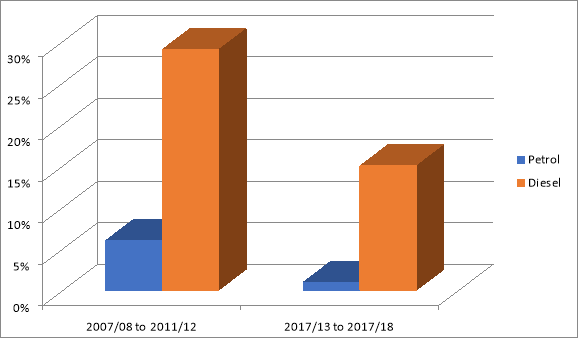
The graph above shows the percentage of the current and project3d sales for diesel and petrol cars. Petrol is more expensive than diesel. The graph shows higher percentage of consumes in the future who will purchase diesel cars. Meaning consumes are more cautious and they want to save on fuel. Which shows MSIL that it needs to ensure that the vehicles ae more cost effective to capture the demand.
Inferential Statistics
Inferential statistics aim at reaching conclusions that go beyond the the data provided. Exhibit 2 and 3 indicate a negative growth of MSIL. An analysis in a variance can clearly attest to that. Over the next few years Maruti Suzuki will decrease in sales and market share. If the company does not implement strategies to get better. The company will continue to see stiff competition in the A-segment. The output will be losses for the company. The market is always changing and so the company must device mechanism, to remain on top. Exhibit 4 shows the path that Tata has followed to ensure that they improve sales and market share. It is clear that other companies are adapting to consumer needs and increasing their stakes in the market. Inferential stattiscs from this exhibit shows that Maruti Suzuki will be overtaken by other companies like Tata because they are more attractive to consumers in the A-segment. Exhibit 6,10, and 11 indicates the need to make improvements on the product in a cost-effective way. They need to keep fuel effectives and product improvement in mind as well. (Mukherjee, Mathur & Dhar, 2015). The output overall from the data presented puts MSIL in a sore spot when looking at their collapse. If MSIL does not become more innovative the other companies will take over the A-segment.
Meaning of the Results
The results from the statistical analysis shows that MSIL is headed down the wrong path. The market share losses and decreased sales show that something needs to improve fast, if MSIL wants to stay relevant in the A-Segment. It was expected to see MSIL doing well in the market and beating competitors but the company has failed in many ways but mostly in the product management. The company failed to be innovative and that has caused the negative statistics of the company. With improvement in product management MSIL can move forward.
Ethics of Analyzing Data
Ethics has played a major role when looking at this data ensuring fairness, integrity and objectivity. First the source of the data is an important ethical topic. Collection methods have be analyzed and reliable. Informed consent and confidentially has been applied when looking at the data. The data used specifically related to the topic of study thus ensuring objectivity is maintained. The data analyzed was public company records so meaning its reliable. Apart from the process of looking at the data there was no conflict of interest so fairness was achieved.
Conclusion and Recommendations
Research Findings
The stakeholders of MSIL are supposed to be aware that the company is facing problems that need to be handled immediately. Based off the research the company is experiencing low sales and that is affecting their market share. Also the data show that company has challenging competition who have taken over the market. Customers have decided to buy products from Tata. The findings indicate that the stakeholders and the management need to do a lot of work to restore MSIL in the A-segment. The research also indicates a change in customer preferences.
Research Problem
The data analysis and literature review showed different areas of research that were not established before. For instances the consumer’s preference and the switching was clarified by the analysis. The fact that middle aged consumers are considering cost effective products. The consumers want improved products that will save them money and be effective. Consumers have decided to look for products elsewhere like Tata. Some of the reason are the adopted measures such as cost of living and responsibilities. Organizations have failed to be more innovative and lost their market share like MSIL. The aspect of changing customer preferences has made the research problem of market share and decline for MSIL.
Recommendations
The best recommendation based of the research problem needs to be actionable, feasible, and realistic to innovation. MSIL needs to improve its products to ensure that it is appealing to its consumers. Consumers need product that improved and efficient and cheap to maintain. MSIL to ensure fuel efficiently, maintenance costs, and improvement of vehicles to have better market share.
Questions and Concerns of Stakeholders
Overall I believe stakeholders would be concerned with the profitability of the entity of and the ongoing status. The stakeholders can question on the motives and improved services and products. They are affected by the benefits they receive from an organization and that can lead to questions and concerns. Some strategies of handling the question and concerns is by coming with strategies for the improvement of services. Listening and acting to the problems at hand can also be a way of handling concerns raised.
Additional Research
Having research on consumers’ needs is important because knowing what the consumers need makes it possible to make great products. Also, having new technology can be important to give an idea of what needs need to be done and the standards of the competitors. Material is important for production. The cheaper her labor and materials it makes it easier to make products that consumers can afford. Proper management is another area of concern that should be researched. Additional research in theses area can help with the organizational overall business model.
Reference:
- Mukherjee, J., Mathur, G., & Dhar, N. R. (2015). Maruti Suzuki India: Defending Market
Leadership in the A-Segment. Sales and Marketing Case Study. Canada: Ivey Publishing.
Cite This Work
To export a reference to this article please select a referencing stye below:
Related Services
View all


DMCA / Removal Request
If you are the original writer of this essay and no longer wish to have your work published on UKEssays.com then please click the following link to email our support team:
Request essay removal