Cracks Detection using Digital Image Processing
| ✅ Paper Type: Free Essay | ✅ Subject: Information Technology |
| ✅ Wordcount: 3131 words | ✅ Published: 25 Jul 2017 |
Cracks detection using digital image processing in MATLAB
Usually visual investigation methods have been used for inspection and monitoring of concrete infrastructures. Huge and tall structure such as cables bridges, high rising towers, dams and industrial power plant are known to have an inaccessible area and limitations in inspection field due to its geometry structure which is often dangerous , labor -intensive and involves lot of risks.
So, with rapid development in technology and its uses, researcher are trying to overcome these problem. Every now and then some research is going regarding these problem and trying to overcome it. So, I also have come with the idea of using digital Image processing in mat lab to detect the cracks in such structure.
Literature Review:-
As of today’s world, digital Image processing is getting better and better and used in all areas of science. With the help of digital image processing tools, various image processing can be applied to detects the cracks in structure. Not only in structures but also for bridges, towers, power plant and also in structure like steel ,roads, fatigues and sewer pipes.
A number of research studies have been conducted regarding detection of cracks by using Digital image processing .(1)The author of Korea Institute combines UAV technology in the process of recent breakthroughs and digital image analysis techniques to detect cracks in structure. In this study, the crack detection program with digital image analysis techniques was developed in order to the crack and width of the structure automatically. The developed program attempted to perform the image analysis for crack detection with Morphology method based morphological hydraulics and specially designed Morphological link for crack(Morph link-C)algorithm for S/W development was applied to the program.
The digital image was acquired in order to evaluate UAV applicability and performance and field application of the crack detecting program after targeting the bridges in common use. Comparing with the measured values in order to verify reliability of the new structural inspecting system for application in this study, it is verified that the accuracy above a certain level is secured.
Also, The below three core technologies shall be considered to develop the technology possible to detect cracks and calculate crack width of large structure through the digital image analysis and to put this technology to practical use.
- Optimal digital image acquisition and filming equipment configuration
- Crack analysis technique of a number of mass digital images
- Combining technique of multiple images that different positions are captured
And also the author from china(2)  proposed inspection system for measuring cracks in concrete structure and providing objective crack data to be used in safety assessment. The system consists of the mobile robot system and crack detecting system. The mobile robot system is controlled to keep a constant distance from the wall to acquire image data with a CCD camera on scanning along the wall. The crack detecting system extracts crack information from the acquired image using image processing. To improve accuracy of crack recognition, the geometric properties and patterns of cracks in a structure were applied to image processing.
Also, an inspection system using an image process, which can be a solution to the problems of crack detection in concrete structure, slow rate, subjectivity, and the inefficiency in managing data. Also, the system ensures the validity and possibility based on the experiment in the indoor structure, road tunnel, and subway tunnel. However, an erroneous recognition of a crack as non-crack and vice versa prevails. Therefore, the system is semi automated to get rid of wrong recognition of non crack as crack, and to identify crack by a graph search method using the user-based input of the start point and end-point of crack. In order for a crack inspection system to develop into an expert system, there needs to be further study of the characteristics of cracks and the algorithm must move towards complete automation.
Similarly,(3) The Komatsu Engineering Company has developed and commercialized an image acquisition system that can acquire the images of road and tunnel lining by using a laser-scanning device .(4) The Railway Technical Research Institute in Japan developed an image acquisition system of railway tunnel lining by using line CCD cameras. (5)Road ware Group Inc., Canada commercialized a system that acquires an image of the road with a CCD camera, an ultrasonic sensor, and a gyro-sensor with a speed of80km/h and a resolution of 3~4cm [7].
Those systems are useful to collect data of cracks, leakage, scale, and spall but only by using the image acquisition, and not through automatic defect detection. The algorithm for crack detection and measurement is required for fully automatic inspection system. It is necessary, therefore, to develop the automatic crack detection and measurement algorithm to obtain both fast inspection and objective crack data.
From the author of University of central Florida , paper describes the mechanism of non-destructive bridge inspection methods using HRDI and HDV digital crack detection and IR thermograph technology and the benefits of the combination thereof. The feasibility of applying these technologies for in-service bridge inspections are demonstrated and evaluated in the State of Florida under the university-government-industry collaboration research program. The purpose of the joint research effort is to utilize the innovative technology for more efficient bridge inspection programs and bridge management in Florida by developing a new quantitative performance measure for long term bridge monitoring, such as crack ratio and delaminated area, and the use of objective data resulting in more efficient and scientific bridge inspection database and management system. With the quantity of roadway structure assets increasing annually, coupled with concurrent increasing rates of deterioration being experienced by many of the existing structures, bridge owners need to find new and creative ways to ensure the structural safety of their bridges while they all too often face problems of reduced budgets and dedicated bridge inspection resources. Currently, the determination of bridge condition ratings in many countries is generally subjective depending on individual inspectors’ knowledge and experience, as well as varying field conditions. For the evaluation and documentation of concrete deterioration (cracks, efflorescence, delaminating, spalls, etc.) and changes overtime, the current practice of visual inspections can be lacking in accuracy and completeness, as well as time consuming and costly if road closures and access equipment are required for the inspection. Using the proposed new non-destructive technologies, bridge engineers can quickly and efficiently obtain objective current bridge condition information that has traditionally been obtained by more time consuming and more subjective close-up visual inspections and sounding tests. The digital output of these NDE inspection techniques improves on-site inspection safety and objectivity and contributes to improved inspector efficiency by significantly reducing the amount of inspection time in the field. However, it must be noted that while most of the NDE or sensor technologies do offer new efficiencies and/or additional objective assessment results to the bridge inspection process, they are not a substitute for inspectors conducting on-site specific follow-up and detailed structure investigations. While improved efficiencies in bridge inspection methods resulting from the application of the above NDE technologies bring significant benefits to the overall bridge inspection process, they are not a substitute for the continued need for sound and experienced engineering judgment. The authors believe that by offering new and improved inspection technologies to experienced bridge engineers and inspectors, bridge inspection programs will be strengthened through enhanced inspection data and will be more objective, consistent, scientific, and efficient.
Based on the nature of calculation and development of technology approach to process image, Image Processing Technique for crack detection can be divided into several categories. Each image consists of pixel which are represented by its integer values from 0 to 255. Based on these pixel values Operation technique conducted is accomplished in the spatial domain. However , desirable outcome cannot be obtained in spatial domain. So in this case ,usually Fourier or wavelet transformation is performed on the image. Again, the outcome image is processed in frequency domain. After wise, to reconstruct the image in spatial domain an inverse transformation is applied.
Another procedure to detect cracks using image is based on the training algorithm to solve a problem. In this process ,some technique directly deal with image without any training while other first construct a database which is divided into two subsets, the subset with crack image and subset with un-cracked images. For each subset ,a decision line is defined to represent the characteristics index, such as shape factor. With the help of these image , a program is used which is capable of comparing new images with decision line and assign it to the subset where it belongs. Especially Neural network and clustering method are widely used among the popular training techniques to learn the decision line.
Basically, two approaches have been applied to detect cracks from the images. Using dye solution and the other is without using dye solution to the surface material. Usually ,In this dye based detection process, a particular dye solution such as fluorescent is injected on the surface of concrete or other material. Depending on the solution type and color special or ordinary cameras are used to scan the surface of the material. These dye based method were used in past for detection of mini or micro cracks in different types of material like concrete ,ceramics tiles etc and also any kind of structure.
The other approach for finding crack is based on the color image without using dye solution. Since these method is less costly and less time consuming it is currently more popular.
A number of research studies have been conducted regarding the surface crack detection technique in different material. One of these attempts can be seen in work of Kittler at al. They proposed an idea of training based algorithm to get samples of the region, which are void of defects in the spatial domain. In this process, the new pictures were analyzed for the presence of any defects and also to find the location of the defects. In this method, clustering technique and morphological operation were performed to analyze the images. The experimental output of this method is shown in the figure below.
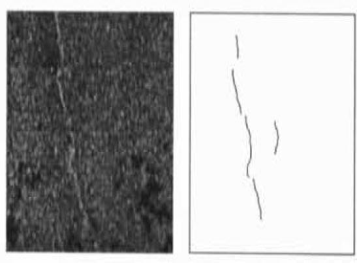
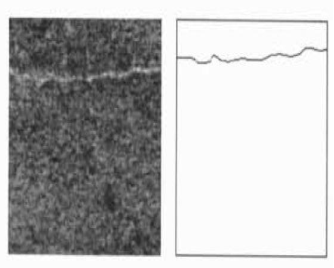 Â Â Â Â Â Â Â Â Â Â Â Â Â Â Â Â Â Â Â Figure . Crack detection on ceramic tiles (Kittler, Marik, et al. 1994)
                   Figure . Crack detection on ceramic tiles (Kittler, Marik, et al. 1994)
Image processing technique has been used for inspection of cement based materials for micro cracks and other micro defects (Ammouchea at al 2000). In this process, a red dye solution is used with the surface. So the dye solution can penetrate the porous region of the surface while the excessive solution are removed by polishing the sample surface. Once the dye solution is injected, a color image of 256 x 265 was taken from camera of the surface. The following operation is carried out on the taken image.
O(x,y) = max { R(x,y)0 – G(x,y) }
Where,
O(x,y) → Intensity of the output gray level image at (x,y) co-ordinates
R(x,y) → Intensity of the original image at (x,y) co-ordinate in red region.
G(x,y) → Intensity of the original image at (x,y) co-ordinate in gray region.
Afterward, using a thresholding value, the gray level image is converted to the binary image. Then, using entropy maximization method value of the thresholding is evaluated. This method is based on maximization of the entropy function ᴓ of gray level pixel.
á´“(k)=Â – [Â Â 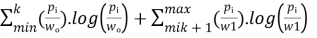 ]
]
where, Páµ¢ is the probability of a given pixel to have an intensity of i (Páµ¢=Náµ¢/N)
       Ni  Number of pixel having i intensity
      N Total no of pixel
     Wₒ & W1 Lower and upper bound of the probability to find pixel intensity
And also computed as:-
        k 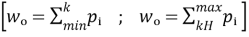
Based on the threshold to obtain binary image, a lower bound thresholding operation is performed. Then , using two morphological operations of eroding and rebuilding the binary image is post processed. This operation is conducted to eliminate noisy and small objects (i.e. Less than 10 pixel) from the image. However, second series of operation are needed to obtain the shape factors which are used to decide whether the pixels in a binary image are associated with cracks or other defects. To do so, a dimensionless packing density index Fc is defined.
Fc =  (2-4)
(2-4)
Where,
Aab=Object area
Aac= Area of its circumscribed circle
The value of Fc is equal to 1 for a circle and tends towards 0 for a very elongated object.Fig below shows results obtained in this method
Fig.
Also, Abdel-Ghader (_Abdel,Osama and kelly 2003) proposed an idea to find cracks on concrete surface using image processing technique .In this work, they implemented and compared 4 cracks detection method which include Fast Haar Transform( FHT), Fast Fourier Transform( FFT),Sobel edge detector and canny edge detection. They used 50 concrete image from a bridge deck of which 25 pictures with cracks and 25 pictures without cracks for their research .From their research ,they concluded that FHT was more efficient and effective method rather than other 3 method. Basically, FHT, a simplified Wavelet transformation decomposes the image into low and high frequency components, the mother Wavelet ᴪ(t) of Haar function and scaling ᴓ(t) are defined as:
á´ª(t) = 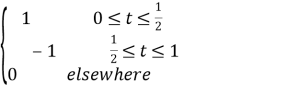
    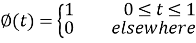
Relationship between Haar wavelet and scaling function and scaling function with itself is shown below
     ᴪ(t)=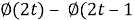 )
)
    (t)=
(t)=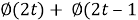 )
)
In this process, to detect crack the three quadrants of the first level transformation i.e. 2,3&4 are passed through a high pass filter to reduce nose and combined together to get magnitude of images. To decide whether crack exists or not, an empirical thresholding value is used.
Fast Fourier transfer motion (FFT) are used to derive the frequency component of the image intensity. The transformation and the inverse transformation were carried out using:
F(u, v)=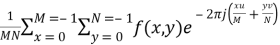
F(x, y)=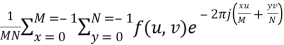
The canny edge detection is a convolution filter to detect filter noise from the image while processing. In addition, thresholding value is defined to see if a pixel belongs to an edge region or not. The Sobel edge detection is also a convolution filter defined for vertical and horizontal edges in images. This edge detection technique helps to detect the change in the image intensity in neighboring pixels. Filtering was done using convolution operation for each filter separated. Then, two filtered images is combined together at each location and result is a gray level image with enhanced edges.
G x = 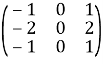 Â Â Â Â Â Â Â G y=
       G y= 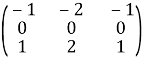
Default value of thresholding is defined as   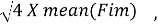 where
where

Another attempt to detect cracks in concrete specimen using optical fluorescent microscopy can be found in this research( Litorowicz 2006). To continue these processes, a fluorescent dye solution was used. The specimens were then light using Nikon optical microscope at a magnification of 10 times. The images were captured using a Sony DXC – 350 P video camera. Then, image pro Plus analysis software was introduced to perform the image processing operation. Then, using segmentation method, the RGB images is connected into a binary image. The threshold level was calculated based on the effect of the dye solution to the surface. To distinguish cracks pattern, several parameters were introduced:
- Angle between the vertical axis and the major axis of the ellipse covering the connected component
- Area of each connected component
- Dendritic length, which is the total length of all the one-pixel thick branches.
      4. Area ratio (i.e. of the area of the counted object and the entire area of the active image.)
      5.Radius ratio (i.e. The ratio of maximum radius and minimum radius for each connected component)
      6. Roundness using perimeter 2/4π2 x Area.
Intelligent crack detection on the concrete crack image using neural network was proposed in Moon and Kim paper (2011). This research was conducted to develop an automatic detection system that analyze the concrete surface and visualize the crack more effectively and efficiently. Basically this research consists of two parts: Image processing and image classification. First stage include image processing tools like filtering, subtraction and morphological operation in order to extract cracks from the background image (i.e. data such as the number of pixel and the ratio of major axis to minor axis for pixel area. While in second step, existences of cracks are identified using neural network to automate the image classification. In this process, 105 images (cracked and non-cracked) of concrete were used as a trained image including every kind of cracks. Following steps were carried out for image processing :
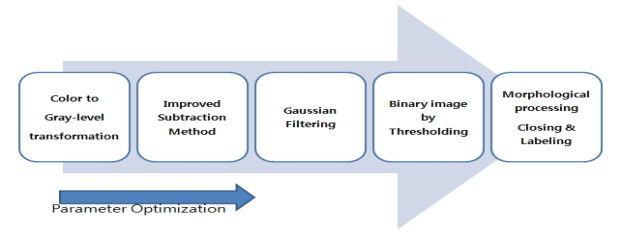
Fig. Image processing steps to detect cracks
First step in image processing is to convert RGB image into gray level intensity image followed by a subtraction transformation as follows:
ð¼ð‘ (ð‘¥ð‘- ) = ð‘šð‘Žð‘¥ {ð‘šð‘’ð‘‘ð‘-ð‘Žð‘›ð‘¥ð‘-ðœ-ð‘…ð‘- [ð¼(ð‘¥ð‘- ) − ð¼(ð‘¥ð‘- )], 0}
Where ,I(xi) and I(xj) are the intensity pixel of xi and X j respectively.
             Ri Neighborhood of that pixel xᵢ
. When the subtraction is negative number, it is represented as zero. Once improved subtraction method is used, threshold value is defined to detect cracks more effectively. The thresholding operation is given as:
ð¼ð¼ð‘ (ð‘¥, ð‘¦) = {2 Ã- ð¼ð‘ (ð‘¥, ð‘¦) ð‘-ð‘“ ð¼ð‘ > ð‘‡
                   ð¼ð‘ (ð‘¥, ð‘¦)     ð‘-ð‘“ ð¼ð‘ ≤ ð‘‡
To further smooth the image, a Gaussian law pass filter was applied. Then, an input gray level image is converted to a binary image where the values are represented as 0 or 1. Using Otsu’s method or valley emphasis method, the threshold value was selected. Morphological image processing including closing and labeling were applied to the image to extract image component such as shape of crack. The optimal parameters and their level associated with above operation are mentioned below:
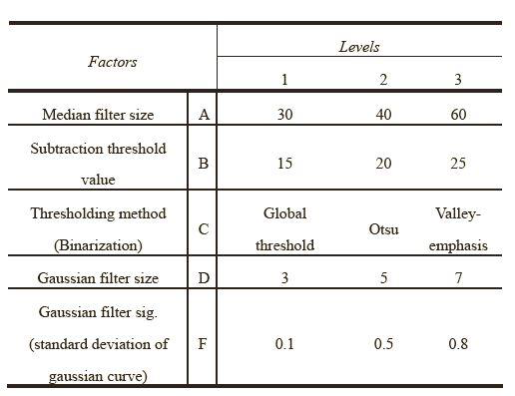
                Fig. Parameters and their levels
Using Artificial Neural Network (ANN) crack images were distinguished from non-cracked images. Also images were automatically identified as the crack or non-cracked images using ANN. The output value was represented either cracked (value 1) or non-cracked (value 2).
Another example of tracing based image processing technique can be found on Nishikawa research paper (2012). A robust automated image processing method was applied to crack detection on concrete surface. This method consists of two parts: First part consists of automatic construction of a filter for crack detection while the other part consists of noise removal and determination of indistinct cracks using iterative process. Using generic algorithm the part is conducted, where genetic individuals was represented as a tree structure. Using a trained program, a large number of images were combined and several images filtered were converted into a tree structure. An illustration of tree structure concept is shown below.
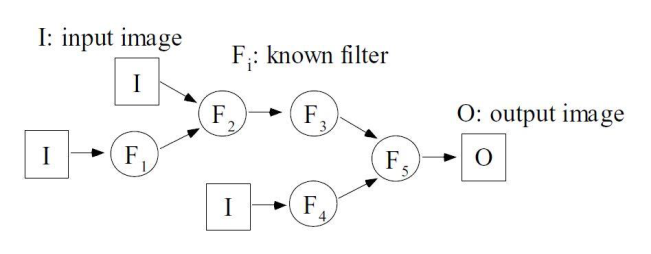             Fig. Construction of Tree structure with multiple filters(Aoki and Nagao 1999)
A combination of generic program was computed to train the program and results were compared to the target image (i.e. image generated by visual inspection. The comparison was between the distinct distributions of brightness between the images. To measure the filter performance the following formula was used.
E=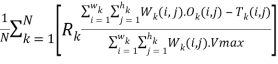
Where,
 N- No of training images in database
 – K-th target image
 -Output image
 -weighted image

. -Â Brightness of the weighted image in crack region
 )- brightness of k-th target image at position (i,j)
To reduce the false negative result, a superimposition operation using low resolution image was implemented. Figure below shows the algorithm used in above algorithm.
{ algorithm}
Cite This Work
To export a reference to this article please select a referencing stye below:
Related Services
View all


DMCA / Removal Request
If you are the original writer of this essay and no longer wish to have your work published on UKEssays.com then please click the following link to email our support team:
Request essay removal