Data Analytics to Solve Problems in McDonalds
| ✅ Paper Type: Free Essay | ✅ Subject: Information Systems |
| ✅ Wordcount: 3409 words | ✅ Published: 23 Sep 2019 |
1.0 Introduction
In this report, proposed data analytical tools will be applied to solve problems within McDonalds Corporation. To begin with, there will be an introduction of McDonalds, its operations and on-going problems which will then be followed by a brief description of various analytical tools that McDonalds analytical department have at hand. Available data will be analysed in SPSS in addition to other analytical methods which will help to solve the problems of the company and aid the decision-making process
2.0 McDonalds Corporation
The Corporation was established in 1940 in Bernardino, California by brothers Richard and Maurice. From 1953 onwards, the corporation took on the franchise approach using which they were selling the right to trade under their name. In 1955 Ray Kroc, a businessman, joined the company as a franchise agent whom then proceeded to purchase the chain from brothers. Ray Kroc has then legally formed Mc Donald’s Systems, Inc. after acquisition of the company from its former owners (McDonalds.com, 2018).
Currently McDonald’s is the largest chain of restaurants worldwide in many aspects including its market-share in the restaurant industry, revenue and brand value. The graph below presents McDonalds domination over other companies within the industry.
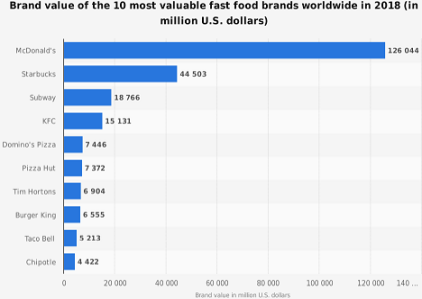
As seen above, McDonalds is a market leader by far and this is since it is serving over 69 million customers on daily basis in over 100 countries in over 37000 outlets as of 2017 (McDonalds.com, 2018). The company is known for serving its hamburgers and French fries. However, it also serves products such as breakfast items, milkshakes, wraps, soft drinks and many more including salads, fish, fruit and smoothies due to the backlash due to how unhealthy their food was.
McDonalds revenue is valued at 22.8 billion US Dollars in 2017 (McDonalds.com, 2018). Its revenue comes from rent, royalties, and fees paid by the franchises as well as sales in the company rented restaurants.
Growing so big has allowed McDonalds to gather a lot of various information’s which allowed them to form their own ‘big data’ which is being analysed by analytics department. All the important decisions are supported by the information at hand. In the upcoming months McDonalds is planning to enhance their Drive Thru as the general customer satisfaction is believed to be too low. As a result, an Analytica Consultant has been employed and given access to various data sets, related to McDonalds Drive Thru’s and the analyst is expected to statistically and analytically assess the data to Inform management heads about the reasoning behind low customer satisfaction as well as possibly finding a solution to the problem
3.0 Data Analysis
Statistical analysis is a very important component of data analytics. Statistical analysis includes collecting and inspecting every set of data from anywhere it can possibly be drawn. (Coolican, 2009). Statistical Analysis has many uses. For example: It can describe the nature of the data which is going to be analysed; It can explore the relation between the data and the problem and possibly identify it; It can prove or disprove the validity of various claims and furthermore Predictive analytics can run scenarios that will help to determine future actions of the company (Patil, 2012). A goal of statistical analysis is to identify trends and patterns in unstructured data which can then be used to impact customer experience and increase sales (Coolican, 2009).
3.1 Descriptive Statistics
Descriptive statistics is one of many ways to analyse the data. Descriptive statistics helps to describe, show or summarise the data in an expressive way which might point at a variety of patterns. These statistics however, do not allow us to make a conclusion beyond the data that is being analysed. It is simply, a way to describe the data that was already found rather than find new data or new information within the existing one (Villar, 2011).
Descriptive statistics are important. If a business was to simply present the raw data that it has acquired. Not many would understand it as the visualisation of raw data is very challenging. Descriptive statistics therefore enables businesses to present the data in a more meaningful way which then allows simpler interpretation of the data (Wegryn, 2015).
For example, If there would be data on how much money a large proportion of customers spend at McDonalds and this data would cover every day of the week the organisation would not only want to know the amount but also the distribution and mean of the money being spent. Usually there are two types of statistics, one of them is descriptive statistics which aims to summarise the s data collected from a sample whilst another being inferential statistics which uses the data to learn about the sample itself (Wegryn, 2015). In case of data that McDonalds has offered Descriptive Statistics is a ‘go for’ method. Not because it gives a lot of relevant findings but because it forms the basis for future analysis. The simple summaries that are found form the basis for further advanced analysis. Raw data in its form is very hard to analyse and does not make a lot of sense but when its cleaned up and displayed with the use of Descriptive statistics it is much easier to read but also other methods of advanced statistical analysis can be applied for further findings.
3.2 Probability and Distribution
 There are some processes in the world that an individual cannot see an outcome beforehand, this would include actions such as the toss of a coin which can be described as a random process having only two possible outcomes, the spin of a roulette wheel, the role of a dice or even tomorrows weather. However, although we might not know the outcome of certain actions beforehand what we can do is generate some indication of the likelihood also known as probability that an outcome will occur. Individuals use term ‘probability’ in their everyday live. For example, an individual might say that the probability of heads in the coin toss in 50%. Furthermore, we can hear a weather forecaster announcing that there is a certain probability of showers during the data as well as hearing that there is a 98% probability that a 40-year-old male will survive next five years (Setinbach, 2005). Probability describes an individual’s assessment of the likelihood of occurrence of an outcome. Probability is always expressed as a number between 0 and 1 where 0 is being an impossible and 1 representing that something is going to happened. The explain how probability works, a weather example will be used. If there is a weather forecast that ‘the probability of rain tomorrow is 30%’ what is meant by a number 0.3 in the form of probability statistics? As it cannot be claimed based on past frequencies since the weather characteristics are so numerous that it has never been the same before. Therefore, the best way to express the likelihood in this situation is to express a forecaster’s belief of showers being 30% based on his past experiences (Maydanchik, 2007).
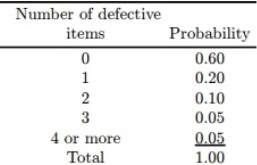
A probability distribution is a list showing the possible values of a random variable and the associated probabilities. For example, it could look like this:
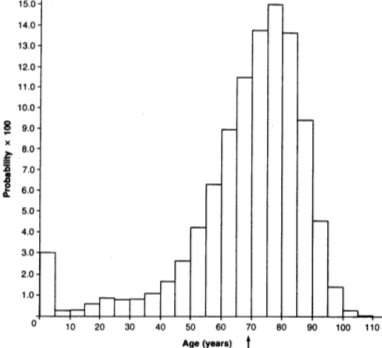
In addition to this simple example, there can be a joint probability distribution where a random process can be described according to more than one variable or attribute such as the relation of death and age on a population in which case it would be visualised in this way:
Making use of this statistical tool is very important for McDonalds in many aspects. For example, it is widely used for their staffing rota. With the use of data that a company collects a business can predict the levels of staff that should work at the restaurant at various hours. In term of the Data that McDonalds has offered in this scenario Probability and Distribution toll is a perfect match for what has been mentioned above. One of the Datasets offered by McDonalds presents a McDonalds drive thru data which informs an individual of how busy a drive thru is during various times of the day. This data can be simulated within the Probability and Distribution tool to visually present their peak hours as well as to prepare their level of staffing beforehand.
3.3 Hypothesis Tests and Confidence Intervals
Hypothesis testing is a very important tool in statistics. It is used to find out whether there is enough evidence in the sample data to prove that the hypothesis is true for the entire population. It is thanks to a hypothesis test that we say that a finding is statistically significant. Furthermore, it is a goal of a hypothesis testing to accept or reject a null hypothesis which is a statement that there is or there is no relationship between the sample data and the population (Freedman, 2007).
A confidence interval is a type of statistical measurement which has a goal of finding a real mean of a population. For example, if there is 40 random men being measured and their average height is 175cm, but it is also known that the standard deviation of their height is 20cm then the 95% confidence Interval which is most commonly used would tell us that the true mean of all mean is likely to be between 168.8cm and 181.2cm. However, as it is 95% interval there is a 5% chance for someone to be from outside of this scale (Franklin 2012).
This statistical method can be of a good use to many businesses especially McDonald. With the data available this method can be of a broad use. For example, the data set offered by the corporation is too big to be fully analysed and as a result, samples will be used. To ensure that a sample does represent the whole population the use of hypothesis tests in essential.
3.4 Analysis of Variance (ANOVA)
Analysis of variance is a collection of various statistical methods used to test differences between two or more means. ANOVA was developed by statistician Ronald Fisher. In ANOVAs setting, the observed variance is taken into parts which can be attributable to different sources of variation. Therefore, ANOVA provides a statistical test of whether the population means of several groups are equal which as a result generalised the t-test to more than two groups. There are two types on analysis which are: One-way analysis of variance which is a method used to test the equality of three or more population means by analysing sample variance. It is used to separate the data into different categories using only one characteristic (Setinbach, 2005). Another method is Two-way analysis of variance which is used to compare the mean differences between populations that have been split on to two independent variables. The purpose of this statistical analysis is to understand that there is an interaction between the two independent variables on the dependant variable (Kamber, 2011). With the data available, ANOVA can be used in many ways. For example, it could be used to compare the population data offered by the Company to see whether they are like each other and if there are no ‘extremes’ that do not fit the pattern.
3.5 Correlation and Regression
Correlation is used when there is a talk about association between two quantitative variables. Correlation is used as a measure of association between two variables when these variables are either not dependent or independent. Furthermore, the two most popular correlation coefficients are: Spearman’s correlation and Pearson’s correlation. When calculating a correlation for ordinal data Spearman’s technique is used whilst if there is a need to calculate correlation for interval ratio-type data Pearson’s technique is used. A value of correlation ranges from minus one to plus one. Minus indicated a perfect negative correlation, whist plus a plus one indicated a perfect positive correlation. In addition, if the result equals to zero it means that there is no relationship between the two variables. If there is a negative correlation it means that whilst one variable increases, the other one decreases and vice versa (Yan,2013).
Regression is used to inspect the association between one dependent and one independent variable. After a careful analysis is performed, the regression statistics can be used to predict the dependent variable in case if the independent one is known. Regression goes far beyond correlation as it has prediction capabilities. Regression is being used in an individual’s everyday life without them being aware of it (Everitt, 2001). For example, A doctor might want to use body weight which in this case would be an independent variable to predict a correct dose for a new drug which would be an independent variable. The purpose of running a regression in this scenario is to find a formula that would fit the relationship between the two of the and result in finding the correct dose (Bolton , 2002). This method can be used in a variate of situations.
Correlation and regression can be used in a wide range of scenarios. Especially for business such as McDonalds. In case of the data at hand this method will be the first go to option as it will allow the consultant to see whether low customer satisfaction is directly linked to something. When there will be assumption, correlation and regression will be used to see whether there is a strong match between the data or not.
4.0 Analysis the data in SPSS
As a Business Data and Analytics Consultant for McDonalds I am now to analyse various data sets given to me by McDonalds to resolve their ongoing issues. I will be using an SPSS program which is used for complex statistical data analysis. The program was launched in 1968. However, it is still widely used to solve various issues. The main goal of the analysis is to provide information to the business regarding their current Drive Thru’s operations and possibly finding any areas for improvement
4.1 Correlation and Regression
To begin with, a correlation and regression tool is going to be used to find out whether there is an association between the customer wait time and their satisfaction.
Sample of the Data offered by McDonalds –
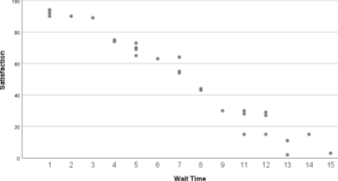
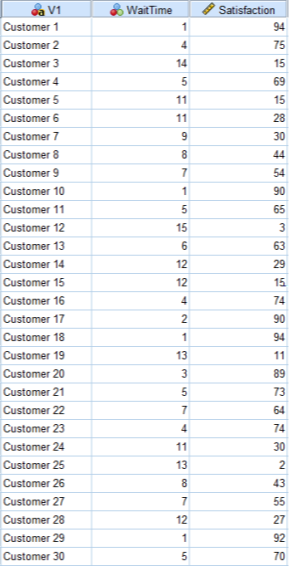 At first, this data set might not be telling us anything however a simple scatter graph can proof otherwise. As it can be seen below, as wait time increases satisfaction is on the decrease.
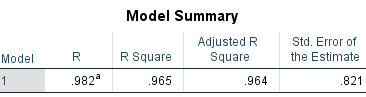 The output of Linear regression within the SPSS acts as a strong proof that there is a correlation between the two.
In this table, the R represents the simple correlation and as it is 0.982 it indicates a very high degree of correlation. Furthermore, the R square column indicates how much of the variation in the dependent variable can be explained by the independent variable in this case 96.4% can be explained which a very large figure is also. In addition, when we look at the ANOVA table which was produced because of running a regression test we can look at the ‘sig’ which represents the statistical significance of the regression that was run. In this case p < 0.0005 which is less than 0.05 and indicates that the regression model is statistically significant as seen on the graph below.
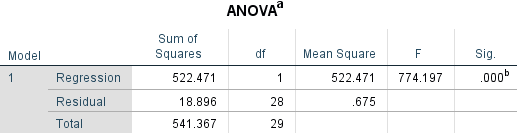
This analytical test allows us to say that customer satisfaction is linked directly to the waiting time at each of the Drive-Thrus.
4.2 Hypothesis Tests and Confidence Intervals
Below is another data set given by McDonalds. However, this time it is representing how many drive thru customers a sample of outlets has. In addition to the graph McDonald has also stated that it is able to serve 500 Customers per day without causing major delays for other customers. According to simple mathematics the mean number of customers per store is 489 and therefore outlets do not meet their maximum capacity. However, after running a hypothesis tests to the data presented below the results are as followed:
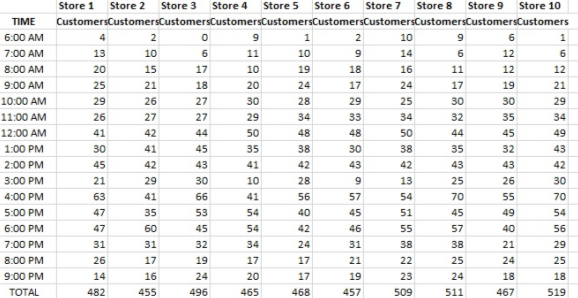
Data-
Results-
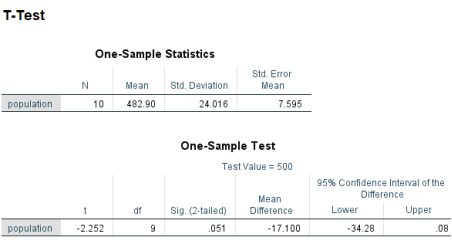
Looking at the results the N represents the number of entries in this case it was 10 total figures of customers visiting McDonalds outlets on a given day. Nextly, we now know that the mean is 482.90 which means that the restaurants do not meet their full capacity. However, the st.dev is as high as 24 meaning that the figure can move by 24 in either direction. Most importantly, the Sig. figure is .051 meaning that this finding is not statistically significant this is likely since the sample data presented by McDonalds is to small however it might also be due to a large variation between the means. Lastly, looking at the 95% confidence interval there is a possibility for the outlet to have more customers than its max capacity no matter the fact that the mean is 482.90. Nevertheless, the data implies that there is a very tiny chance that one of the outlets is going to be filled to the max of its capacity
4.3 Analysis of Variance (ANOVA)
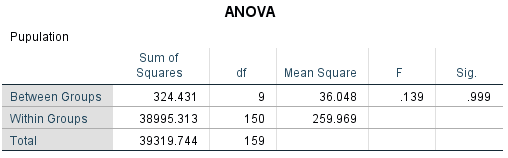
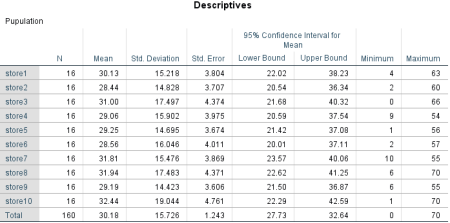 Lastly, I have used ANOVA and descriptive statistics to see whether the sample of population given by McDonalds in this case it was the 10 stores are like each and whether it speaks for the whole of a population. The results were as followed:
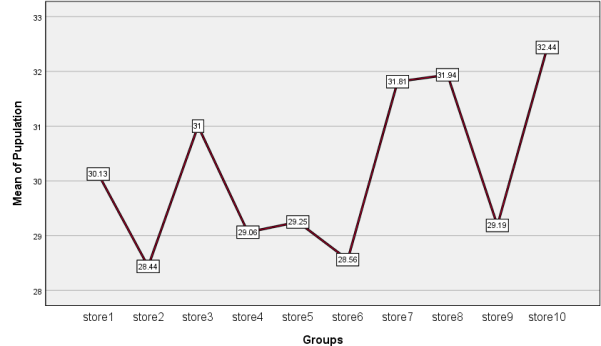
Looking at the Descriptions it can be clearly seen that the mean value of each stores is similar to each other meaning that the population is well balanced as well as lower bound and upper bounds being very close to one another. Nextly, looking at the ANOVA results the sig value is as high as .999 meaning that the difference between the means in not statistically significant therefore they are very close to one another meaning that they can represent a whole of the population. With this proven, and the hypothesis test carried out we know now that if the solution is going to be found, it is likely to be a working solution for each of the outlets having in mind how similar they are.
The graph below represents how closely mean number of customers per hour in each store is.
Summary
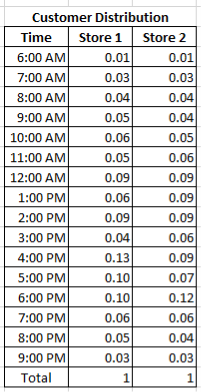 With the statistical analysis carried out above. It is now known that the data provided by McDonalds speaks for the population. Furthermore, it is well presented and due to the analysis, it is now known that customer satisfaction is linked directly to customer waiting time. However, due to further analysis we also know that it is unlikely that the waiting time is caused by the fact that McDonald outlets are serving more customers than they are capable of. Nevertheless, using common sense can also be a good idea when carrying out statistical analysis. Although McDonalds do not meet their full capacity in the form of customers serve, they do however meet their capacity at certain times. As it can be seen on the chart, on average at 6am only 0.01 of the customers visit the restaurant making it a place where a customer does not have to wait for their order However, looking at hours such as 4PM or 6PM there are many more people coming than a restaurant is able to handle in a hour and so the waiting time builds up without meeting the full capacity at the end of the day but having a full capacity at certain hours. A way to resolve this issue would be to improve the staffing policy at the ‘peak’ periods and reduce staff at times where there is no much traffic at the Drive Thrus.
REFERENCE LIST
- Mcdonalds.com. (2018). History | McDonald’s. [online] Available at: https://corporate.mcdonalds.com/corpmcd/about-us/history.html [Accessed 15 Dec. 2018].
- Coolican, H. (2009) Research Methods and Statistics in Psychology, 5th ed., London: Hodder and Stoughton.
- 3M. Berthold, D. Hand, Intelligent Data
- Analysis. Springer, Berlin, 2009
- M. Berthold, D. Hand, Intelligent Data
- Analysis. Springer, Berlin, 2009
- 3M. Berthold, D. Hand, Intelligent Data
- Analysis. Springer, Berlin, 2009
- Villars, R. L., Olofson, C. W., & Eastwood, M. (2011). Big data: What it is and why you should care. IDC White Paper. Framingham, MA: IDC.
- Davenport, T & Patil, D. (2012). Data Scientist: The Sexiest Job of the 21st Century. Harvard Business Review, 90, 70-76.
- Everitt, B. S. (2001). A Handbook of Statistical Analysis Using S-PLUS (2nd ed). Boca Raton, FL: Chapman and Hall/CRC.
- Glenn Wegryn, (2015). Top 5 Analytics Trends for 2015, INFORMS Podcast.
- Jean Yan (2013) “Big Data, Bigger Opportunities Bowman, M., Debray, S. K., and Peterson, L. L. 1993. Reasoning about naming systems
- Han, J. & Kamber, M. (2011). Data Mining: Concepts and Techniques, Third EditionL Morgan Kaufmann
- Bolton, R. J., & Hand, D. J. (2002). Statistical Fraud Detection: A review. Statistical Science.
- Steinbach. (2005). Introudction to Data Mining. Boston: Addison Wesley.
- Maydanchik, A. (2007). Data Quality Assessment. Bradley Beach, NC: Technics Publications.
- Freedman, D., R. Pisani, R. Purves, and A. Adhikari. (2007). Statistics. 4th ed. New York: W. W. Norton & Company
- Triola, M., and L. Franklin. (2012). Business Statistics. Boston: Addison-Wesle
Cite This Work
To export a reference to this article please select a referencing stye below:
Related Services
View all


DMCA / Removal Request
If you are the original writer of this essay and no longer wish to have your work published on UKEssays.com then please click the following link to email our support team:
Request essay removal