Soil Liquefaction Analysis
| ✅ Paper Type: Free Essay | ✅ Subject: Geography |
| ✅ Wordcount: 2844 words | ✅ Published: 18 May 2020 |
Contents
2.3. Current work on the similar types of project
2.4. Problem faced during project
3.4. Limitation of the project
4. Project Methodology and Requirements
List of figures
Figure 1 The Ring of Fire from (google image)
Figure 2. Regional tectonics of New Zealand from (Google Image)
Figure 4: Work Breakdown Structure
Figure 7: Schedule of project works
List of tables
1. Abstract
The main purpose of this project is to evaluate the liquefaction analysis od soil i.e. CSR (cyclic stress ratio) and CRR (cyclic resistance ratio) both are measured to present the liquefaction vulnerability of soil. For these measurements, the CPT and SPT method are used to find the strength and stiffness of soil. The different types of software such as ProShake2.0, Siesmosignal, and NovoLIQ are employed to evaluate the different earthquake event and its soil profile. From Strong motion database of NZ, the different earthquake events are taken over to observe and analyze the event in siesmosignal, which delivers the necessary data related to magnitude, time history, response analysis, etc. of earthquake.
In this proposal, the concepts of the liquefaction and advantages of this project and difficulties that are faced during the project are discussed. Scope and work breakdown structures of the project are presented as well. The project methodology and its requirements, schedule and plan of the different tasks are depicted. Also, the self and peer evaluation are discussed to show how the project was carried out.
For the analysis of liquefaction of earthquake events, the soil borehole data are found out, and all team members have also focused on different earthquake events and soil borehole data for the evaluation of liquefaction.
2. Overview
2.1. Background
 New Zealand is under the seismic active zone. Which is located in the pacific ring of fire, this area is under volcanism and seismicity laterally the boundaries of the Pacific Ocean. The background of the soil liquefaction susceptibility on Christchurch event. This ring covered 40,000 kilometers, which is passed through some country of Asia and America such as Japan, Taiwan, the Philippines, and some other countries of the United States.
Figure 1 The Ring of Fire from (google image)
Figure2 shows that NZ is situated at a curving collision zone among the Pacific Plate and Australian Plate. Among the two plates, Pacific Plate shifting directly west at 41-47 mm/year inside the vicinity of North island during it is moving west-southwest in the proximity of the South Island at about 37mm/year. In the North Island, the Pacific Plate subducts under the Australian Plate during it overriding the Australian Plate in the South. The subduction zone in the north create the Hikurangi Trough and Kermadec Trench during the overriding zone in the south created the Puysegur Trench with the Alpine Fault sitting in between the trenches. Which is the occasional phenomenon called as a transform strike-slip. The result of that, lots of earthquakes happen in New Zealand but some of them are cannot felt by humans. More than 15,000 earthquakes are measured by GNS Science but only 10% of an earthquake are felt by humans. (Lees, van, & Wentz, 2015). From this data, it can be predicted that New Zealand may hurt at least one M7 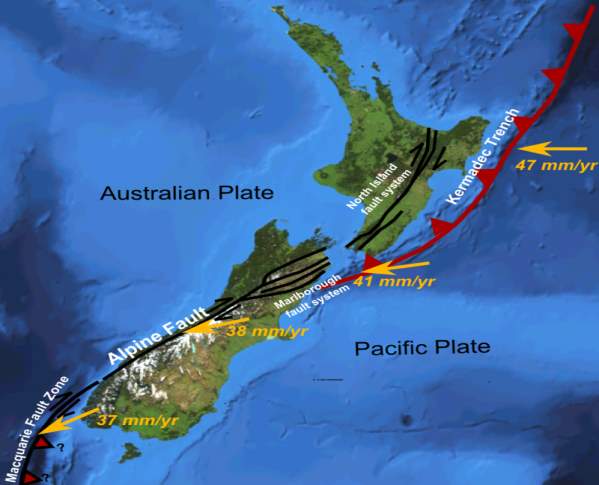
earthquake every 10 year and M8 earthquake every hundred years.
Figure 2. Regional tectonics of New Zealand from (Google Image)
2.2. Liquefaction
Liquefaction occurs because of increasing the groundwater during the earthquake event. Liquefaction mostly happens in the loos soil. The high-water pressure loss the strength of the soil and change the soil properties. Liquefaction susceptibility analysis has lots of criteria such as historical, geological, compositional, state criteria that are discussed in the final report. (Dr.Frankie, 2017). The high-water pressure induces the soil to undergo a partial to complete loss of strength. During the earthquake event, increase the water pressure in the soil and loos soil absorb the water and increase the saturation level then soil lost their property of strength, therefore, the bearing capacity is decreased. Meanwhile, the load of the building remains the same. So, finally, structure tries to settle in the ground. Susceptibility is one of the criteria to evaluate the liquefaction by other criteria which are discussed before. The highest hazard areas are concentrated in regions of a man-made landfill, especially fill that was placed many decades ago in areas that were once submerged bay floor (Dr.Frankie et. al, 2017).
There is another phenomenon related to liquefaction that includes flow failure, lateral spreading and sand boil. Flow failure is when soil strength “drop below the level needed to maintain stability under static condition. Estimation of site-specific engineering properties of soils and site conditions is a key aspect in the evaluation of liquefaction potential at a given site. Initially, screening procedures based on geological criteria and soil classification are often adopted to examine whether the soils at the site might be susceptible to liquefaction or not. It is also worth noting that previous liquefaction does not improve soil liquefaction resistance to future events (MBIE, 2016).
The potential for liquefaction is shown on the Liquefaction Hazard Map for Christchurch and this potential has been divided into four classes:
- High Liquefaction Potential: areas in which earthquake peak ground accelerations of 0.12g for a magnitude 8 Alpine fault earthquake potentially cause some of the soils to liquefy (Scenario 1). Note also that some other soils at the same location may not liquefy or could have a lesser susceptibility to liquefaction.
- Moderate Liquefaction Potential: areas in which the higher earthquake peak ground accelerations of 0.20g for a magnitude 8 Alpine fault earthquake potentially cause some of the soils to liquefy (Scenario 2). Note also that some other soils at the same location may not liquefy or could have a lesser susceptibility to liquefaction.
- Low Liquefaction Potential: areas in which only the highest earthquake peak ground acceleration of 0.34g for a magnitude 8 Alpine fault earthquake potentially cause some of the soils to liquefy (Scenario 3). Note also that some other soils at the same location may not liquefy or could have a lesser susceptibility to liquefaction.
- No Liquefaction Potential: areas in which an earthquake ground acceleration of 0.34g failed to predict liquefaction (or alternatively no soil data was available on which to base predictions). However, it should be noted that due to the limited spatial extent of soil information in the database, these areas might contain liquefiable soils or could be subject to other forms of instability, for example, slope failure.
2.3. Current work on the similar types of project
We are three members in the group, everyone has their analysis by taking different earthquake station, borehole soil data, and investigation on the similar earthquake event. We are going to analysis the compositional and historical criteria in this project. In the compositional criteria, we analysis the plasticity index and liquidity limit of the soil. Poorly-grade, cohesionless, gravel to coarse silt. Many argue that low-plasticity fines can liquefy, too. Anything less than a plasticity index of 12 should be considered susceptible to liquefaction, it also has to have a water content greater than 85% of the liquid limit, and the liquid limit needs to be less than 37%. If those criteria apply, then they assume the soil is susceptible. If the plasticity index less than 7 then criteria apply which discussed before (Dr.Frankie et. al, 2017).
2.4. Problem faced during project
It is problematic to choose the earthquake event and station. For getting the data for liquefaction analysis such as soil classification details, the specification of earthquake events and its station as well as borehole data are difficult for evaluation. Also, the software like NovoLiq is extremely hard to access for analysis of the soil liquefaction initiation. In addition to this, seismosignal software is also difficult to understand the procedure of transferring the data from earthquake event to this software. The borehole data is time taking procedure for all of us because everyone needs to work on the different earthquake station and borehole data.
2.5. Advantages of Project
This project will be observed at the different ground motion data that will use in liquefaction analysis. By the selected soil information, the status of soil liquefaction at the selected station and site will be considered to find proper means to estimate soil resistance to liquefaction. By using different methodologies and connect with the NovoLIQ software, every project member takes different data to check the potential of liquefaction at the respective sites and stations. However, this project limited to the cyclic mobility types of liquefaction.
3. Project scope
3.1. Scope of the project
In the liquefaction analysis, we all team member work on the various parameters of the soil and several earthquake events in this project. We have found the soil information of liquefaction site, and estimations of the soil resistance or measure according to the liquefaction. From the different methodologies inserted in NovoLIQ software, every member will use various parameters of the soil and method to evaluate liquefaction potential. This project mere gives the learning outcome of the cyclic mobility and not give the information about the flow liquefaction.
3.2. work breakdown structure
Following figure.4 depicts work breakdown structure of works that have been done in the project.


PARAMETRIC ANALYSIS FOR THE LIQUEFECTION
BRAINSTORMING
RESEARCH
DATA COLLECTION
DATA OUTPUT, ANALYSIS AND COMPARISIONOutput
Calculate CSR
Output Analysis
Det. Max. earthquake Acceleration
Project Proposal
Collect soil data
Presentation
Borehole data
Calculate CRR
Finalize Topic
NovoLIQ 
Seismosignal
FINAL
Create poster


CALCULATION
Collect the Earthquake data
Discussion of Topics
Narrow Down Topics
Compare output of all site
Det. Earthquake Magnitude
Structure of Project Proposal
Explanation of Software
Estimate distance from Fault
Work to be included in Topic
Estimate site topography
CALCULATION AND RECOMMENDATION
Final write up
Discussion of result
Prepare presentation
Recommendation
Future Plan
Figure 4: Work Breakdown Structure
3.4. Limitation of the project
In this project, the availability of borehole data and soil which team members will be able to access. During this study, collection of data is vital. Soil and borehole data on typical liquefiable soil types are desirable which will include type of soil such as gravel, silt, silty clay, clayey silt and other mixture of generally less cohesive soils or cohesionless soils.
4. Project Methodology and Requirements
4.1. Project Methodology
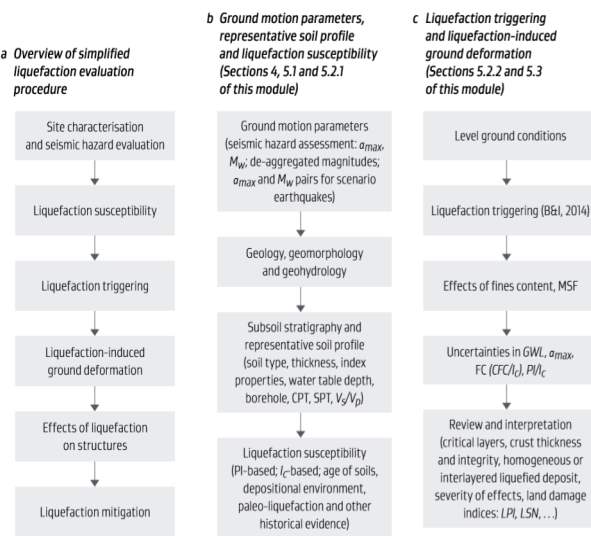
The MBIE (Ministry of Business, Innovation, and Employment) has published the module on the earthquake geotechnical practice which is grounded on the soil liquefaction assessment by (Prof. Cubrinovski & Dr. McManus, 2016) in the way of parametric analysis. The following figure elucidates the entire assignment significant procedures and design as well as the software such as NovoLIQ and siesmosignal that are used for the liquefaction analysis.
4.2 Prpject requirements
4.2.1. Data and Equipment
For parametric analysis of this project, soil details in borehole logs with SPT values are necessary. The geological conditions at sites are conjectured on the basis of nearby SPT. The calculation of the soil profile and shear wave velocity are done from borehole logs information with help of the ProShake2.0 software (EducationPro civil system, 2018). We have evaluated the hazard of soil liquefaction happening at the site by means of the subsurface information from the collated CPT surveys and the methodology industrialized.
The earthquake history data of the different location is taken from the New Zealand strong-motion Database (Van Houtte , Bannister, Holden, Bourguignon, & McVerry, 2017). Each member of this project team has evaluated the different location of the earthquake data and borehole logs details. This calculation delivers the value of the moment magnitude Mw and other related details are computed.
For an evaluation of this project, there is no need for the equipment. However, it was very difficult to gather the information related to earthquake location such soil profile, borehole log data and to perform the laboratory test, which is time, consumed.
4.2.2. Software
There are mainly three software used for the project. The ProShake is used for the soil analysis from NovoLIQ. Siesmosignal is employed for reviewing and assessing of earthquake data. NovoLIQ software is occupied to analysis of liquefaction vulnerability of the site.
5. Project Plan and Schedule
Following figure.7 presents the period of works of the project. Following table.1 elucidates the schedule of the project plan.
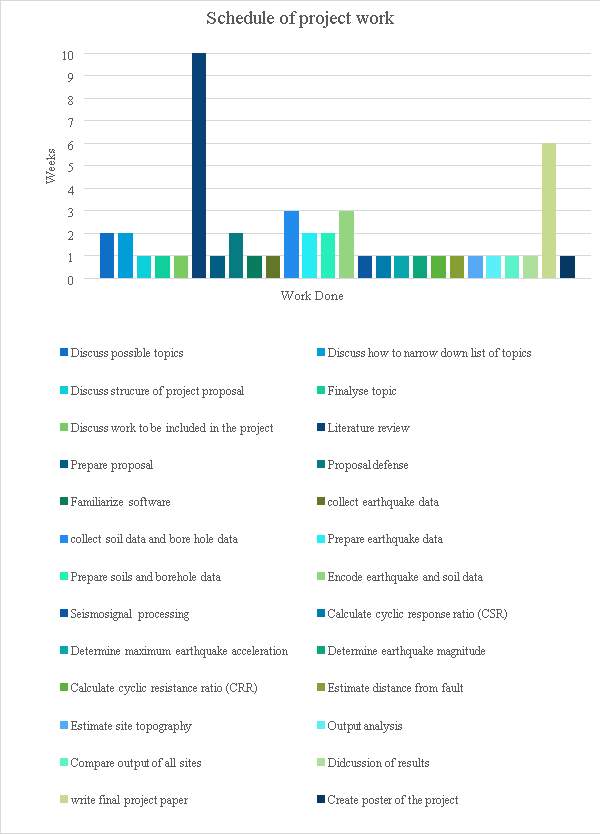
Figure 7: Schedule of project works
|
TASK NAME |
START DATE |
END DATE |
START WEEK |
DURATION (WEEKS) |
|
Brainstorming |
||||
|
1 discuss possible topics |
24/4 |
8/5 |
0 |
2 |
|
2 Discuss how to narrow down list of topics |
24/4 |
8/5 |
0 |
2 |
|
3 discuss structure of project proposal |
1/5 |
8/5 |
1 |
1 |
|
4 finalize topic |
8/5 |
2/22 |
2 |
1 |
|
5 discuss work to be included in the project |
2/22 |
22/5 |
3 |
1 |
|
Research |
||||
|
1 literature review |
22/5 |
6/8 |
4 |
10 |
|
2 write project proposal |
22/5 |
5/6 |
4 |
2 |
|
3 prepare proposal presentation |
29/5 |
5/6 |
6 |
1 |
|
4 familiarize software |
5/6 |
20/6 |
6 |
2 |
|
5 proposal defence |
5/6 |
13/6 |
6 |
1 |
|
Data collection |
||||
|
1 collect earthquake data |
5/6 |
13/6 |
6 |
1 |
|
2 collect soil data |
5/6 |
13/6 |
6 |
1 |
|
3 collect borehole data if available |
5/6 |
27/6 |
6 |
3 |
|
Data preparation and encoding |
||||
|
1 prepare earthquake data |
13/6 |
27/6 |
11 |
2 |
|
2 prepare soil and borehole data |
13/6 |
27/6 |
11 |
2 |
|
3 encode earthquake and soil data |
13/6 |
27/6 |
11 |
2 |
|
Calculation |
||||
|
1 seismosignal processing |
2/8 |
9/8 |
14 |
1 |
|
2 calculate cyclic response ration (CSR) |
9/8 |
16/8 |
15 |
1 |
|
3 determine maximum earthquake acceleration |
9/8 |
16/8 |
15 |
1 |
|
4 determine earthquake magnitude |
9/8 |
16/8 |
15 |
1 |
|
5 calculate cyclic resistance ratio (CRR) |
9/8 |
16/8 |
15 |
1 |
|
6 estimate distance from fault |
9/8 |
16/8 |
15 |
1 |
|
7 estimate site topography |
16/8 |
23/8 |
16 |
1 |
|
Data output, analysis and comparison |
||||
|
1 output analysis |
16/8 |
23/8 |
16 |
1 |
|
2 compare outputs of all sites |
16/8 |
23/8 |
16 |
1 |
|
Conclusions and recommendation |
||||
|
1 discussion of results |
16/8 |
23/8 |
16 |
1 |
|
2 come up with recommendations |
16/8 |
23/8 |
18 |
1 |
|
3 come up with future actions |
16/8 |
23/8 |
16 |
1 |
|
Final project writing and presentation |
||||
|
1 write-up of final project paper |
23/8 |
30/8 |
17 |
1 |
|
2 prepare PowerPoint |
26/7 |
6/9 |
13 |
5 |
|
3 final presentation |
30/8 |
6/9 |
18 |
1 |
|
4 create poster |
30/8 |
6/9 |
19 |
1 |
Section – B
1. self evaluation
We had taken the long time for the chosen the topic regarding our final project. We had also chosen the various topics and discussed in the group after taken the long time. In the earlier days we had chosen the topics such as the seismic design of the retaining wall how it resist under the various load such as the dead load, live load, lateral earth pressure. However, after doing some literature review and analysis on the retaining wall, we found the difficulties that do not have proper expertise to work on this topic and must done by each group member but it takes long time for us. When we get the suggestion regarding our topic from our supervisor, Dr. Afshin asadi, he suggested that we work on the soil liquefaction since I am fascinate about my topic. Team and I decided that changed our topic and hopefully started working on it and it would very interesting.
I have few knowledge about the liquefaction earthquake hazard from the previous semester subject geotechnical earthquake engineering. Therefore, I have researched that different parameter of the soil, types of the soil, effect of the liquefaction; however, I have never researched about the liquefaction susceptibility. A limited time of the study remaining team have started work on topic. Therefore, team decided the researched about the parametric analysis. In the analysis, I have facing the difficulties such as the found the borehole data regarding the cohesive or cohesion less soil is not same. Members give the good response regarding their individual task data according the New Zealand.
2. Peer evaluation
All team member supporting and were very active to discussing regarding the liquefaction analysis and give output try with their best abilities from the help of Dr. afshin asadi. In addition, contributes their self for developing the project. Hiren done the excellent work and investigation by the depth of the understanding its topic and perform his task very well. Dipak performed the good job and working in the team as group leader and understanding the topic to us very deeply and clear our concept. By myself, I performed the nice proposal. Finally, I and other team members all together made this proposal.
Works Cited
- Dr.Frankie, K. (Director). (2017). CEEN 545 – Lecture 23 – Soil Liquefaction (Part 1) [Motion Picture]. Retrieved from https://www.youtube.com/watch?v=Id3ktqZDv8A&t=790s
- EducationPro civil system. (2018). Geosysta Ltd. Retrieved from GeotechPedia: https://geotechpedia.com/Publication/Category
- Lees, J., van, S. B., & Wentz, F. J. (2015). Liquefaction Susceptibility and Fines Content Correlations of Christchurch Soils. 6th International Conference on Earthquake Geotechnical Engineering (pp. 1-9). Christchurch: ICEGE. Retrieved from https://www.issmge.org/uploads/publications/59/60/578.00_Lees.pdf
- MBIE. (2016). Earthquake geotechnical engineering practice. Retrieved from Ministry of Business, Innovation and Employment: https://www.building.govt.nz/assets/Uploads/building-code-compliance/b-stability/b1-structure/geotechnical-guidelines/module-3-liquefaction-hazards.pdf
- Prof. Cubrinovski, M., & Dr. McManus, K. (2016, May). Earthquake geotechnical engineering practice: MODULE 3: Identification, assessment and mitigation of liquefaction hazards. Retrieved from Ministry of Business, Innovation and Employment: https://www.building.govt.nz/assets/Uploads/building-code-compliance/b-stability/b1-structure/geotechnical-guidelines/module-3-liquefaction-hazards.pdf
- USGS. (2010). Liquefaction Susceptibility. Retrieved from Earthquake.usgs.gov: https://earthquake.usgs.gov/learn/topics/geologicmaps/liquefaction.php
- Van Houtte , C., Bannister, S., Holden, C., Bourguignon, S., & McVerry, G. (2017). New Zealand Strong-Motion Database. Retrieved from Geonet strong motion site: https://www.geonet.org.nz/data/supplementary/nzsmdb
Cite This Work
To export a reference to this article please select a referencing stye below:
Related Services
View all


DMCA / Removal Request
If you are the original writer of this essay and no longer wish to have your work published on UKEssays.com then please click the following link to email our support team:
Request essay removal