Shape Complexity Dynamics of Bangladesh Delta
| ✅ Paper Type: Free Essay | ✅ Subject: Geography |
| ✅ Wordcount: 2671 words | ✅ Published: 23 Nov 2017 |
Shape complexity dynamics of Bangladesh delta: A fractal dimension approach
Sugata Hazra Anirban Mukhopadhyay#, Sandip Mukherjee, Abhra Chanda and Tuhin Ghosh
Abstract
The lower deltaic plain of Ganges Brahmaputra Delta in Bangladesh is a tidally active flood plain with anastomosing network of rivers and tidal creeks. The rapidly changing morphology of this delta is mainly due to huge sediment discharge transported down the drainage basins, it’s redistribution by tides and currents , erosion, deposition and sea level change. The shape complexity of this delta mainly near the estuaries has been a major concern for the Geomorphologists for a long time. During the recent past, the study of morphology and landscape evolution has gone through a radical change due to the advent of remote sensing techniques. The present research attempts an analysis the shape change dynamics of this deltaic island region of Sundarban for the last two decades on the basis of fractal dimension index coupled with modern remote sensing techniques. It is observed that the shape of the islands with respect to their margin irregularities are being caused due to the change in fractal geometry at the micro level which in turn is a function of sea level rise over this time period.
Key words: Delta shape complexity; fractal dimension, Sundarban; Sea level rise.
1. Introduction
Sundarban mangrove forest of Bangladesh comprises a huge network of small alluvial islands formed by the deposition of sediments, transported down the drainage basins of the Ganges, Brahmaputra and Meghna rivers system (Gopal et al., 2006). Deltaic erosion and morphological change are continuously seen in the Sundarban region (Ghosh et al., 2003). Innumerable tidal creeks and channels with diurnal flow reversal and rapidly changing land forms make this delta a very dynamic one. Islands are undergoing erosion and accretion, therefore the morphology is continuously changing. The changes in the morphology are mainly driven by the variable supply of sediments (Brammer, 1993) and sea level change.
Shape analysis is a process which identifies the pattern of landscape. The process describes distinction between regularity and irregularity of shape (). The prime objective of the shape analysis is to understand spatial pattern of a geographical phenomena and its possible cause and predicts a probable future pattern (). Shape index, in terms of magnitude of roundness of the object or the measure of irregularity in terms of roundness, is a statistical method to quantify shape of any unit of area.
In a geographic context, shape is often characterized through a compactness indicator, which describes the form of a given region based on how far it deviates from a specified norm (e.g., circle, square, or triangle). The method for calculating this number utilizes one or more of the geometric parameters of the region being measured, such as area or perimeter (Elizabeth Wentz). The surface of the earth and especially landforms are always changing due to ever dynamic exogenetic forces contributing over the transformation of landforms in every moment of time. Due to this dynamism, the shapes of the landforms are not static outside a specific scale of time thus by creating the irregularity of shapes during the transformation process. Considering the transformation process as the media, we are required to examine the quantitative characterization of the shape irregularities of deltaic islands over the progressive temporal periods. The goal of the paper is to improve the ability to compare the shape dynamics caused due to external factors thereof over two decadal periods. Also it is to suggest a method for improving the ability to compare the shape of landforms in a GIS environment with statistical base that is less dependent on direct human intervention or intuition or visual interpretation.[t1]
As the fractional geometry especially known as fractal dimension of the object is a fundamental component of the object’s geometry to measure the irregularity. Fractal dimension is a fractionary value that describes the irregular of an object and how much of the space it occupies. It is a measure of how fragmented a fractal object is which may be understood as a characterization of its self-similarity (Backes and Bruno, 2008). We have taken this element as independent variable on the micro analytical base and by extracting the same for detection of overall shape change and the temporal dynamics of islands as the dependent variable on the macro analytical base over two decades. Sea level rise is found to be causal factor behind this dynamics. Present study aims at shape complexity dynamics study of Bangladesh Sunderban from 1999 to 2010 in the framework of Fractal Dimension (FD) and Shape Index (SI) analysis.
2. Study area and datasets
Bangladesh, a low lying flood plain delta is the land of rivers and canals. This[t2] delta is formed at the confluence of Ganges-Brahmaputra-Meghna river system and their respective tributaries. Pramanik (1983) has divided the coastal zone of Bangladesh into three main regions namely eastern region, central region and western region. Our present study is mainly on the islands of central and western coastal regions. Central coastal zone extends from Feni river estuary to the eastern corners of the Sunderban. The zone receives a large volume of silt deposition from Ganga, Brahmaputra and Meghna river system. The sediment load comprises more than 70% of the silt with additional 10% sand (Sarwar, 2005). The morphology of this zone is very much dynamic due to huge river discharge and strong current leading to high rate of erosion and accretion. Numerous islands are located in this region. Many islands have formed by the accretion and many have disappeared in last few years due to erosion.
Western region is mainly covered by Sunderban mangrove forest. Due to presence of mangrove forest this zone is comparatively stable in terms of erosion. The main characteristics of this zone are mangrove swamps, tidal creeks and mud flats. This region lies at 0.9 to 2.1 m above mean sea level (Iftekhar and Islam, 2004). Soil is of mainly silt loam or alluvial type. This region is very important for tourism due to Sunderban[t3].
Landsat TM-5 images of the year 1999 and 2010, 30 m spatial resolution, of Bangladesh Sunderban have been taken for this study. The path/row no of this datasets is[t4] …………. Satellite altimeter data of TOPEX (NASA) is taken for measurement of regional mean sea level using Nadir Pointing Radar Altimeter. The sea level rise is computed from the tide gauge measurement of various observatory of Bangladesh such as Hiron Point, Khepupara and Charchanga.
Figure 1
3. Methodology
The step by step procedures have been followed to examine the fact and to establish the concept. The raster and vector data processing and statistical analysis have been implemented in the remote sensing and GIS environment, the detail of which is furnished in the flow chart:
Figure 2
3.1 Satellite data processing
Two satellite imagery of different time (1999 and 2010) is taken into consideration in this study. Landsat TM-5 datasets were downloaded from the http://glovis.usgs.gov website. All the datasets are projected in UTM projection with zone no 45 and WGS 84 datum.
3.2 Measurement sea surface height variation
The measurement of regional mean sea level and sea level anomaly is computed from satellite altimeter data of TOPEX (NASA-built Nadir Pointing Radar Altimeter using C band, 5.3 GHz, and Ku band, 13.6 GHz, and POSEIDON (CNES-built solid State Nadir pointing Radar Altimeter using Ku band, 13.65 GHz). The datasets are analyzed for measuring sea surface height from the year 1992 to 2012. Inverted barometer correction was applied to improve thedata quality ().
3.3 Delta morphology analysis
This raster data format is changed to vector format by three successive stages. First is the digitization of the raw images in line layers. Once digitization is successfully completed, topology was built followed by the polygon building. After polygon building, creek and landmass layers are separated for two years. The landmass layers of polygons have converted to raster format again in order to use as the input for fractal dimension and shape index calculation in Fragstats (version 4.1) software. Fractal dimension and shape index are calculated using equation 1 and 2 (Jorge and Garcia, 1997).
Shape Index =  (1)
(1)
Where, P is the perimeter of the polygon and A is the polygon area. If the polygon value is 1.0 it expresses maximum compaction, where the shape is circular. As the shape becomes more complex the SI increases.
FractalDimension Index (D) =  (2)
(2)
The self similarity ratio and N is the number of step size here. Then[t5] the curve is defined as self-similar with fractal dimension D. FD of a curve may be any value D ranges from 1.0 to less than 2.0 for lines, and from 2.0 to less than 3.0 for surfaces. The higher the spatial complexity of a line or surface, the higher its fractal dimension (Nayak, 2008).
Index Number Analysis[t6] is carried out to calculate the gradual changes of both the factors having the base year as 1999. The Simple Aggregative Index of FD (Eq. 3) and Simple Aggregative Index of SI (Eq. 4) are calculated to identify the change in FD and SI. The Fisher’s Ideal Index (I0n) is also computed to see the relative change of SI and FD during the period 1999 and 2010 (Eq. 5). It is a compound index calculated from Laspeyres’s Index and Paasche’s Index (). The relation between FD and SI is analysed in terms of regression and correlation to identify the relation between island shape and fractal geometry[t7].
Simple Aggregative Index of FD (I0n) = (∑pn / ∑p0) x 100(3)
Simple Aggregative Index of SI (I0n) = (∑qn / ∑q0) (4)
Fisher’s Ideal Index(5)
- Laspeyres’s Index = ∑qn p0/ ∑q0 p0
- Paasche’s Index = ∑qn pn/ ∑q0 pn
- Fisher’s Ideal Index (I0n) = √(Laspeyres’s Index/ Paasche’s Index) x 100
Result and discussion
Statistical analysis of change in delta morphology
…..[t8]
The histograms of Fractal Dimension Index (Figure 3) and Shape Index (Figure 4) have been analyzed separately to examine the general statistical trends of the data. The summery of the histograms of FD and SI of the year 1999 is listed in the Table[t9] 1. It is observed that the modal frequency class has been defragmented into the higher FD values beyond the median range of 1.056 in 2010 and also the fractal diversity increases by 2 new classes in this year. The histograms of FD and SI of the year 2010 are summarized in the Table – 2. It is perceived that despite of being the modal class persistent, the frequency in the modal class is defragmented and distributed into higher SI classes beyond the median value of 1.475 and also 4 new SI classes are detected in the progressive period of 2010.
Figure 3
Table 1
Figure 4
Table 2
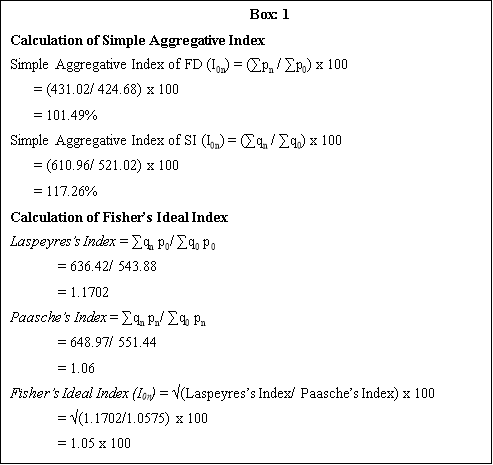
The Simple Aggregative Index of FD and SI are shown (Box 1) which is 101.49% and 117.26% respectively. The Simple Aggregative Index shows there is only 1.49% increase in FDI whereas SI increases by 17.26% in between 1999 and 2010, revealing about 8.63% changing effect of FDI over Shape Index. The Simple Aggregative Index of FDI and SI have confirmed that both the FDI and SI increases in this period and there is a definite changing effect of fractal geometry over the shape of the islands between 1999 to 2010 whereas the magnitude of the changing effect is only 8.63%.
The Fisher’s[t10] Ideal Index (Box 1) shows that the SI has increased with respect to FD by 5.19% from 1999 to 2010. It is signifying the there is a positive increase of shape diversity with respect to fractal diversity within the specified time period.
Relationship between FD and SI
The scatter plots and linear regression of FD and SI for 1999 and 2010 depicts that there is a strong positive relation of FD and SI of the Islands. The magnitude of Pearson’s correlation (r-value) increases with strong positive response in the 2010 is revealing that trend of changing shape diversity of Islands in terms of FD is increasing towards the gradual period. Both the r-values are positive and it is also evident that the relation of Island shapes with their fractal geometry becomes stronger in the progressive period of 2010 as the r-values have changed from 0.44 to 0.73.
Figure 5
The causal factor of Shape Dynamics-Sea Level Changes
To find the root cause of the shape[t11] dynamics of delta region, two main exogenetic factors have been examined on spatio-temporal basis such as creek density and sea level change. Creeks density is calculated for the year 1999 to 2010 by dividing the length of creek with the area of the island, which shows there is also a trend of gradual increase especially in mangrove forest area on the sea shore margin. It is observed that values of creek density increases towards the sea shore region where the sea water along with wave action is more active rather than dynamic river water in the inland areas which is shown in the Figure 6. Except one region the creek density is higher on the sea margin. The increase creek density may be the reason for formation of several islands in the central coastal zone due to defragmentation.
Figure 6
The temporal data of sea level changes of three observation points i.e., Hiron Point, Khepupara and Charchanga (Figure 7) are analyzed to identify the sea level changes within 1979 to 2000, shown in Figure 8. The progressive graph of the data of this temporal period exhibits an average positive gradual trend of sea level rise in this region.
Figure 7
Figure 8
To examine the causal source of that diversity and we have definitely found that there remains [t12]a positive sea level anomaly of 2.80 mm in between 1992 to 2012 in the concerned region (Figure 9). The fact again signifies that the sea level rise in the study area which contributes the changes of delta morphology capture in fractal geometry ultimately resulting into dynamism of island shapes over the progressive temporal period[t13].
Figure[t14] 9
Conclusion
The objective of the present study is to analyse the shape complexity dynamics of Bangladesh Sunderban delta in between 1999 to 2010. The dynamism of the delta shapes is analysed using in terms of fractal dimension and shape index. The change in fractional geometry of island/delta within the specified time period is captured and the observations are strengthening with the help of other statistical indices. The analysis of FD and SI parameters of islands indicate that there is an exponential relation of Shape complexity with the changing FD within 1999 to 2010.
The[t15] shape complexity of the islands of Bangladesh is increasing which is clearly evident from this study. There may be several factors for this complexity. Of these, sea level rise and creek density are important factors because Bangladesh is highly vulnerable to sea level rise (Brammer et al., 1993). But still there is no specific regional scenario for net sea level rise because the Ganga-Brahmaputra-Meghna delta is still active and having dynamic morphology and delivers approximately 1.6 billion tone sediment at the face of Bangladesh annually (Broadus, 1993), while there are some parts where land is subsiding due to tectonic activities (Huq et al., 1996). So this sediment replenishment is considered to balance subsidence of delta (Agarwala et al., 2003). This sediment deposition along with strong tidal current is the reason for the formation of some new islands in the central coastal zone in last few years. But still it needs more detail scientific study to reveal the dynamics of this delta complex and a lot of time series data of sea level rise to comment on this.
It is also notable that result FD computation is varies over the scales. Hence, the observation and conclusion is valid only on the existing scale over which the experiment is carried out. It is also pointed out that further study may be undertaken to make more reasonable judgment over it.
[t1]Need modification
[t2]Co-ordinate, geographical extent
[t3]No. of islands taken into consideration
[t4]Path / row
[t5]Model name
[t6]What these indices indicates or signify
[t7]Why used in this study (indices)
[t8]Write something here
[t9]Analyse more about table 1 and 2
[t10]Significance
[t11]Is there any other cause like thermal expansion . at least mention it
[t12]modify
[t13]overall comments: write something about physical significance at least one or two paragraph. Things are statistically analysed physical significance and observation is necessary.
[t14]Try to give a or two delta figure of two time with FD and SI value ebbraded to show the change in shape and FD relation.
[t15]Check the conclution once
Cite This Work
To export a reference to this article please select a referencing stye below:
Related Services
View all


DMCA / Removal Request
If you are the original writer of this essay and no longer wish to have your work published on UKEssays.com then please click the following link to email our support team:
Request essay removal