Sciences of Igneous and Volcanic Processes
| ✅ Paper Type: Free Essay | ✅ Subject: Geography |
| ✅ Wordcount: 5824 words | ✅ Published: 18 May 2020 |
1. The paradigm of melt-dominated, long-lived magma chambers has been questioned recently, and instead it seems that transcrustal magmatic systems dominated by crystal mush are more likely. Describe and discuss the evidence that has led to this paradigm shift.
Magma chambers are large pool of melt rock beneath the surface of earth. It has been believing for a long time that the magma chambers were magma filled reservoirs Where the melting evolution is regulated by removing the crystal settling or crystallizing along the walls of the chamber. The traditional paradigm on melt dominated long-lived magma chamber has been changing with the new evidence. Aggregating evidence from geophysical, geochemical, petrological, volcanological and geological observation is demonstrating new views of the classic magma chamber paradigm (Cashman et al., 2017).
First thermal models of crustal magmatism shows that is difficult to generate and then sustain large bodies of magma with 40% of melt in the shallow crust. Volcanic eruptions with poor crystal magma demonstrate the presence of such bodies, but thermal models and geochronological and geochemical information require this to be a comparatively transitory physical state (Cashman et al., 2017).
Secondly, studies in igneous petrology rocks shows a level of geochemical and textural complexity that cannot the related with the simple precipitation from a melt, but by a physical and chemical interaction of crystal residue with melt over long time periods of time in a thermally fluctuating mush environment. Furthermore, intrusive bodies originated from small laccoliths to large batholiths seems to have formed via amalgamation of many smaller and interacting pulses over more than 100 000 years. Evidence of famous volcanic eruptions suggested that disparate melt-rich lens or pockets the merge moments before or during the eruptions. Other than a gigantic chamber of pre-eruptive magma (Cashman et al., 2017).
Finally, geophysical techniques, such as seismology, gravity and magnetotellurics, were noticeably ineffective in finding large melt-dominated areas in the shallow crust beneath most volcanoes of the arc. In places where large crustal geophysical anomalies exist, such as in the Alitplano -Puna in Bolivia, these more like large of partial molten body of rocks than liquid rich chambers (Cashman et al., 2017).
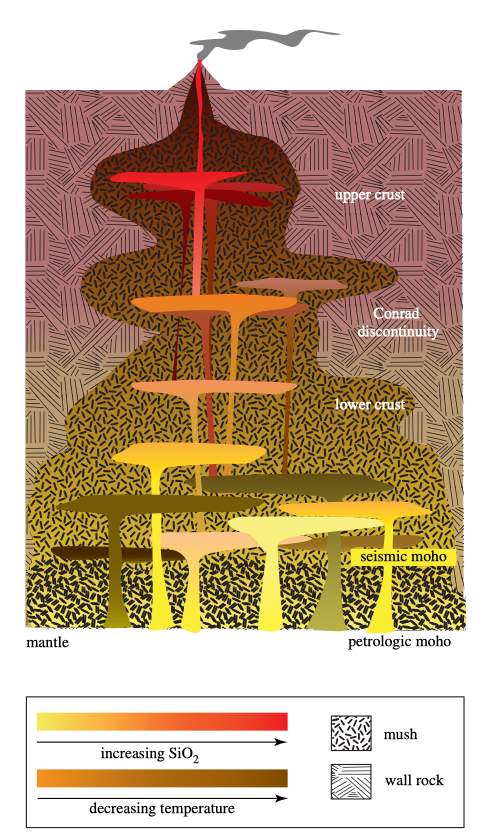
Figure.1-Transcrustal magmatic system, where melt processing in the profound crust generates melts that are transported to mid- and ultimately upper crustal concentrations. The potential for temporary vertical connectivity in this scheme introduces the option of consecutive melt lens destabilization.
The transcrustal magmatic system is dominated by crystal mush that are by located at or above the solidus and are equivalent to partially molten rock. Muses have their rheology controlled by deformation of crystalline framework that makes not eruptible in is totality. For the reason the mush behavior is sensitive to the absolute melt fraction. This is only real bellow 0.07, which establishes the transition of the fluid connectivity bellow which improves the strength of the crystal-melt aggregate with reducing melt fraction. as seen in Figure 2. However, mush fragments may erupt as glomerocrysts (crystals clots), cumulate nodules or restite. By contrast, eruptible magma is presented as crystal melting suspension (with or without exsolved volatiles). The transition from magma to mush takes places within a limited range of crystal content where the magnitude of bulk viscosity increases, and the crystal-melt suspension develops strongly non- Newtonian properties (Fig.1). The rheological transition occurs around 60%. By explaining the TMCS is possible to explain processes that represents internal controls on volcanic eruption such as: (1) relate physical processes of crystal-melt-fluid segregation to magmatic differentiation, (2) anticipate interactions between melts and fluids generated and stored at different depths, and (3) Determine the physical processes by which magma and related fluids migrate through the crust, accumulate in shallow chambers, and then erupt.

Fig (2) Changes in magma (orange) and mush (gray) rheology as a function of the amount of fractional particles. The blue curve is calculated assuming a maximum packing fraction of 0.6 and a classic Roscoe-Einstein formula (10). Red curve uses the (12) formulation. Inset shows changes in mush intensity as a function of particle volume fraction; green dashed curve is experimental data using Western granite; purple dashed curve is experimental data using Delegate aplite.
The idea of a magmatic system extends beneath upper crust is proven by geochemical cases for magma accumulation and processing in the deep crust. Most recent thermal and physical models claim an extensive igneous differentiation in the deeper parts of the crust. The melt storage in the lower crust may partially solve a problem in studies of magmatic systems because of the inability of geophysical imaging techniques to identify in large volumes of melt in the subsurface. These volcanic systems are underlain by electrically conduct zones of low velocity that are hotter than the surrounding crust and probably contain melt, for example: tomographic studies in the Yellowstone caldera in the USA identified a 10,000 km3 low-velocity body at 5-6o 17km depth, which underlain by an even larger lower crustal anomaly (Cashman et al., 2017).
The geometry of melt distribution in lower and mid-crustal reservoirs is not well established. Melt fraction estimation based on tomography and magneto-telluric images have a resolution that are typically no better than 1km, therefore, melt regions are so small that cannon be detected. But a reasonable concept tells that the melt is heterogeneously distributed in the lower crust and includes microscale melt distributed along grain boundaries, while mesoscale differences in melt concentration are caused by compaction and large-scale vertically oriented melt-rich lens.
The struggle of geophysical methods to identify rich bodies of melts in the upper crust suggests that large volumes of melt in upper crustal may be ephemeral. In the mid-ocean ridge, the melting lens is recognized as thin and sill as in form. In arc environment, the melt accumulations appear to be limited to the mid crust, where they feed multiple volcanoes. It was observed a low velocity zones are typically narrow a vertically elongate, averaged melt estimates are less than 10% and exsolved volatiles may be important at shallow levels in the middle of mid crust and individual volcanoes. Magma storage conditions can be inferred from the composition material’s compositions and textures (lava and pyroclasts). By using phase equilibria experiments, phase compositions and ratios can be matched to pre-eruptive magma storage circumstances, and bulk magma compositions are commonly used track magma evolution by crystal fractionation or assimilation Evidence for extensive entrainment of crystals all over the spatial extend of the magmatic system suggest that these methods not provide enough information describe most of the systems. The diversity of crystal “cargo” contained in the plagioclase, displayed the crystallization history is preserved in a complex compositional zoning that is show as shade gray in backscattered electron as shown at figure 2 (Cashman et al., 2017).
The crystal core resided in a cooler but deeper part of the magmatic system before being transported by melt hotter to a shallow to temporary storage region and then to the earth’s surface. This information demonstrates that various crystals in a sample or even various zones inside a crystal, developed from isotopically distinct melts. It is difficult to visualize such little scale isotopic heterogeneity existing inside an enormous and continuous body of melt. Further insight into the nature of magmatic storage systems can be found in measured time scales of magmatic differentiation, crystal growth, and (pre-eruptive) residence time in the transporting melt. Dating zircon crystals helps estimating time scales of magma differentiation, which are sufficiently resilient to be recycled between individual magma batches. Looking at that, zircon dating suggested that differentiation time scales of 103 approximately 105 which is contrary to the idea of magma accumulation in the upper crust before volcanic eruption which is between 1 to 1000 years (Cashman et al., 2017).

Fig. 2- Complex crystal history in magma from the volcano Mount St. Helens, USA. (A) Backscatter scanning electron microscope picture (inset) and isal distribution of plagioclase structure (as X An) in a single crystal from the eruption of Mount St. Helens in December 1980. The key structure (mode ~An 45) is significantly more advanced than that of the wide internal border area (mode~An 65) (Cashman et al., 2017).
2. Spreading rate imparts a first order control on the structure of the ocean crust. Describe the characteristics of slow spreading ridges and how these differ to ocean crust formed at a fast spreading rate. Include reference to morphology, structure, geophysical observations and geochemical variability.
The Mid-Ocean Ridge is seafloor system of mountain formed of tectonic plates. Mid-ocean ridges are one of the most important geological processes that form the earth. They produce more than two-thirds of the world’s crust, are the main means of geochemical differentiation on Earth, and supply vast hydrothermal systems that affect ocean water chemistry and maintain vast ecosystems. (Steele et al, 2008). Around the global ridge system, new lithosphere is created at rates over a factor of ten. Such variability causes massive variations within the nature of the magmatic, tectonic and hydrothermal processes. Seafloor spreading is a process that occurs at mid-ocean ridges, where new oceanic crust is formed through volcanic activity and then gradually moves away from the ridge. The morphology of mid-ocean ridge is determined by the rate of spreading floor. There are quite distinct morphologies in the world ridge system that represents different constructional processes. Studying the velocity of spreading rates, ocean ridges have been divided into fast-, intermediate-, and slow-spreading, each with different morphologic characteristics. The changes caused by the spreading rate still on debate because occur too long for direct observations.
The fast spreading ridges are characterized by a continuous volcano of axial shield that is affected by transforming faults and places where the spreading center experiences en echelon and overlapping offsets (Macdonald and Fox, 1983). Results from recent Seabream bathymetric information suggests segments of the East Pacific Ridge have 100 km of axial shield volcano perfectly continuous, usually with a narrow summit graben less than 500 m wide. In the other hand, the slow spreading ridge have a discontinuous string of volcanoes of varying height and morphology in the axial in the axial nonvolcanic zone. Only the gross tectonics structure of the rift valley shows transform to transform continuity. This distinction in morphology is compatible, with an underlying axial magma chamber which is relatively continuous between ridges offsets at fast spreading rates (Mutter and Karson, 1992) .
The topography across fast spreading ridges is more subtle than the topography of slow spreading ridges. Researchers believe that the heat of magma is important on the morphology of the ridge. The slow spreading ridges has a slow rate supply of magma that is not enough to create large fissure eruption the oceanic plate cools, resulting of the subduction the crest of the ridge. In contrast, the rate of slow spreading ridges magma is considerable higher, in which keeps the plates warmer and the crest of the rise does no subside. Furthermore, the slow spreading ridges has hundreds of seamounts form in the rift along the crest of the ridge, different from volcanism at fast spreading ridges that is subaerial fissure erupts connected with volcanic rift zones (Kearey et al,.2009.
The slow spreading ridge has a rough and faulted topography created in the rift valley is largely preserved in the older ocean basin, while the fast spreading rates there are not rift valley but is observed a triangular shaped axial high with a topography relatively smooth with a fine scale horst and graben structure (Mutter and Karson, 1992) .

Figure.3 -Bathymetric ocean ridge profiles at fast and slow spreading rates. EPR, East Pacific Rise ; MAR, Mid Atlantic Ridge. Neovolcanic area bracketed by Vs, area of fissure by Fs, extent of active fault.
Models to explain the formation of oceanic lithosphere suggested that is required a magma chamber beneath the ridge axis where the magma erupts to created lava flows and dykes of layers 2. Then, the magma inside the chamber solidifies to format most of a third oceanic layer 3. Detailed seismic surveys at ridge crests using refraction, reflection, and tomographic techniques has been used to seek the presence of such magma chamber. Survey carried at fast spreading east pacific rise show a region of low seismic velocities in the lower crust, 4-8 km wide and evidence for the top of a magma chamber at varying depths. Some observation suggests an invert correlation between magma chamber depth and spreading rate, because the magma chamber is less at 14°S compared to 9°N on the East Pacific Rise. This came across when in experiment the volume in which the P-wave velocity is less than 3 kms-1 is a melt lens and where the velocity is greater than 5kms-1 is regarded as solid, as shown in figure 4.
In contrast, most of seismic study in slow fast spreading Mid Ocean Ridges recognize low velocity zones but lacks evidence of melt or magma chambers. However, Calvert (1995) made a study and by isolating reflections from a data of Detrick et al. (1990) presumed magma chamber at a depth of 1.2 km and with of 4 km, but other studies also suggest that the process of crustal accretions in slows-spreading ridges is similar to the fast spreading ridges but the magma chambers involved are short-lived instead of a steady state. A melt lens grows in fast-spreading ridges where there is a sufficiently high rate of magma supply for it to continue at the top of the mush zone. This lens may stretch across the ridge crest for tens of kilometres but is only 1–2 km broad and tens or hundreds of meters thick. Slow-spreading ridges are presumed to have limited magma supply for a melt lens to develop and that eruptions only occurs when there are periodic influxes of magma from the mantle (Rona et al., 2013).

Figure.4 – Variation of P wave velocity in the oceanic crust at the East Pacific Rise crest at 9 ° 30′N, deduced from extended spread (ESP) and prevalent seismic depth point profiling. Shaded area shows a region with a high proportion of melting. An interpretation of velocities in terms of rock units and an indication of the extent of the area of anomalously low seismic velocities (LVZ)
The composition in the lithology and chemistry of basalts generated at mid ocean ridges shows a link with the spreading rate (Flower; 1981, The difference is believed to be related to the fraction environment after partial melting. Slow spreading rides system are characterized by a complex magma chamber where the widespread accumulation of calcic plagioclase, the presence of phenocryst liquid reaction morphologies and pyroxene dominated fractionation extracts. These situations are consistent with the fractionation of different pressure of short-lived chambers. This finding is equivalent to the pattern earth element in basalts sampled from the Mid-Atlantic Ridge. The basalt of the slow spreading ridges has a lower sodium and higher iron contents that usual Mid Ocean ridge basalt. Moreover, in the Fast-spreading ridges, however, suggest low-pressure basalt fractionation trends to iron-rich compositions with little plagioclase accumulation or crystal–liquid interaction. This is consistent with the magma chamber being a stable and steady state feature (Rona et al., 2013).
Transform faults and other axial offsets such as propagating rifts disturb the thermal structure of mid-ocean ridge segments by juxtaposition of a cold, rigid boundary with the spreading axis. The age contrast of the crustal across the transform fault dictates the degree of the thermal disturbance. The spaces between offsets are so close that becomes a problem to main magma chamber at any spreading rate. Near a transform fault the oceanic crust accreted may become thinner in consequence to a reduced volcanic budget. In addition, sear stress which are transmitted from the transform fault into the spreading centre domain, deforms the crust. Based in the GEBCO bathymetric charts In the North Atlantic the average transform fault spacing is 50 km and, in the Pacific, the average spacing of the transform fault is around 90 km (Rona et al., 2013).
The disrupting influences of transform fault in spreading centres is greater at slow spreading centres than in fast as a result of a spreading rate dependence on their spacing. Actually,
In every segment of Mid Atlantic ridge is influenced by the transform fault edge effect s along its entire length because of the viscous head-loss, lateral heat flow and propagations of shear stresses into the spreading centre domain. the spreading rates also dictates the style of deformations of transform offsets. Fast spreading rates have two axial offsets that are very rare in the slow ridges propagating rifts (spreading rifts that propagates along strike though plates, creating a V-shaped wake in their path) and Overlapping spreading centres (Rona et al., 2013).
There is considerable evidence of propagating rifts at fast spreading centres but not so much in the slow spreading Atlantic. However, stable cells that maintain their integrity for tens millions of years and persists for transforms offsets of only 20 km and for periods when asymmetric spreading reduces the transform to near zero. One of the hypostases raised is that in the fast spreading rate the isotherms are shallower than at slow spreading rate, therefore, the transformer offsets the rigid lithosphere will be thinner and more easily fracture across the fast spreading ridges. While the slow rates, the rigid lithosphere is thick enough to the point that even at the offsets transform faults the rift propagation is impeded (Rona et al., 2013).

Figure 5- Interpretive models of magma chambers beneath a fast (a) and slow (b) spreading ridge (modified from Sinton & Detrick, 1992, by permission of the American Geophysical Union. Copyright © 1992 American Geophysical Union).
3. Discuss how the extrusion of lava domes differs from that of lava flows. You answer should use examples to highlight the differences in terms of morphology, evolution and extrusion rate.
Lava domes
Volcanic domes are small masses lavas and rocks that are too viscous to flow great distances and pile up and accumulate around the volcanic vent. The lava domes are formed as magma cools and degasses considerable quickly after erupting. Eruption that build lava domes are a common style of volcanism in convergent margin settings and the resultant dome stands alone form in the crater of a volcanic cone or form part of a cluster or dome complex.
Lava dome growth is divided in two types:
Endogenous
Exogenous:

Figure. 6- to show endogenous vs. Reproduced from Kilburn and Luongo (1993).
Dome morphology
The dome morphology and eruptive behaviour depends more to the magma’s characteristics high viscosity and poor ability to flow than properly the chemical composition. Analysing by the petrology. there are two types of lava domes: crystal-poor, obsidian domes, which tend to be rhyolitic or rhyodacite in composition and crystal-rich domes, which tend to be rhyolitic to basaltic andesite in composition. The morphology of lava domes also depends on the underlying topography; domes are commonly restricted to crater areas and in these instances their shape is nearly circular, when erupted on the flanks of volcanic edifices, the shape tends to elongate downhill. Lava domes may also develop as complexes along linear or arcuate chains up to 30 km long.
The morphology of lava dome depends on magma rheology, topography settings, ascent dynamics and the mechanisms of the dome growth therefore, many scholars attempt to classify it following different criteria
Lava domes can be divided depending on form, texture and eruptive style. We have selected to stick with the Blake (1999) classification of lava domes for the purposes of this overview, based mainly on morphology.
Upheaved Plugs
Type of lava dome resulted from an eruption of lava with a higher yield strength compared with others lava formed from others dome and as resulted this is pushed like a piston. These pistons like extrusion often travel high above the surface and sometimes carry country rocks sediments with them (Sigurdsson et al., 2015; Harnett, 2019).
Pelean or spiny domes
Types of domes are commonly found associated with larger composite volcanoes. Similar to Tortas lava domes, these lavas domes have the steepest sided of all lava and a relatively smooth upper surface punctuated by a tall vertical spine which gives the domes an irregular appearance and frequently collapse causing talus slopes to frequently surrounded these domes (Sigurdsson et al., 2015; Harnett, 2019).
Coulées
Type of lava dome that is transition between lava dome and lava flow. The coulees erupt on steep slows that allows the lava to ooze slowly dome the slope. They do not flow very furthers that the eruption point, although in some cases they can travel over 10 km. As a neat feature of coulees, huge pressure ridges, known as Ogives, are often seen on the outer surface of the flow. They are usually thick and usually have a rhyolitic composition (Harnett, 2019).
Low lava dome
are rounded in shape due to less viscous magma.

Figure.7 The morphology of the Peleean domes depends on the mechanical properties of the talus material, whereas low and lava dome and couleé morphology depends on mechanical and rheological properties of the magma
Extrusion rate lava dome
Lava solidification relies on 2 processes, cooling and degassing. Both lead in rheological stiffness powered by degassing-induced crystallization. The rate of extrusion influences the texture of the extruded lava that varies considerably with temperature and pressure routes. The crystallization results in modifications in viscosity and threshold crystal content, magma develops non-Newtonian characteristics and strength. In addition, the pressure of volcanic flow and magma ascent rate is affected by the gas escape processing (Hale, 2008).
The lower extrusions rates promote gases loss and crystallization reaches a crystal content that leaves to the development of mechanical strength by locking. It is observed a transition experienced by the material from a viscous Newtonian to a non-Newtonian fluid with a Bingham-like yield strength. At higher extrusion rates, gas loss is reduced, and the volatile magma content is greater, causing a low viscosity magma. The variable characteristics of lava connected with variable extrusion rate and gas loss result in unique differences in the morphologies and development patterns of natural domes (Hale, 2008).
Lava flows: flow of magma produced during non-explosive effusive eruption, may be resulted because y slow ascent of H2)-rich magma accompanied by gas loss or more rapid rise of H2)-poor magma
Lava flow morphology:
The lava morphology of lava flow is resulted of the interaction between the lava and the surrounded environment in which emplaced. Furthermore, the morphology is determined by physical and chemical properties of the lava, its temperature and rate of effusions. The main parameter influencing the morphology of a lava flow is its non-Newtonian rheology, which causes the lava to rest on a slope, although unconfined by topography, as soon as the supply ceases. The second most important feature influencing the morphology Is the effusion rate.
The morphology of the solidified lava flow is divided in two categories: AA and Pahoehoe.
Aa is the type of lava flow that is characterized by rough, jagged, spinny and clinker surface. Contrarily, the pahoehoe lava have a smooth, billowy or ropy surface and normally comprises multiple flows lobes. sometimes the pahoehoe lava changes and become aa lava when moving downstream when flowing away from the vent, this phenomenon was observed in Hawaiian lavas, the explanation for this transition is deduced to the change in the cooling and increases in viscosity and vesicles shames. In addiction at Etna and Stromboli volcanoes, the aa lavas are the most common lava, however, becomes more wide spread later when eruptions effusion rate declines.
Pahoehoe
Pahoehoe is characterise by a smooth, glassy, coherent surface- sometimes with surface folds, termed ropes. A Pahoehoe flow field consists of toes which is thousands of individuals lobes. The topography surface is undulating termed “hummocky” by Swanson (1973) as shown in figure…. This type of lava is commonly associated with the very low effusion rate and advance rates. For example, in 1880-1881 pahoehoe flow field in 9 months advanced 48 km, in perspective 180 m per day. However, can also happen in fast rate, like in 1783 in Iceland where during the creation of Pahoehoe at the centres of fast moving channels and sheet flow.

Fig. 8 Drawing from Dana (1891) to illustrate ropes on pāhoehoe—flow direction is left to right. ((Harris et al., 2016)
An active pahoehoe lobe consists of a fluid core with a time-thickening exterior crust. New units of flow form from this crust’s fractures. These structures can be the clefts where two flow lobes are joined together or can be formed at the base of the flow front where the lobe front is pushed upwards or where the front flow breaks due to the pressure of the fragile ground crust.
Paheohoe Surfaces and Outcrops
Pahoehoe surface are typically glassy because of quenching of the surface in the first moments of exposure. Little bumps and mounds that makes the presence of a glass coated crystal are caused by the entrapment of phenocrysts and microphenocrysts in the glass. The glassy rind can be extremely fragile if vesicular, and often splits off within a few hours of the location or even during the location itself. This leaves a fragment detritus of thing, slightly curved, glassy flakes on the surface, typically a few cm in size. These results in the characteristic crunching sound made when walking on pahoehoe. Spalling is due to the contraction of the thin surface glass induced by cooling at the same moment of expansion of the fluid interior, proving sections of the glassy crust to pop off.
A pahoehoe lobe has a oval form in the perpendicular section to flow direction when see in a outcrop. The interior is vertical and increases in size but increased in number from surface to the interior. In thicker lobes, bubble may coalesce in the centre to form a large void as seen in Figure.
If enough gas accumulates in order to fully separate the upper and lower components of the lobe, this gap becomes a gas blister. Because pahoehoe goes to rest while it is still fluid, bubbles that have been deformed by shearing can recover their spherical shape before the lava solidifies. Therefore, vesicles are mainly spherical, except in and near the glassy crust where they are spread across the growing surface and frozen into the solidifying fluid rapidly.

Figure 9 : (A) Schematic of Walker (1989) showing “sequence of events leading to formation of broad central zone of late flowage and associated gas blister in . . . spongy pāhoehoe.” (Walker, 1989, p. 206). (B) Cross-sections of S- and P-type pāhoehoe from Wilmoth and Walker (1
Pahoehoe and aa may be part of the same flow, however, they are different in temperature, viscosity and vesicle shapes, with the most active pahoehoe flows being less viscous and eruption at higher temperature than aa flows and having vesicles normally as regular spheroids. The aa flows have a vesicle that to have an irregular shaped resulting of the deformation caused by movement during the final stages of solidification.
Moreover, pahoehoe and aa have different modalities of emplacement. Pahoehoe starts with a small lobe inflating to form wide and thick sheet flows several times greater than initial flow lobes. In contrast, aa lavas move as caterpillar producing an accumulation of clinkers in the front zone overrun by fluid lava, thus forming a sort of sandwich with clinkers above and below and fluid compact lava in between. This transition is caused by cooling and by increase in viscosity and yield strength during flowage Pahoehoe flows also expand intermittently, with alternating phases of lobes inflation and frontal expansion. As with pahoehoe, aa lava flows are prone to inflate, forming extensive and complex lava tubes, although this process is more difficult to detect than in pahoehoe flows. At Etna volcano, pulses during the expansion of aa lava flows generate characteristic surface morphologies, influence volume distribution 88 around the lava flow field, and construct the distal, medial and proximal channel segments

Figure 10- (A) shows a picture of a lava dome outcrop. (B) Shows a picture of a lava flow.
Lava flow extrusion rate
The lava extrusion rate has a critical impact on the duration and magnitude of lava flows and can provide insight into the volcanic reservoir and conduit size and depth. Variations in the rate of extrusion may indicate changes in the volcanic plumbing scheme or water supply rate at long-lived eruptions, and possibly an estimate of when decreasing eruptions may be completed. Over longer timescales, variations are thought to be caused by processes involving magma supply from the lower crust or mantle (Walker et al., 1973; Harris et al., 2007; Poland, 2014; Arnold et al., 2017).
Variations in the rate of lava extrusion were observed on time scales ranging from minutes to centuries. Generally, these fluctuations are resulted shallow processes involving magma supply to the surface through a conduit with physical properties that can vary with time. Various volcanoes erupt at continuous rates on average over years (0.1–2 m3 s −1), regardless of magma structure or tectonic setting, probably because this is the steady long-term supply rate of melting buoyantly growing through the crust. (Arnold et al., 2017).
Longer measuring periods tend to result in reduced average extrusion rates, as elevated instantaneous lava flux pulses are averaged by much reduced flux intervals or quiet intervals of no lava extrusion. It is expected the trend of decreasing time averaged discharge rate with observation time to plateau at increasingly longer observation , as the observed extruded lava converges on the long term magma supply rate, estimated to be 0.01–0.1 m 3 s −1 for most volcanoes from volcanic edifice construction rates measured over timescales of 10 4 years or longer (Arnold et al., 2017).
Magma or volatiles entering or leaving a surface magma reservoir will alter the stress in the reservoir, which may deform the surface of the floor. In an elastic crust, a volcanic eruption that drains a single magma reservoir, flowing through the conduit proportional to the reservoir pressure, will have an exponentially declining rate of extrusion and a deflation signal that also reduces exponentially over time. (Arnold et al., 2017).
Evolution of lava flows
Due to chemicals imbalance induced in magma as it approaches the surface from bellow, most of lavas are crystallizing on eruption. Solidification continues during effusion assisted by loss of heat to the ground and to the atmosphere. As a result, flows begin to form channels and tubes which concentrate motion along a small number of paths which allows lava to be transported efficiently from the vent, as shown in figure 13.
Initially, a flow forms a tube or a channel depending on whether or not a constant crust can form on the lava ground. A new lava surface chills to a powerful, solid crust within minutes when subjected to the atmosphere. Initially, a lava flow forms tube or a channel depending on whether or not a continuous crust can form on the lava surface. The fresh flow lava surface gets cold to a strong, solid crust within minutes when exposed to the atmosphere, nevertheless, at same time, the new crust is pulled forward breaks continually into fragments, making difficult form a stable roof, the flow develops an open channel for the containing lava. If the forward pull is too small, the continuous crust develop birth to a tube (Sigurdsson et al., 2015).
Furthermore, when disturbance dominates the front moves forward as a single unit, controlled by the interior characteristics. If the crust formation dominates, the front advances by oozing small tongues of lavas through localized punctures in the crust. The lava fronts are the slowest part of an advancing low whatever their style of motion, partly because of crystallization and partly because their cross-section regions are bigger than the active areas along feeding channels or tubes (Sigurdsson et al., 2015).
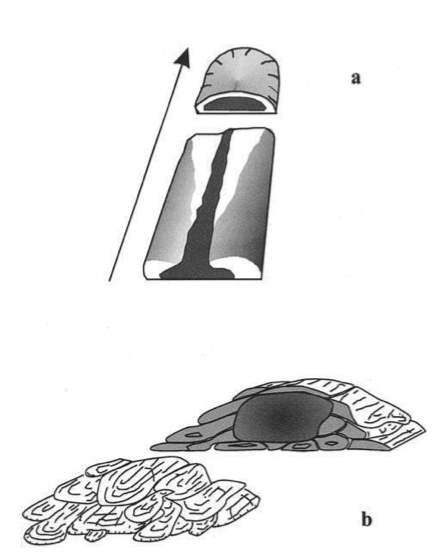
Figure 11- Major structures of flow. (a) Open channels (below) typically feed lava on easy fronts (above) in aa and blocky flows). Motion, in direction of arrow, is concentrated in the black zones. For major flows, the fronts are commonly 100 m wide and tens of meters thick. In long-lived eruptions, the channels may evolve into tubes. [After Lipman and Banks, 1987.] (b) The fronts of pahoehoe flows are normally a complex of intermingling tongues and toes (up to meters across and tens of meters long) fed by lava from a tube system (Sigurdsson et al., 2015).
Reference List
- Arnold, D., Biggs, J., Anderson, K., Vallejo Vargas, S., Wadge, G., Ebmeier, S., Naranjo, M. and Mothes, P. (2017). Decaying Lava Extrusion Rate at El Reventador Volcano, Ecuador, Measured Using High-Resolution Satellite Radar. Journal of Geophysical Research: Solid Earth, 122(12), pp.9966-9988.
- Bougault, H., Charlou, J., Fouquet, Y., Needham, H., Vaslet, N., Appriou, P., Baptiste, P., Rona, P., Dmitriev, L. and Silantiev, S. (1993). Fast and slow spreading ridges: Structure and hydrothermal activity, ultramafic topographic highs, and CH4output. Journal of Geophysical Research, 98(B6), p.9643.
- Calvari, S. (2019). Understanding Lava Flow Morphologies and Structures for Hazard Assessment. Annals of Geophysics, 61(Vol 61 (2018).
- Cashman, K., Sparks, R. and Blundy, J. (2017). Vertically extensive and unstable magmatic systems: A unified view of igneous processes. Science, 355(6331), p.eaag3055.
- Decaying Lava Extrusion Rate at El Reventador Volcano, Ecuador, Measured Using High-Resolution Satellite Radar. Journal of Geophysical Research: Solid Earth, 122(12), pp.9966-9988.
- Hale, A. (2008). Lava dome growth and evolution with an independently deformable talus. Geophysical Journal International, 174(1), pp.391-417.
- Harnett, C. (2019). Understanding the mechanics of lava dome collapse. Master. The University of Leeds School of Earth and Environment.
- Harris, A. J. L., J. Dehn, and S. Calvari (2007), Lava effusion rate definition and mea-surement: a review, Bull. Volcanol., 70(1), 1–22, doi:10.1007/s00445-007-0120-y.
- Harris, A., Rowland, S., Villeneuve, N. and Thordarson, T. (2016). Pāhoehoe, ‘a‘ā, and block lava: an illustrated history of the nomenclature. Bulletin of Volcanology, 79(1).
- Herron, T., Stoffa, P. and Buhl, P. (1980). Magma chamber and mantle reflections – East Pacific Rise. Geophysical Research Letters, 7(11), pp.989-992.
- Kearey, P., Klepeis, K. and Vine, F. (2009). Global tectonics. Chichester, West Sussex: Wiley-Blackwell.
- Kelley, D., Baross, J. and Delaney, J. (2002). Volcanoes, Fluids, and Life at Mid-Ocean Ridge Spreading Centers. Annual Review of Earth and Planetary Sciences, 30(1), pp.385-491.
- Macdonald, K. (1982). Mid-Ocean Ridges: Fine Scale Tectonic, Volcanic and Hydrothermal Processes Within the Plate Boundary Zone. Annual Review of Earth and Planetary Sciences, 10(1), pp.155-190.
- Mutter, J. and Karson, J. (1992). Structural Processes at Slow-Spreading Ridges. Science, 257(5070), pp.627-634.
- Mutter, J. and Karson, J. (1992). Structural Processes at Slow-Spreading Ridges. Science, 257(5070), pp.627-634.
- Püthe, C. and Gerya, T. (2014). Dependence of mid-ocean ridge morphology on spreading rate in numerical 3-D models. Gondwana Research, 25(1), pp.270-283.
- Rona, P., Boström, K., Laubier, L. and Smith, K. (2013). Hydrothermal Processes at Seafloor Spreading Centers. New York, NY: Springer, pp.27-51.
- Sigurdsson, H., Houghton, B., McNutt, S., Rymer, H. and Stix, J. (2015). The encyclopedia of volcanoes. 2nd ed. Elsevier.
- Steele, J., Thorpe, S. and Turekian, K. (2008). Encyclopedia of ocean sciences. 2nd ed. Elsevier.
- Volcano.oregonstate.edu. (2019). Fast: 10-20 cm/yr. | Volcano World | Oregon State University. [online] Available at: http://volcano.oregonstate.edu/fast-10-20-cmyr [Accessed 30 Jul. 2019].
- Volcano.oregonstate.edu. (2019). Slow: 1-5 cm/yr | Volcano World | Oregon State University. [online] Available at: http://volcano.oregonstate.edu/slow-1-5-cmyr [Accessed 30 Jul. 2019].
- Walker, G. P. L., A. T. Huntingdon, A. T. Sanders, and J. L. Dinsdale (1973), Lengths of Lava Flows [and Discussion], Philos. Trans. R. Soc. A Math. Phys. Eng. Sci., 274(1238), 107–118, doi:10.1098/rsta.1973.0030.
Cite This Work
To export a reference to this article please select a referencing stye below:
Related Services
View all


DMCA / Removal Request
If you are the original writer of this essay and no longer wish to have your work published on UKEssays.com then please click the following link to email our support team:
Request essay removal