Relationship Between Roadkill and Transport Systems in Tasmania
| ✅ Paper Type: Free Essay | ✅ Subject: Geography |
| ✅ Wordcount: 3308 words | ✅ Published: 18 May 2020 |

Relationship Between Roadkill and Transport Systems in Tasmania
Introduction
Introduction and Identification of the problem
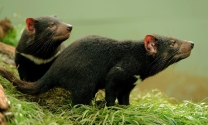
Tasmania is a state-island located south-east of Australia just 250 km from the mainland. It is a beautiful island with amazing biodiversity, several unique species of flora and fauna and also boasts a cluster of 330 islands around it. This is what makes Tasmania a special place for Tourists and locals alike to live in or visit Tasmania. The Tasmanian devil is one of the fauna species that is well known around the world and is only found in Tasmania (reference). In the same way, Tasmania is known as the roadkill capital of the world (ABC, 2015) as it has the highest rate of animal deaths per kilometre than anywhere else in the world. (Reference)
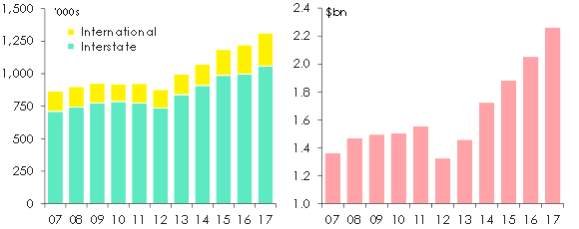
Figure 1: Tourists coming to Tasmania and amount spent in Tasmania by tourists (Eslake, 2017).
It is estimated about 293,000 road kills take place a year in Tasmania which is an astounding number (Roadkill 2018) which is spread across the road networks of Tasmania which covers approximately 24,000 kms. The animals that are nocturnal are the ones that are most affect by roadkill due to several reasons mainly the visibility, over speeding issues, hunting on the side of the road and on the road for food (Roadkill 2018).
The concept of roadkill and its relation to the environment has been implicit since the establishment of motor vehicles and modern road networks (Braunstein M., 1998). But despite this, there has been a minimal study of roadkill. As stated by Kioko et al (2015), the understanding of road networks on wildlife is limited. For this reason, the available literature is recent, limited, and focuses exclusively on specific areas such as the Limpopo province in South Africa (Collinson et al., 2014) and the Arusha Highway in northern Tanzania (Kioko et al, 2015). The definition of roadkill is when an on the road encounter takes place between a wildlife species and a moving vehicle that is sufficient to cause death in most cases.
Roadkill is a result of the building of infrastructure in the habitats and ecosystems of wildlife. This creates an intrusion into their way of life and movement. It creates a barrier in the path of migration and introduces something new into their environment. This relationship has been an unfortunate positive correlation between the construction of modern road network in wildlife habitat and their deaths (Braunstein M., 1998). Roadkill is a threat to biodiversity and the dynamics of an ecosystem causing stress in the species and destroying their social circles leading to the species being threatened (Kioko et al 2015).
This is an issue that must be dealt with if not there would be negative repercussions, for example a decrease in the numbers of Tasmanian devils, a species which are already endangered. They are in the top 3 most hit species in Tasmania. (Hobday, 2008). And for other species it might mean a total wipeout for example the eastern quolls got completely eradicated from certain areas such as the Cradle Mountain Road (Jones, 2000). Magnus, 2004 also states that the carcasses have a negative impact on the tourism industry as it is not an enjoyable sight to see it making it unaesthetic while also creating a moral dilemma. These encounters of roadkill incidents decrease the enjoyment of the tourists on their holidays. The smell aspect of it as well as the visual aspect is confronting to look at which hinders the enjoyment and quality of their holiday (Magnus et al, 2004). They also become distractions and their presence make the roads a bit more dangerous for the drivers. A documented significant impact on the tourism industry is a reduction of hire car availability over the summer (Magnus et al, 2004).
Overview of approaches found within the literature
Though with limited literature available a few observations can be made from the roadkill studies that shows us that night time driving, low/limited visibility of drivers, speeding in areas of wildlife and not sticking below the road speed limit, urban infrastructure and areas of primary economic activities, such as forestry or mining in areas with wildlife, paved roads and highways attracting the animals and also increasing number cars on the road (Hobday, 2008). It has been found that most Tasmanian mammals are nocturnal, and the rate of roadkill is higher for nocturnal species in Tasmania compared to diurnal mammals (Braunstein, 1998).
The government of Tasmania and conservation group efforts have been trying to reduce the roadkill. They are doing this by policies, information availabilities, road signs, speed limits, maps indicating hotspots where people need to take extra caution, and even drivers getting open data and statistics on the issue (Hobday, 2008). Magnus, 2004 also shows us that more caution was taken when driving by reducing the speed, control points for speed, encouragement to use better lights for increased visibility, and better road signage. There is also a 24/7 hotline for reporting and rescuing of roadkill incidents and victims. Even orphaned wildlife can be reported for assistance (Roadkills,2018). There are other ideas and proposals for reducing the roadkill numbers in Tasmania, some of which are even focused on behaviours of the animals such as construction of overpasses/underpasses and shelters to change their movement behaviour (Parks, 2006).
This is an issue that will have repercussions on the quality of human experience, Tasmanian economy and the tourism industry of Tasmania that depends heavily on its biodiversity and wildlife species. Magnus, 2004 has stated that 75% of tourists hire a car and drive themselves around and the issue of roadkill puts the driver’s safety at risk, which could also result into human fatality or injury, if not damaging their experience and their cars (Magnus et al, 2004).
Aims and objectives of this Project
We will be representing the issue of roadkill spatially by showing the relationship between roadkill incidence and the roads of Tasmania. With the knowledge we have accessed from the literature review above we can conclude that most of the roadkill incidence happen in areas with high population density, where highways and roads go through the habitats of the wildlife in Tasmania, areas with high concentration of vehicles and areas of primary economic activities and residential businesses.
Tasmanian Parks and wildlife services is proud protector of 3.4 million hectares of reserves, recreational parks and areas, forests, conservation areas as 51% of Tasmanian state area is classified under World Heritage site. It is a celebration of Natural wonders in this part of the world. Hence why we won’t be focusing on this area of the Tasmanian state for roadkill and focus mainly where there is a lot of activity on the road within the highways and main roads of Tasmania.
Our aim in this project is to use the ESRIś Arc GIS software to display available statistical data spatially using several geoprocessing tools to generate the required outcome. We will be mapping the points of incidence of roadkill on the main roads, highways and roads of Tasmania on a map of Tasmania. They will show the relationship between the roadkill incidence points to population density, economical and tourist activity. In a hope that the outcome can be used to further plan better ways to prevent roadkill and also gives the population and the government of Tasmania a better idea of what areas action needs to be taken.
Materials and Methods
Study Area
Located in southeast of Australian mainland, Tasmania will be the focus of our study and we will be only studying the mainland with the highest economic activity and urban development. There are 330 islands that comprise of Tasmania but most of them are uninhabited, and the ones have been inhabited have very small population, so the infrastructure doesn’t harm the wildlife around the island. Unlike most of the island the main Island possess the population and the economic activities requiring the infrastructure and roads for roadkill to occur. We will particularly focus on the main areas where the roadkill takes place in high numbers due to the following reasons:
1) The three most populous cities/towns being Hobart, Launceston and Devonport.
2) National Highways and roads
3) Areas of Primary activities established mainly in North and East of Tasmanian Main Island.
The other islands that are also big and have about 800 to 1600 inhabitants but they mainly rely on fishing activities and have not built major infrastructure which can cause roadkill. We will not be pursuing these areas as there is no considerable harm to the wildlife here due to roadkill.
Data Handling
The data for this project has been taken from several websites and data bases. The following are the data and their sources used in this project.
From the Australian Urban Infrastructure network (AURIN), we have used the following data:
– Population and Statistics Geopackage, Population Census 2016
– Population and Statistics Geopackage, Number of motor Vehicles
From ArcGIS, we have used the following data:
– Road Network, Tasmanian Road Network
From the Australian Bureau of Statistics (ABS), we have collected the following data:
– Urban Centres and localities, Study area Tasmania Shape
– City Statistical Areas – Statistical area level 2
– Urban Centres and localities, Tasmanian towns and cities
– Tasmania Mesh Block, smallest geographical area data
The data that shows the statistics of the roadkill was the source the co-ordinates for the roadkill taken from Hobday and Ministrell (2018) a study which recorded 3 years of roadkill data.
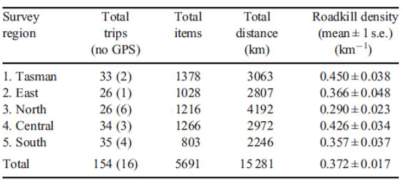
Figure 2: Tabulated results of the survey effort by Hobday and Minstrell 2018 (Roadkills, 2018).
Analytic Approach:
Following analyse tools were used for this study.
– Spatial Statistics – Calculate Area
– Spatial Adjust – Slope, Reclassify
– Analysis – Clip, Identify Overlay
– Data Management – Join, Raster, Raster Processing
– Conversion – From GPS, Feature to Raster, To Shapefile
The procedure followed to get the output:
– Get data discussed above from ABS and AURIN and Arc GIS into a folder and into ArcMAP.
– Get the world road network from ESRI
– Set a new geodatabase and make it the default.gdb
– Create a Tasmanian state layer
– Then generate the data and its management.
– Set the project and processing extents
– Change feature to raster
– Property data management
– Finally defining quantities in layers.
– Then change to the map layer to presentation layer
– Create the map and export it.
Results
Presentation of Findings
It is clear from the maps created that the areas with higher population density, motor vehicle concentration and production activities have a higher incidence of Roadkill as seen in the maps below.
MAP 1: Shows the population density and its relation to roadkill

MAP 2: Production activities and its relation to roadkill

MAP 3: Concentration of Motor vehicles and its relation to roadkill

Discussion
Results Interpretation:
We can see from the maps obtained that there is a direct correlation to a higher population density, motor vehicle concentration and Production activities to roadkill. The three maps obtained are of the population density of Tasmania, motor vehicle concentration which follows the population density as higher the population the higher the motor vehicles. The population density was measured from the 2016 ABS data of number of people living in the given areas. The motor vehicle shows the number of vehicles per dwelling and the production areas show the areas of activity in Tasmania.
The main areas that has some of the highest concentrations of roadkill are the major towns with higher populations and production activities, namely, Launceston, Hobart and Devonport. The National Road connects these three major hubs of Tasmania, from the top in Davenport into Launceston and down into Hobart. This highway is highly prone to roadkill due to the amount of business activity and population there is a demand from transport between these major hubs and for tourism that also takes place on the same roads. Devonport is the strategically placed for water transport and is a major port from where goods are transported to inland areas and other towns creating incidents on the road. This route is where the highest incident occur as it passes through the major hubs mentioned.
Though the roadkills data shown is on 5 routes being:
– The National Road Route 1
– Route A4
– Route A10
– Route A6
– Route A9
The National Road Route 1 has the most concentration of roadkill and the other routes mentioned have minor abundance of roadkill in comparison to major hubs connected by National Route 1. And the other Tasmanian Road Network are categorised in category B and C as the frequency of roadkill are much less on these routes but still shown on the maps. The roadkill density points show on the map indicate the concentration of roadkill for every 1 km or 0.5 km as shown in the legend. In the West of Tasmania due to lower population and limited number of motor vehicle numbers the area has low or no concentrations of roadkill, same applies for the surrounding islands as well.
Comparison with what has been found
To compare this to other studies similar to this is not easy as it is not a highly researched area. But over all it is the results are very similar to a few studies such as Hobday states that the more population and infrastructure growth the more roadkill is probable to occur. But the specific factors studied in the particular region show similar results to articles and statistics published by the ABS, Roadkill Tasmania (Roadkill, 2018) and other online articles on roadkill.
We have only used the population, production and motor vehicle concentration to determine the map, whereas other factors such as road speed etc have been omitted at this point in time as it wasn’t viable due to the data available. The Northeast of Tasmania also has a considerable amount of roadkill (Hobday, 2008) though there isn’t a great amount of motor vehicle concentration but it is due to activity such as mining, tourism and wood harvesting.
Limitations
This project was done is a short period of time which makes it not viable to gather all data sources and also generate new data sources to aid the results. There also isn’t a whole lot of information available on the topic as it is not researched academically to a good extent, especially roadkill in Tasmania. The data available is older than 5 years which decreases its eligibility in the current system. There are series of factors that can change such as population, concentration of cars, production areas, number of tourists, roadkill incidents, economical activities etc. There is no particular body of government or private sector paying enough focus on this issue.
They were no data readily found on the population of the wildlife in Tasmania and how it is changing. Also, considering Tasmania is the least populated state of Australia not enough resources are invested into updating information and collecting the information which is required to create and analyse better maps.
It would also have been great to compare it to several other studies done on other towns areas with roadkill issue which just doesn’t exist readily. There are 3 that were found from Africa and a few others but nothing that has been researched thoroughly with maps. More research needs to be done is this field and also the issue of roadkill needs to be taken a bit more seriously as it is hazardous to human beings and animals alike.
Conclusion
We can clearly see from the graphs produced that roadkill is an issue caused when human hubs start occurring in paths of wildlife habitats and movement paths. The higher population, motor vehicle concentration and primary production activities all have a direct negative impact on roadkill as they increase the so does the number of animals killed on the roads. The aim of this spatial representation was to represent the roadkill concentration spots in relation to the roads, human population and economic activities. The hypothesis is confirmed by the findings that the denser population and increased economic activities areas have higher toll on roadkill.
This is also a field that can be further researched as it is beneficial both to humans and wildlife alike by making the roads safer for both species and it could also help improve the economic state of the Tasmania by increasing the tourism sector and improving the environmental health.
References
- ABC, 2015, Welcome to Tasmanaia [ONLINE], Available at < http://www.abc.net.au/radionational/programs/offtrack/tasmania-roadkill-capital-of-the-world/7021816>
- Braunstein M., 1998. Roadkill: driving animals to their graves. Animal Issues Vol 29(3), pp 22–28.
- Collison, W et al., 2014, Wildlife road traffic accidents: a standardized protocol for counting flattened fauna. Ecology and Evolution Vol 4 (15), pp. 3061-3071.
- Department of State Growth (2017) Retrieved from <https://www.stategrowth.tas.gov.au/>
- Department of Transport (2017) Retrieved from <https://www.transport.tas.gov.au/>
- Department of Treasury and Finance (2017) Retrived from www.treasury.tas.gov.au/
- Eslake, S., 2017. The Tasmania Report 2017. Tasmanian Chamber of Commerce and Industry. University of Tasmania, Hobart.
- Hobday, AJ & Minstrell, ML 2008a, Distribution and abundance of roadkill on Tasmanian highways: Human management options. Wildlife Research Vol 35, pp. 712-726.
- Jones, M. 2000. Road upgrade, road mortality and remedial measures: Impact on a population of eastern quolls and Tasmanian devils. Wildlife Research Vol 27 (1) pp 289-296.
- Kioko, J et al., 2015, Wildlife roadkill patterns on a major highway in northern Tanzania. African Zoology, Vol 1 (6).
- Magnus, Z et al., 2004, Reducing the incidence of wildlife roadkill: improving the visitor experience in Tasmania. CRC Sustainable Tourism, Launceston.
- Roadkills , 2018. Tasmania Roadkill Statistics [ONLINE], Available at http://roadkill.imaginocean.com.au/index-build.html
- Schwartz, A et al (2018) Roadkill scavenging behaviour in urban environment. Journal of Urban Ecology Vol 10 (1093) pp, 1-7
- Transport (n.d.), Proposal Report Injured Animals. Department of State Growth, Hobart.
- Zander, K., Ainswort, G.et al (2014) Threatens Bird Valuation in Australia. PLos One Vol 9 (6)
MAPS

Map 1: Correlation between Population density and roadkill

Map 2: Economic Primary Production activities correlation with roadkill
Cite This Work
To export a reference to this article please select a referencing stye below:
Related Services
View all


DMCA / Removal Request
If you are the original writer of this essay and no longer wish to have your work published on UKEssays.com then please click the following link to email our support team:
Request essay removal