Developments in Public Interest Towards Plastic Pollution
| ✅ Paper Type: Free Essay | ✅ Subject: Environmental Studies |
| ✅ Wordcount: 2022 words | ✅ Published: 23 Sep 2019 |
How public interest towards Plastic Pollution changed through time: a Google Trends data analysis
Abstract
Plastic pollution is a very hot topic. Many documentaries and media are starting to communicate the problem to the public. But has the public an increasing interest in it? We analysed worldwide data from Google searches in a 15-years span. We looked at how the volume of search (VOS) for three plastic pollution-related words changed through time. These words were searched significantly more, and we modelled these changes. With these results, our research highlights the growing interest towards plastic pollution which is extremely important to define new researches and policies.
Introduction
Public interest is very important to drive conservation success (1). But how can we measure public interest on environmental issues? Scientists used surveys before the age of the Internet and Big Data. Nowadays, the volume of internet searches operated by search engines can be a good proxy of people interest. Google is the main search engine in the world, it powers 74% of the searches worldwide(2). Google Inc. owns Google Trends (trends.google.com) a public tool to measure people interests. It has a website where we can look-up how frequently a word was searched in a specific time window and in different geographic areas. It is possible to download the data as .csv files. The data are also available in R environment, using the package ‘gtrendsR’ (3).
Google Trends data have been used in different fields, such as epidemiology (4)(5) and economy(6). Recently, Nghiem et al. (7), analysed the suitability of Google Trends data to measure the interest in conservation topics. The terms considered in Nghiem et al. study didn’t include the problem of plastic pollution.
Plastic Pollution is a very hot topic. Eriksen et al. (8) estimated 5.25 trillion plastic particles, weighing 268,940 tons float in our oceans. We have the general idea that there was an increase in the interest of the media toward this problem. The Pacific Garbage Patch was sampled in the summer of 2009, the documentary “A plastic Ocean” was released in 2013, David Attenborough’s “Blue Planet” season finale on December 2017 was focused on plastic pollution, on October 2018 the Ocean Cleanup started using the System 001 to clean the Great Pacific Patch. Meanwhile more and more social media profiles on Zero Waste lifestyle were born. We want to test if there was a statistical increase in the VOS for plastic pollution related terms. This increase will be considered a measure of public interest. As highlighted by Phillis et al. (1) public interest is a very important element to drive policies and scientific research. An increase in people’s interest is a good sign towards the resolution of a big problem, as is plastic pollution.
Methods
We selected three keywords to understand the interest of people in plastic pollution-related topics: plastic pollution, garbage patch, and zero waste. These short terms are specific and generally not confused with other popular not plastic pollution-related search keywords (e.g. the single word plastic has many different contexts such as plastic surgery or as property of a material). To extract the data from Google Trends we used the R package ‘gtrendsR’(3). We used the VOS for these terms in monthly intervals from January 2004 to February 2019 with a total of 182 data points (n=182) for each keyword. The VOS on Google Trends is expressed as a number from 1 to 100, where 100 is the peak popularity for the term and a value of 0 means that there was not enough data. These values are always related to the term itself and a comparison between one or more term would not be meaningful for our purpose. Moreover, these values are not given as a measure in relation to the absolute total volume of researches. To overcome these problems, we corrected the research value with two benchmark terms. According to Malcevschi et al.(9) and to Nghiem et al.(7) we selected life and love as benchmarks. These words have a constant trend. We then divided the VOS for the plastic pollution-related terms by the VOS of life and love to have corrected values. To analyse and manipulate data we used R version 3.5.0. We analysed the distribution of the benchmark-corrected VOSs. None of them was normally distributed. Plastic pollution and zero waste have a right skewed distribution, while garbage patch has a distribution with two peaks. We first ran a seasonal Mann-Kendall test from the R package ‘Kendall’(10) following Nghiem et al.(7). This is a non-parametric test that gives you a (tau) value, a positive value means an upward trend. In the case of positive trends, we performed generalised linear models with quasipoisson family to quantify the monthly amount of change in volumes of search. We use the VOSs corrected by the benchmark terms as response variable. The date was our explanatory variable.
Results
The seasonal Mann-Kendal test returns all significant positive values for all the benchmark-corrected words (table1). This means that we have positive trends for all three words.
|
Word |
love |
life |
|
plastic pollution |
0.387 (<0.05) |
0.562 (<0.05) |
|
garbage patch |
0.371 (<0.05) |
0.403 (<0.05) |
|
zero waste |
0.618 (<0.05) |
0.779 (<0.05) |
Table 1. Mann-Kendall’s statistic (and 2-sided p-value in brackets for different plastic pollution related words and different benchmark terms).
The models gave us significant values for intercept and slope (table 2). The effect size is bigger in zero waste and plastic pollution than in garbage patch. One increase in date corresponds to a 0.0377-0.0467% increase in VOS for plastic pollution, 0.0212-0.0247% increase for garbage patch and 0.0426-0.0506% increase for zero waste. Table 2 summarizes effect sizes and parameters estimates.
|
Word |
Benchmark |
Variable |
Estimates |
Precision (SE) |
Effect size |
|
plastic pollution |
love |
Intercept (VOS) |
-7.7378 |
2.0865 |
1.000377 |
|
Date |
0.000378 |
0.000129 |
|||
|
life |
Intercept (VOS) |
-9.0663 |
2.0763 |
1.000467 |
|
|
Date |
0.000467 |
0.000127 |
|||
|
garbage patch |
love |
Intercept (VOS) |
-4.3300 |
1.2830 |
1.000212 |
|
Date |
0.000212 |
0.0000813 |
|||
|
life |
Intercept (VOS) |
-4.7639 |
1.2270 |
1.000247 |
|
|
Date |
0.000247 |
0.000077 |
|||
|
zero waste |
love |
Intercept (VOS) |
-8.0198 |
1.6707 |
1.000426 |
|
Date |
0.000426 |
0.000103 |
|||
|
life |
Intercept (VOS) |
-9.1711 |
1.6437 |
1.000506 |
|
|
Date |
0.000506 |
0.0001 |
Table 2.Parameters estimates, SEs and Effect Sizes from each models for each words and benchmark term. For every increase in day the value of the VOS is the effect size value times the VOS value of the previous day.
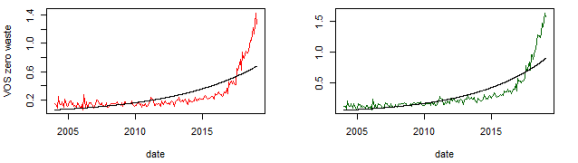
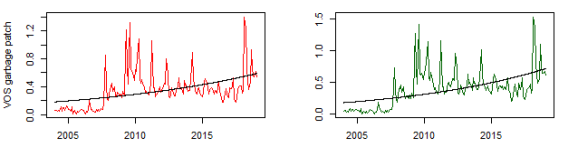
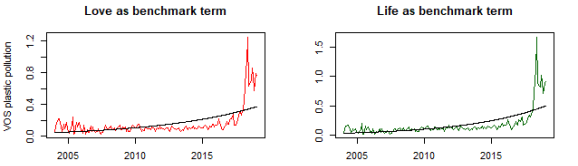
Figure 1. Plots of research volumes of plastic pollution, garbage patch and zero waste for each benchmark term. The volume of research is plotted by date. The black lines represent the models.
Discussion
Different studies have found negative trends in the public interest towards environmental issues (11), while others have shown the opposite (7). Our results show an increasing trend in the public interest in plastic pollution. Though, it is not easy to quantify the amount of increase. The VOSs present a not normal distribution. This is due to many stochastic events that are very difficult to take into consideration. The distribution is influenced by human psychological dynamics, events and how these are communicated by news and media. For example, garbage patch has many peaks. Two correspond (Summer 2009) to an expedition on the pacific garbage patch. Plastic pollution has some picks in April, May and June 2018, this might be because in June 2018 National Geographic published an issued dedicated to plastic pollution. It is hard to understand the reasons of peaks and it needs more accurate research.
Many might argue that Google is not widespread enough to perform such analyses worldwide. Malcevschi et al. (9) analysed both Google and Yahoo! data. They found similar trends despite difference in the number of users. Thus, we assume that Google Trends reflects the other search engine trends as well.
This research has an English-centred approach. For a more detailed picture we should analyse the same words in different languages (9). Different languages and cultures might have different concerns and outputs (7). Moreover, to be sure of the actual increase in interest we should analyse more keywords, for example plastic waste, plastic free and pacific garbage.
The results for the three chosen words show positive trends in the whole 15 years period. The VOSs fluctuate due to reasons difficult to model, but the Mann-Kendall test is a clear evidence of the positive trends. As suggested in another study (1), the increase in public interest towards environmental problems is a good factor to drive scientific research and policies. The Plastic Pollution crisis needs more scientific research and more governments legislations, our research suggests that we have the increasing public interest to achieve these objectives.
References
1. Phillis CC, Regan SMO, Green SJ, Bruce JEB, Anderson SC, Linton JN, et al. Multiple pathways to conservation success. 2013;6:98–106.
2. Net MarketShare [Internet]. 2019. Available from: https://netmarketshare.com
3. Massicotte Philippe and Eddelbuettel Dirk. gtrendsR: Perform and Display Google Trends Queries [Internet]. 2018. Available from: https://cran.r-project.org/package=gtrendsR
4. Ginsberg J, Mohebbi MH, Patel RS, Brammer L, Smolinski MS, Brilliant L. Detecting influenza epidemics using search engine query data. Nature [Internet]. 2009;457(7232):1012–4. Available from: http://dx.doi.org/10.1038/nature07634
5. Wang J, Zhang T, Lu Y, Zhou G, Chen Q, Niu B. Vesicular stomatitis forecasting based on Google Trends. 2018;1–16.
6. Choi H, Varian HAL. Predicting the Present with Google Trends. 2012;88:2–9.
7. Nghiem LTP, Papworth SK, Lim FKS, Carrasco LR. Analysis of the Capacity of Google Trends to Measure Interest in Conservation Topics and the Role of Online News. 2016;1–12.
8. Eriksen M, Lebreton LCM, Carson HS, Thiel M, Moore CJ, Borerro JC, et al. Plastic Pollution in the World ’ s Oceans : More than 5 Trillion Plastic Pieces Weighing over 250 , 000 Tons Afloat at Sea. 2014;1–15.
9. Malcevschi S, Marchini A, Savini D, Facchinetti T. Opportunities for Web-Based Indicators in Environmental Sciences. 2012;7(8).
10. A.I. McLeod. Kendall: Kendall rank correlation and Mann-Kendall trend test [Internet]. 2011. Available from: https://cran.r-project.org/package=Kendall
11. Funk SM, Rusowsky D. analysing internet search data as a proxy for public interest toward the environment. 2014;3101–12.
What I have learnt during the last two weeks.
These two weeks of miniproject where very helpful to understand my interests and to give me the confidence that I needed to work with R. It was also a chance to exercise my writing skills in a deeper way.
It took me a very long time to decide what to work on. I could not find a topic I was passionate about. I looked at many different topics and started to play with datasets. I have learnt how to generate a word cloud and I assembled and disassembled datasets before understanding that they weren’t my cup of tea. Luckily, I have started doing that very soon. This was not a waste of time as I learned something new and on my own, which gave me more confidence in myself. Now I know that I am able to find the tools to tackle problems in R, but I also know that sometimes it might take time, so it is better to act sooner than later.
I had moments when it was difficult to understand my results. I think the best way to deal with that is, first of all, to take a break. Sometimes my brain is just tired and needs time to cool down doing completely different things. It happens, that in a moment of break the correct understanding came to me without actively thinking. Secondly, I think it is important to ask for help from colleagues or people that can support you (for example your supervisor). External eyes might see different shades of your data, which is very helpful.
At the start of this master I realised my critical thinking skills were not as good as I thought, and this project really helped me practise them. Even talking with my colleagues or helpers is good practice for critical thinking. Debating and explaining my project was a good process to find limitations and answer critiques and problems.
From writing the miniproject report I finally understand why it is better to start writing as soon as possible. This really helped me in managing my time better. I had time to revisit my writing after a while with a clearer mind. Starting to write sooner also helps to feel less pressure.
I am happy of the past two weeks and really enjoyed this kind of work. I feel more confident on what I have learnt in the last months. I improved the skill of looking for answers on my own, but also to ask for help and confrontation. Other people might be a good source for help.
Cite This Work
To export a reference to this article please select a referencing stye below:
Related Services
View all


DMCA / Removal Request
If you are the original writer of this essay and no longer wish to have your work published on UKEssays.com then please click the following link to email our support team:
Request essay removal