Effect of Light Exposure on a Plants Stomata Mechanism
| ✅ Paper Type: Free Essay | ✅ Subject: Environmental Sciences |
| ✅ Wordcount: 2275 words | ✅ Published: 23 Sep 2019 |
The Effect of Light Exposure on a Plants Stomata Mechanism
ABSTRACT
The experiment focused on measuring the rate of transpiration with reference to the following variables, normal light conditions, continuous light conditions, no light conditions, and half-light / half-dark conditions. The plant subjects were in each controlled environment for 24 hours prior to completing each experiment, and then the transpiration tests were performed. The variables tested concluded continuous light produced the greatest extended stimulation of the stomata; the normal light produced the most consistent with gradual digression stimulation of the stomata; and the no light and half-light/half-dark produced minimal stimulation of the stomata. The continuous light proved the most stimulation, but stressed the plant and exhibited the greatest decrease of transpiration, the normal light proved to be the most consistent display of transpiration with a more controlled rate of digression, and the no light and half-light/half-dark showed minimal rates of transpiration.
INTRODUCTION
Plant transpiration refers to evaporation from plant tissue (Kubota, 2016), specifically while the stomata are open for the passage of Co2 and O2 during photosynthesis. (Transpiration, 2011) Stomata are microscopic pores found on the epidermis of plants. Though most stomata are found on leaves, they can be found on all aboveground parts of a plant. These pores allow the exchange of gases between the outside environment and the air canals within a plant. These pores play a critical role in the process of photosynthesis, and can open and close as a response to environmental conditions. (Maximum, 2018)
Plant transpiration is, more or less, an invisible process. (Perlman, 2016) The process of plant transpiration is affected by Light, Temperature, Humidity, Wind, and Soil Water. The listed variable will affect the transpiration cohesively and independently:
The more light the more transpiration; Warmer temperatures will increase transpiration; Humidity effects the rate of diffusion; Dryer air increases transpiration; Increased wind dries surrounding air which increases transpiration; Water loss increases transpiration. Extended water loss will cripple transpiration process causing the plant to wilt. (Transpiration, 2011; Transpiration, 2018)
Within this experiment, the transpiration through different light exposure variables will be measured. If the tested plant species is exposed to more light under a controlled level of moisture, then the plant species transpiration level will increase due to the result of the light stimulating the opening of the plants stomata mechanism. The following light exposure variables will be tested, Constant Light (light source will be shined through filter to keep heat from light effecting plant moisture), No Light (After 24 hours of no light, the transpiration will be measured), Half-Light/Half-Dark (After 24 hours of half-light and half-dark exposure, the transpiration will be measured), and normal light from natural environment by window. The goal of this experiment is to determine what the plant’s preferred environment consists of regarding light exposure. The more inclusive methodology would also include different light color filters throughout the light exposure variables to determine if color of light exposure also had an effect on the plant transpiration. Additionally, it is very important to keep the controls across the experiment to reflect the most dependable results of plant transpiration.
METHODS
The experiment took three days to complete to measure plant transpiration. The materials accounted for and the environments of normal light, continuous light, no light, and half-light/half dark were established and maintained for a 24 hour time frame.
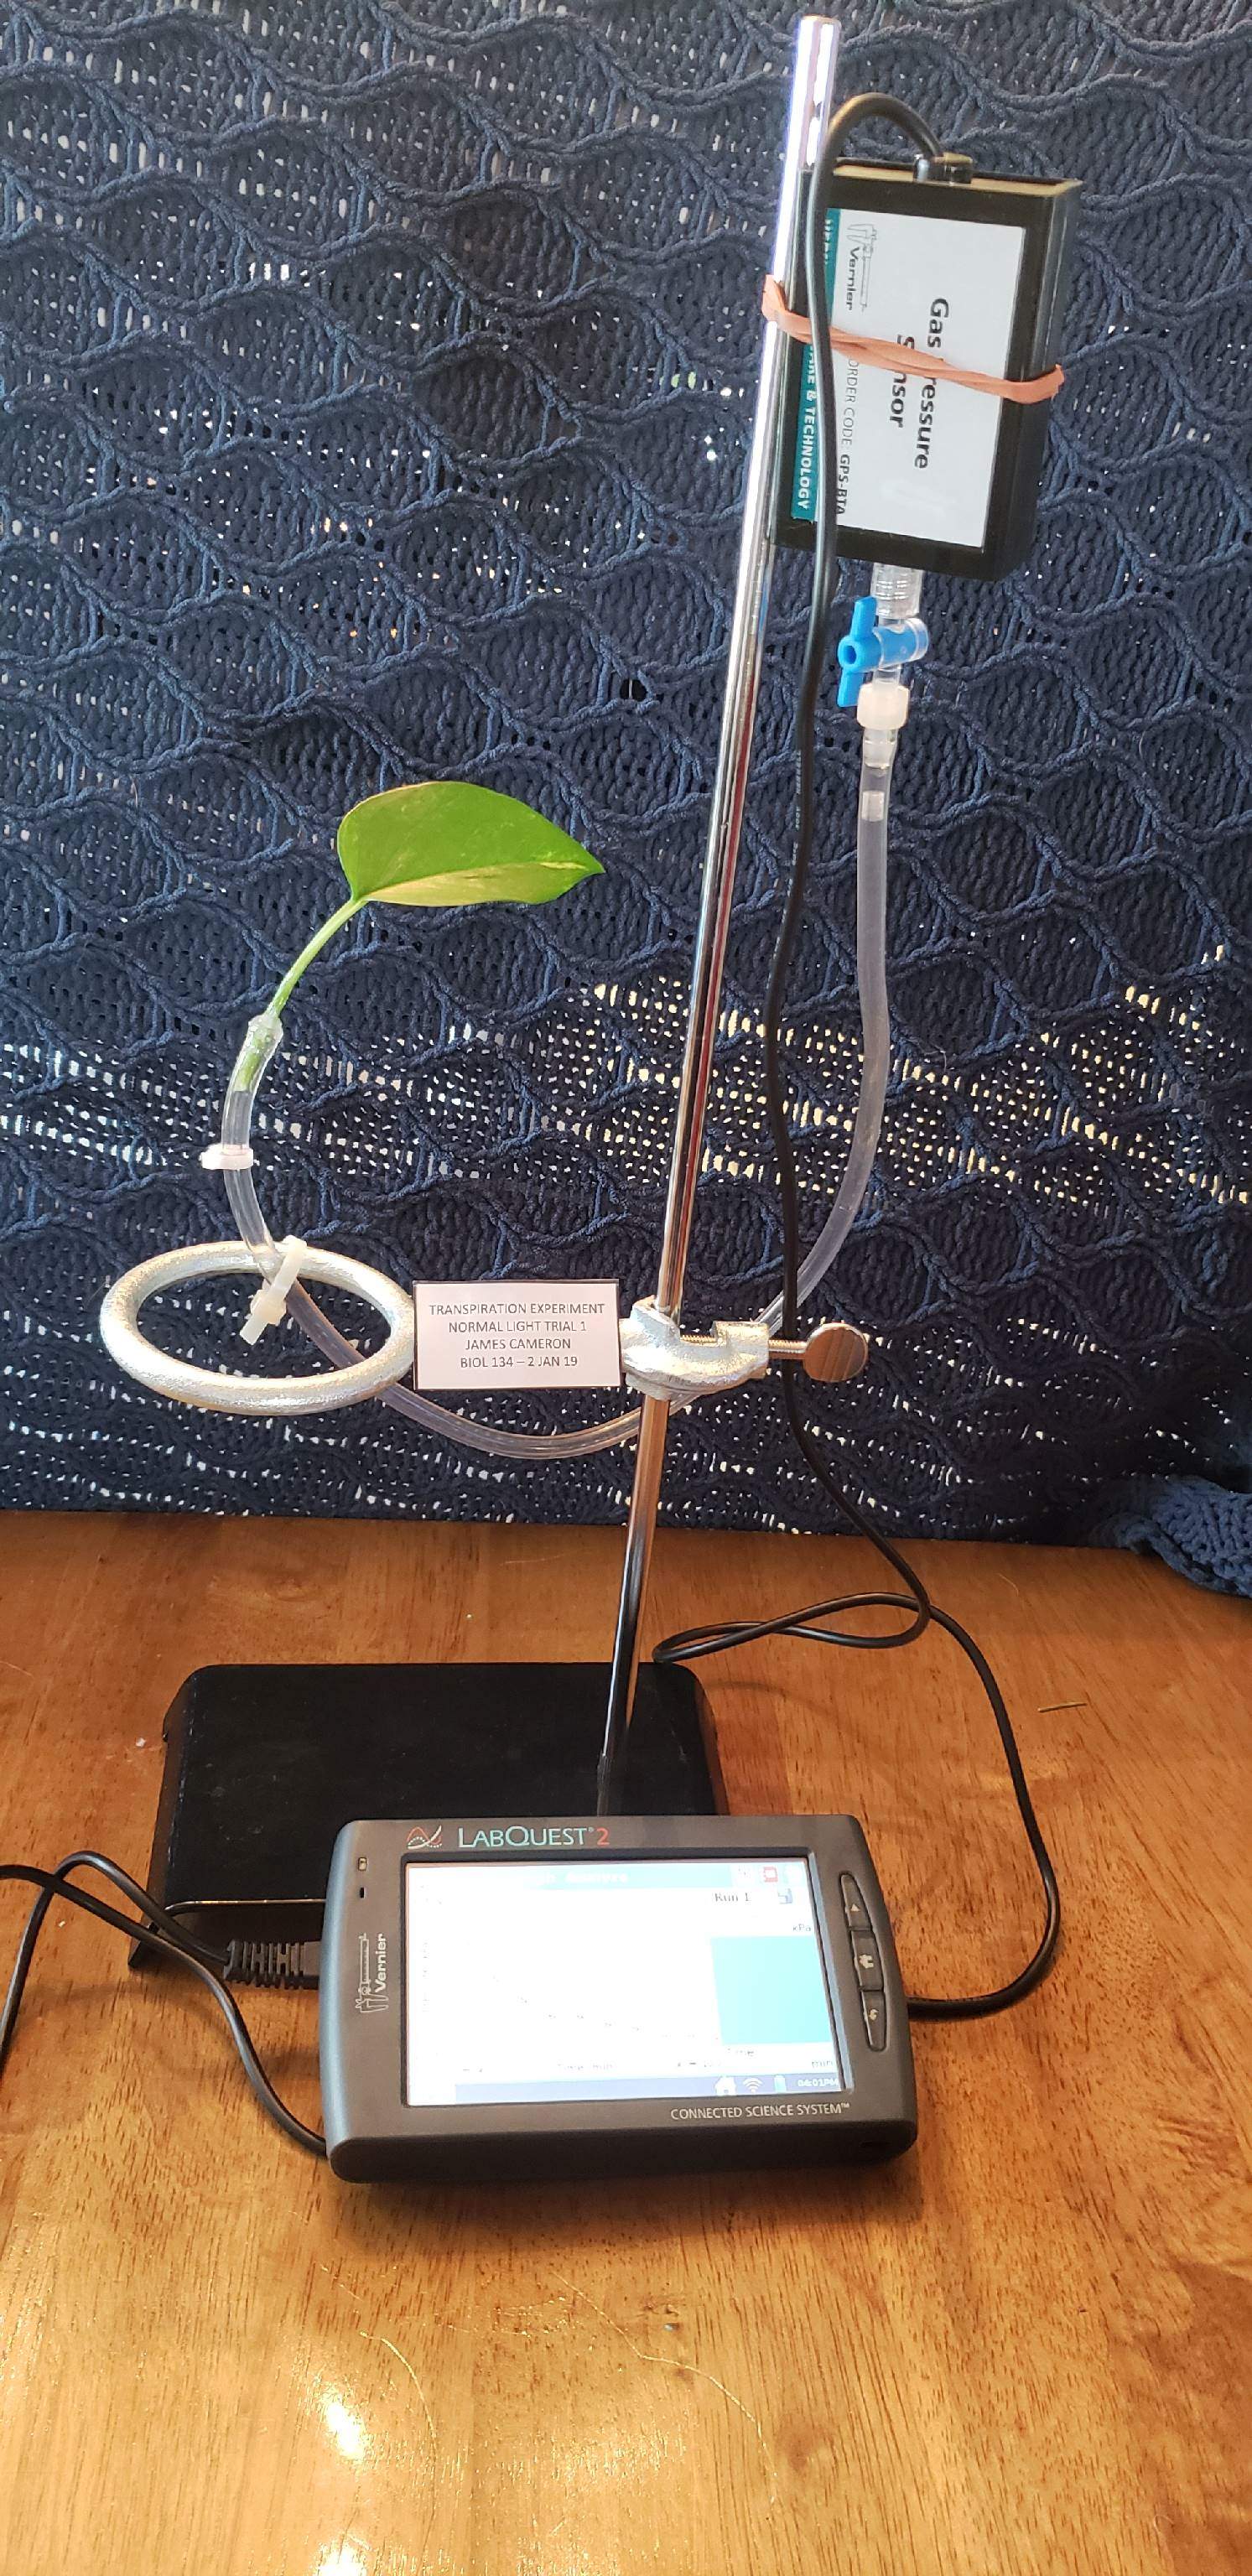
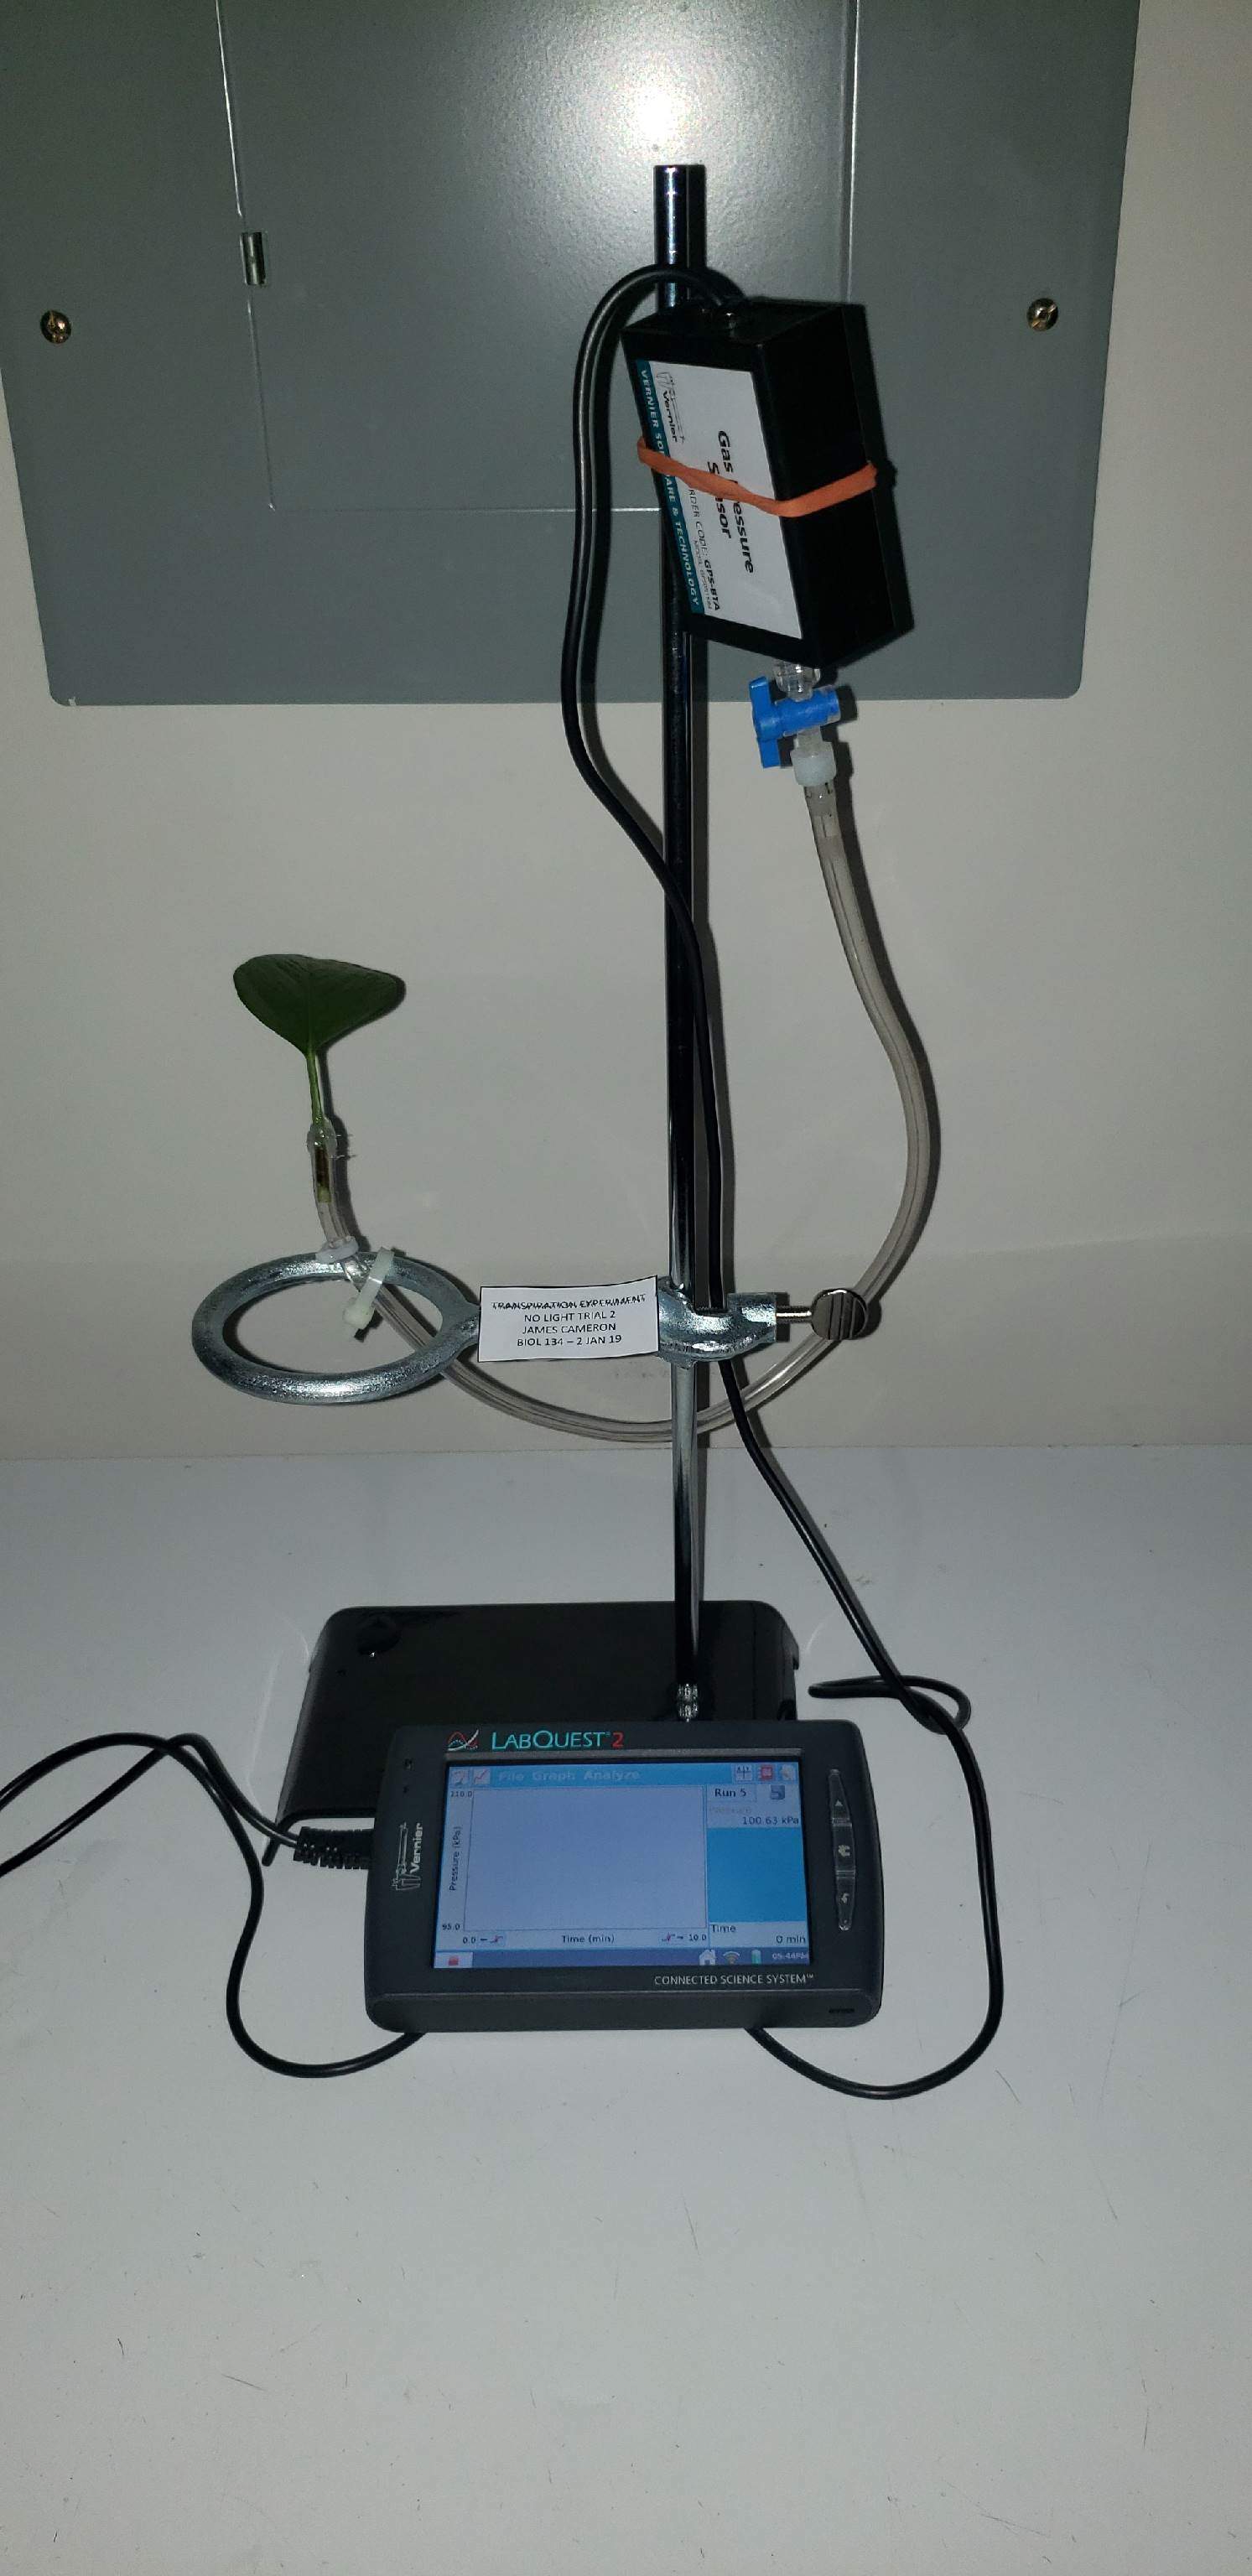
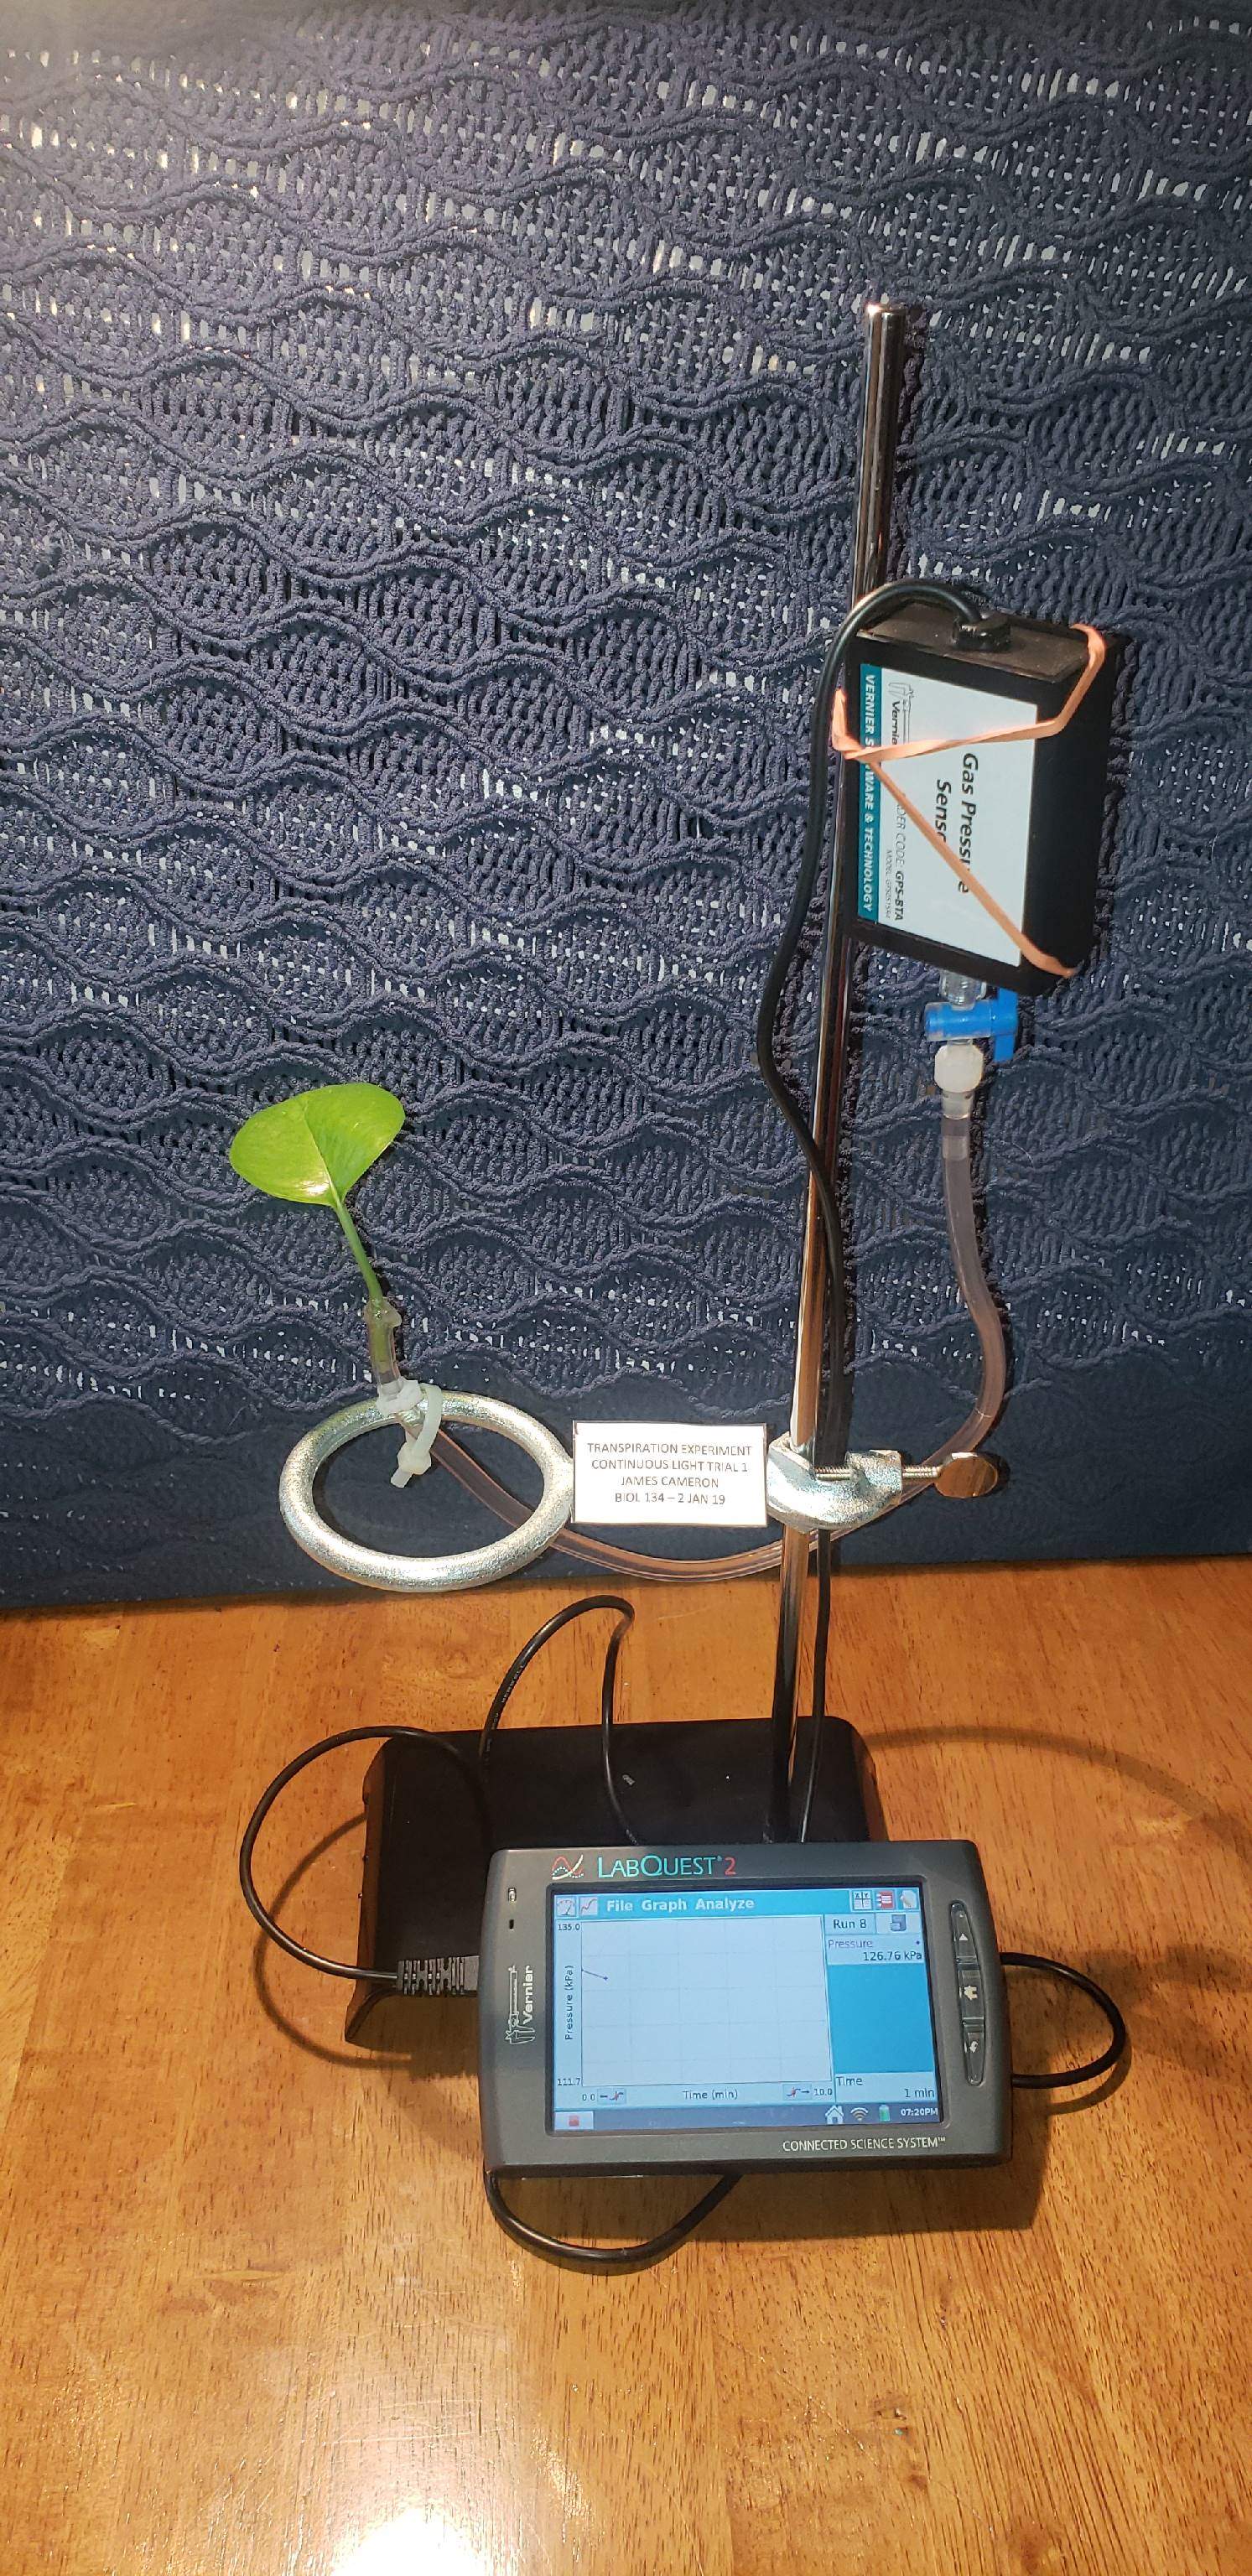
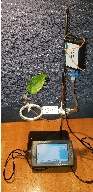
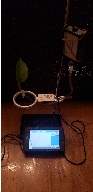
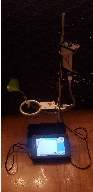
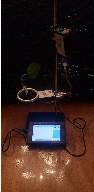
A tub was filled with store bought water to fill tubing with the GPS attachment utilizing a syringe to ensure no air bubbles are in the tubing. Following this, a closable valve attachment was connected to one end and set in the closed position. The plant was cut with a razor at a 45° angle to prevent any crushing of the plant’s stem and was inserted into the tubing as far as it would go, and then a clamp was applied to the tubing where the plant was inserted. The plant and tubing were removed from the water. Petroleum jelly was applied to the area where the plant was inserted into the tubing to create an air tight seal. The GPS was attached to the valve end of the tubing. The tubing with plant and GPS was setup on the stand with the GPS at a higher elevation on the stand. The GPS was then connected to the LabQuest 2 and the data was collected.
Through the experiment, the variables were maintained to include the continuous light variable which was created shining light through water to prohibit heat exposure from effecting the plant’s transpiration. The captured transpiration data was transferred to a computer using a USB cord from the LabQuest2 device into LoggerPro3 program. All steps were repeated three times through each trial.
RESULTS
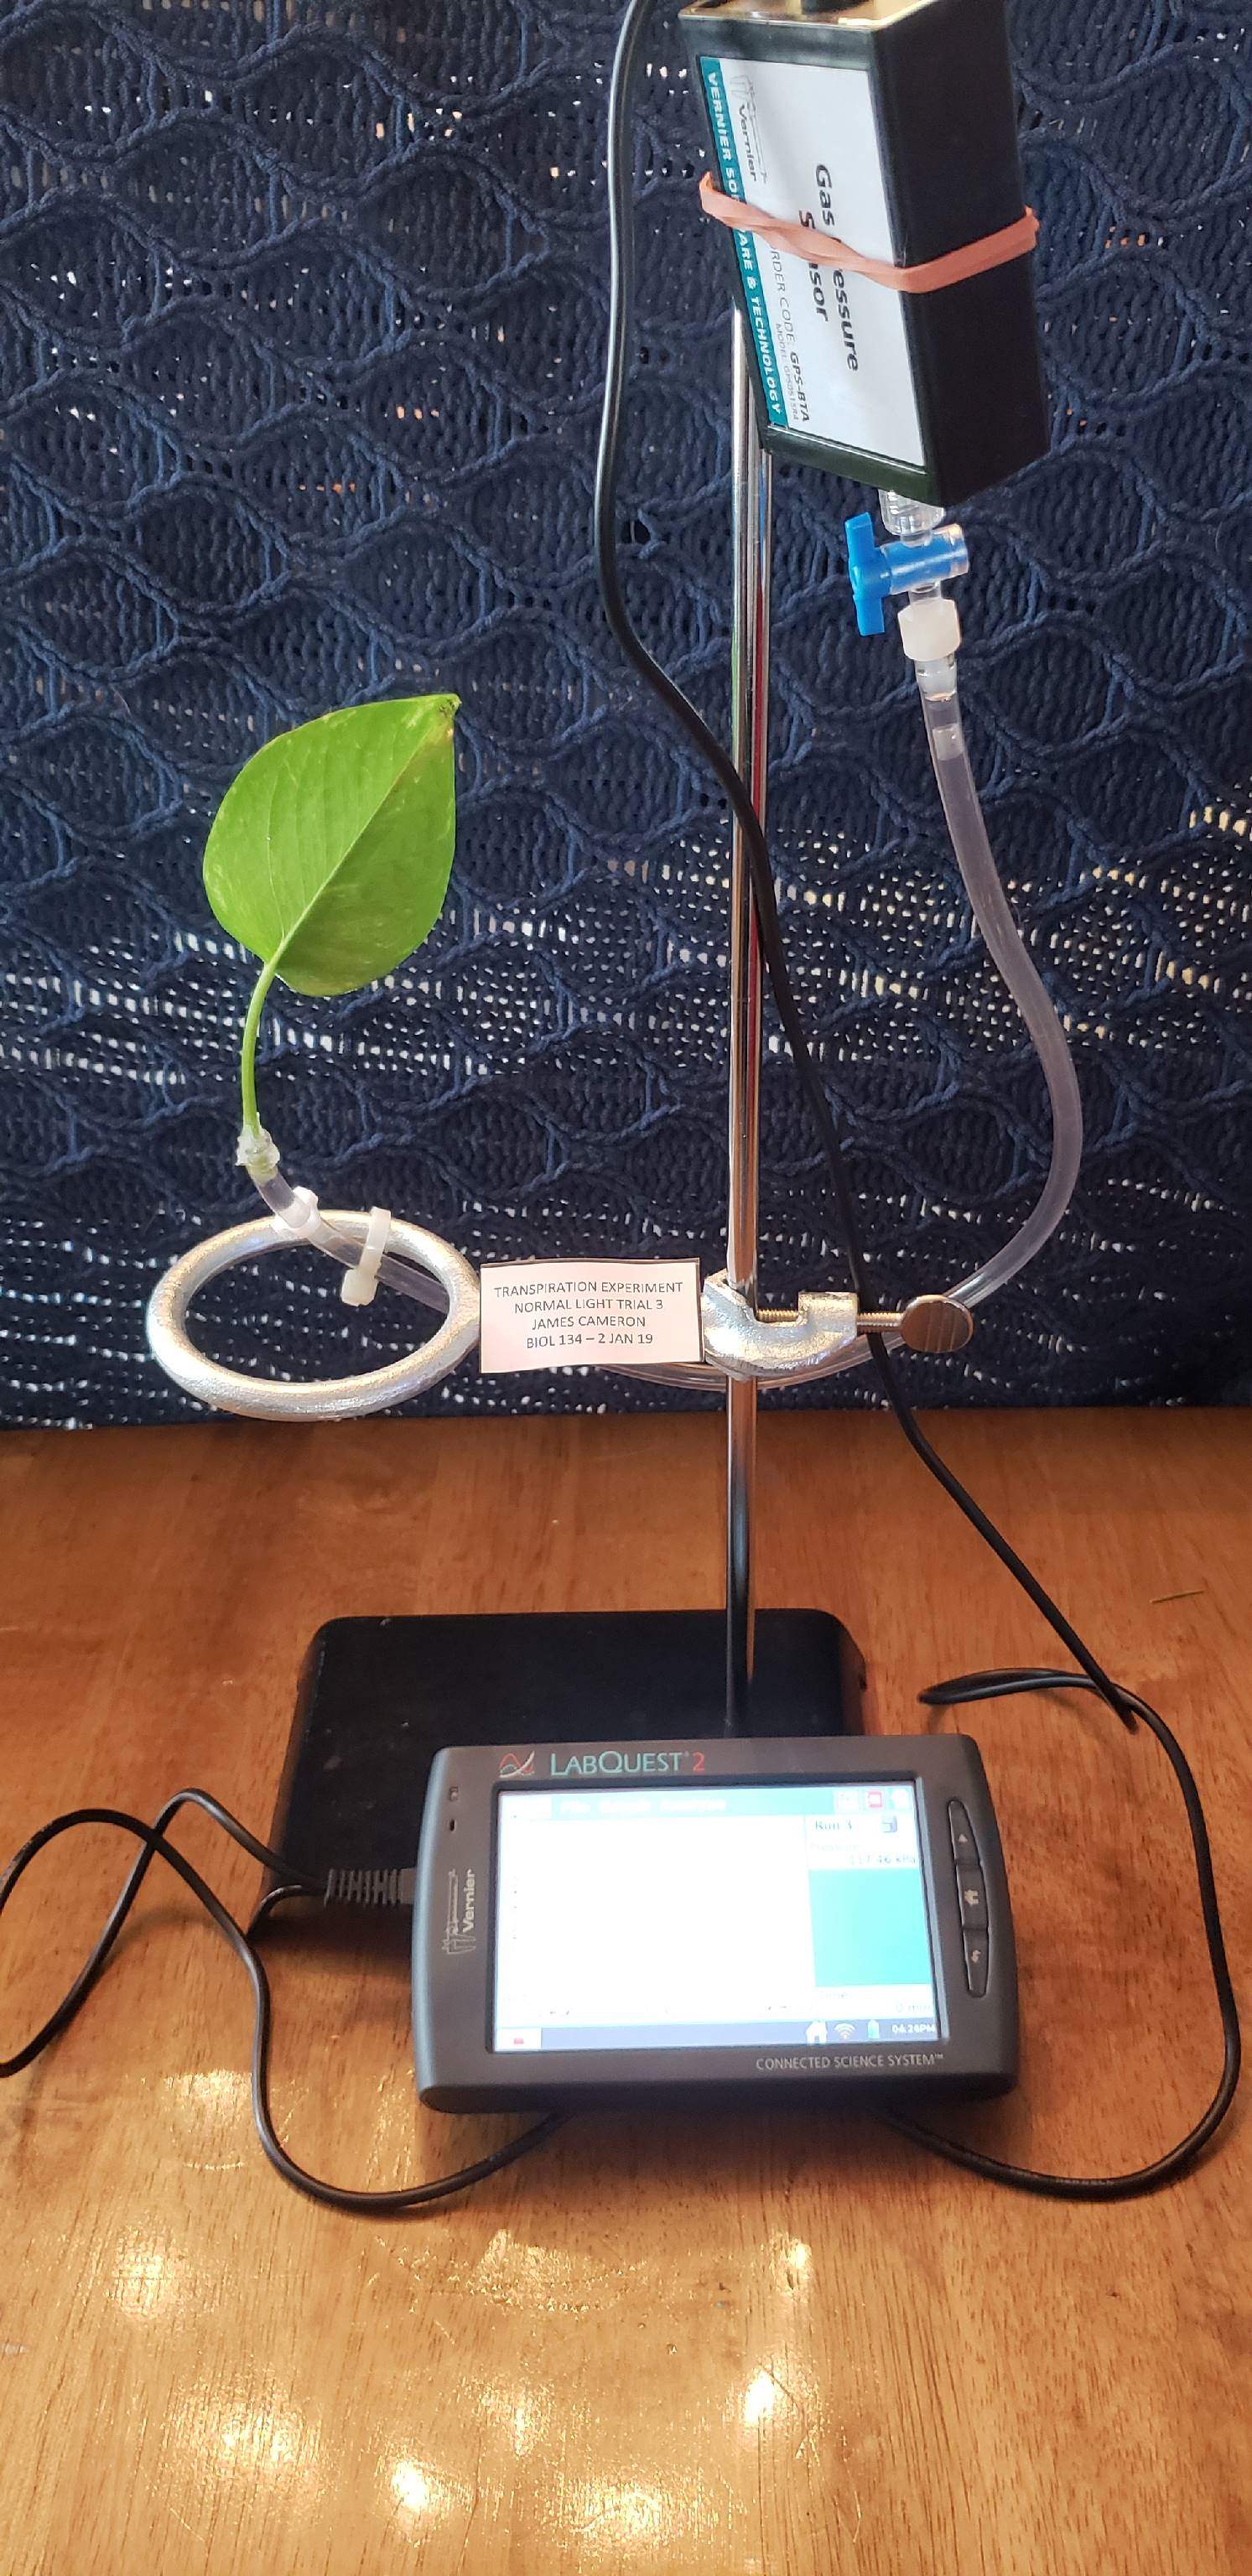
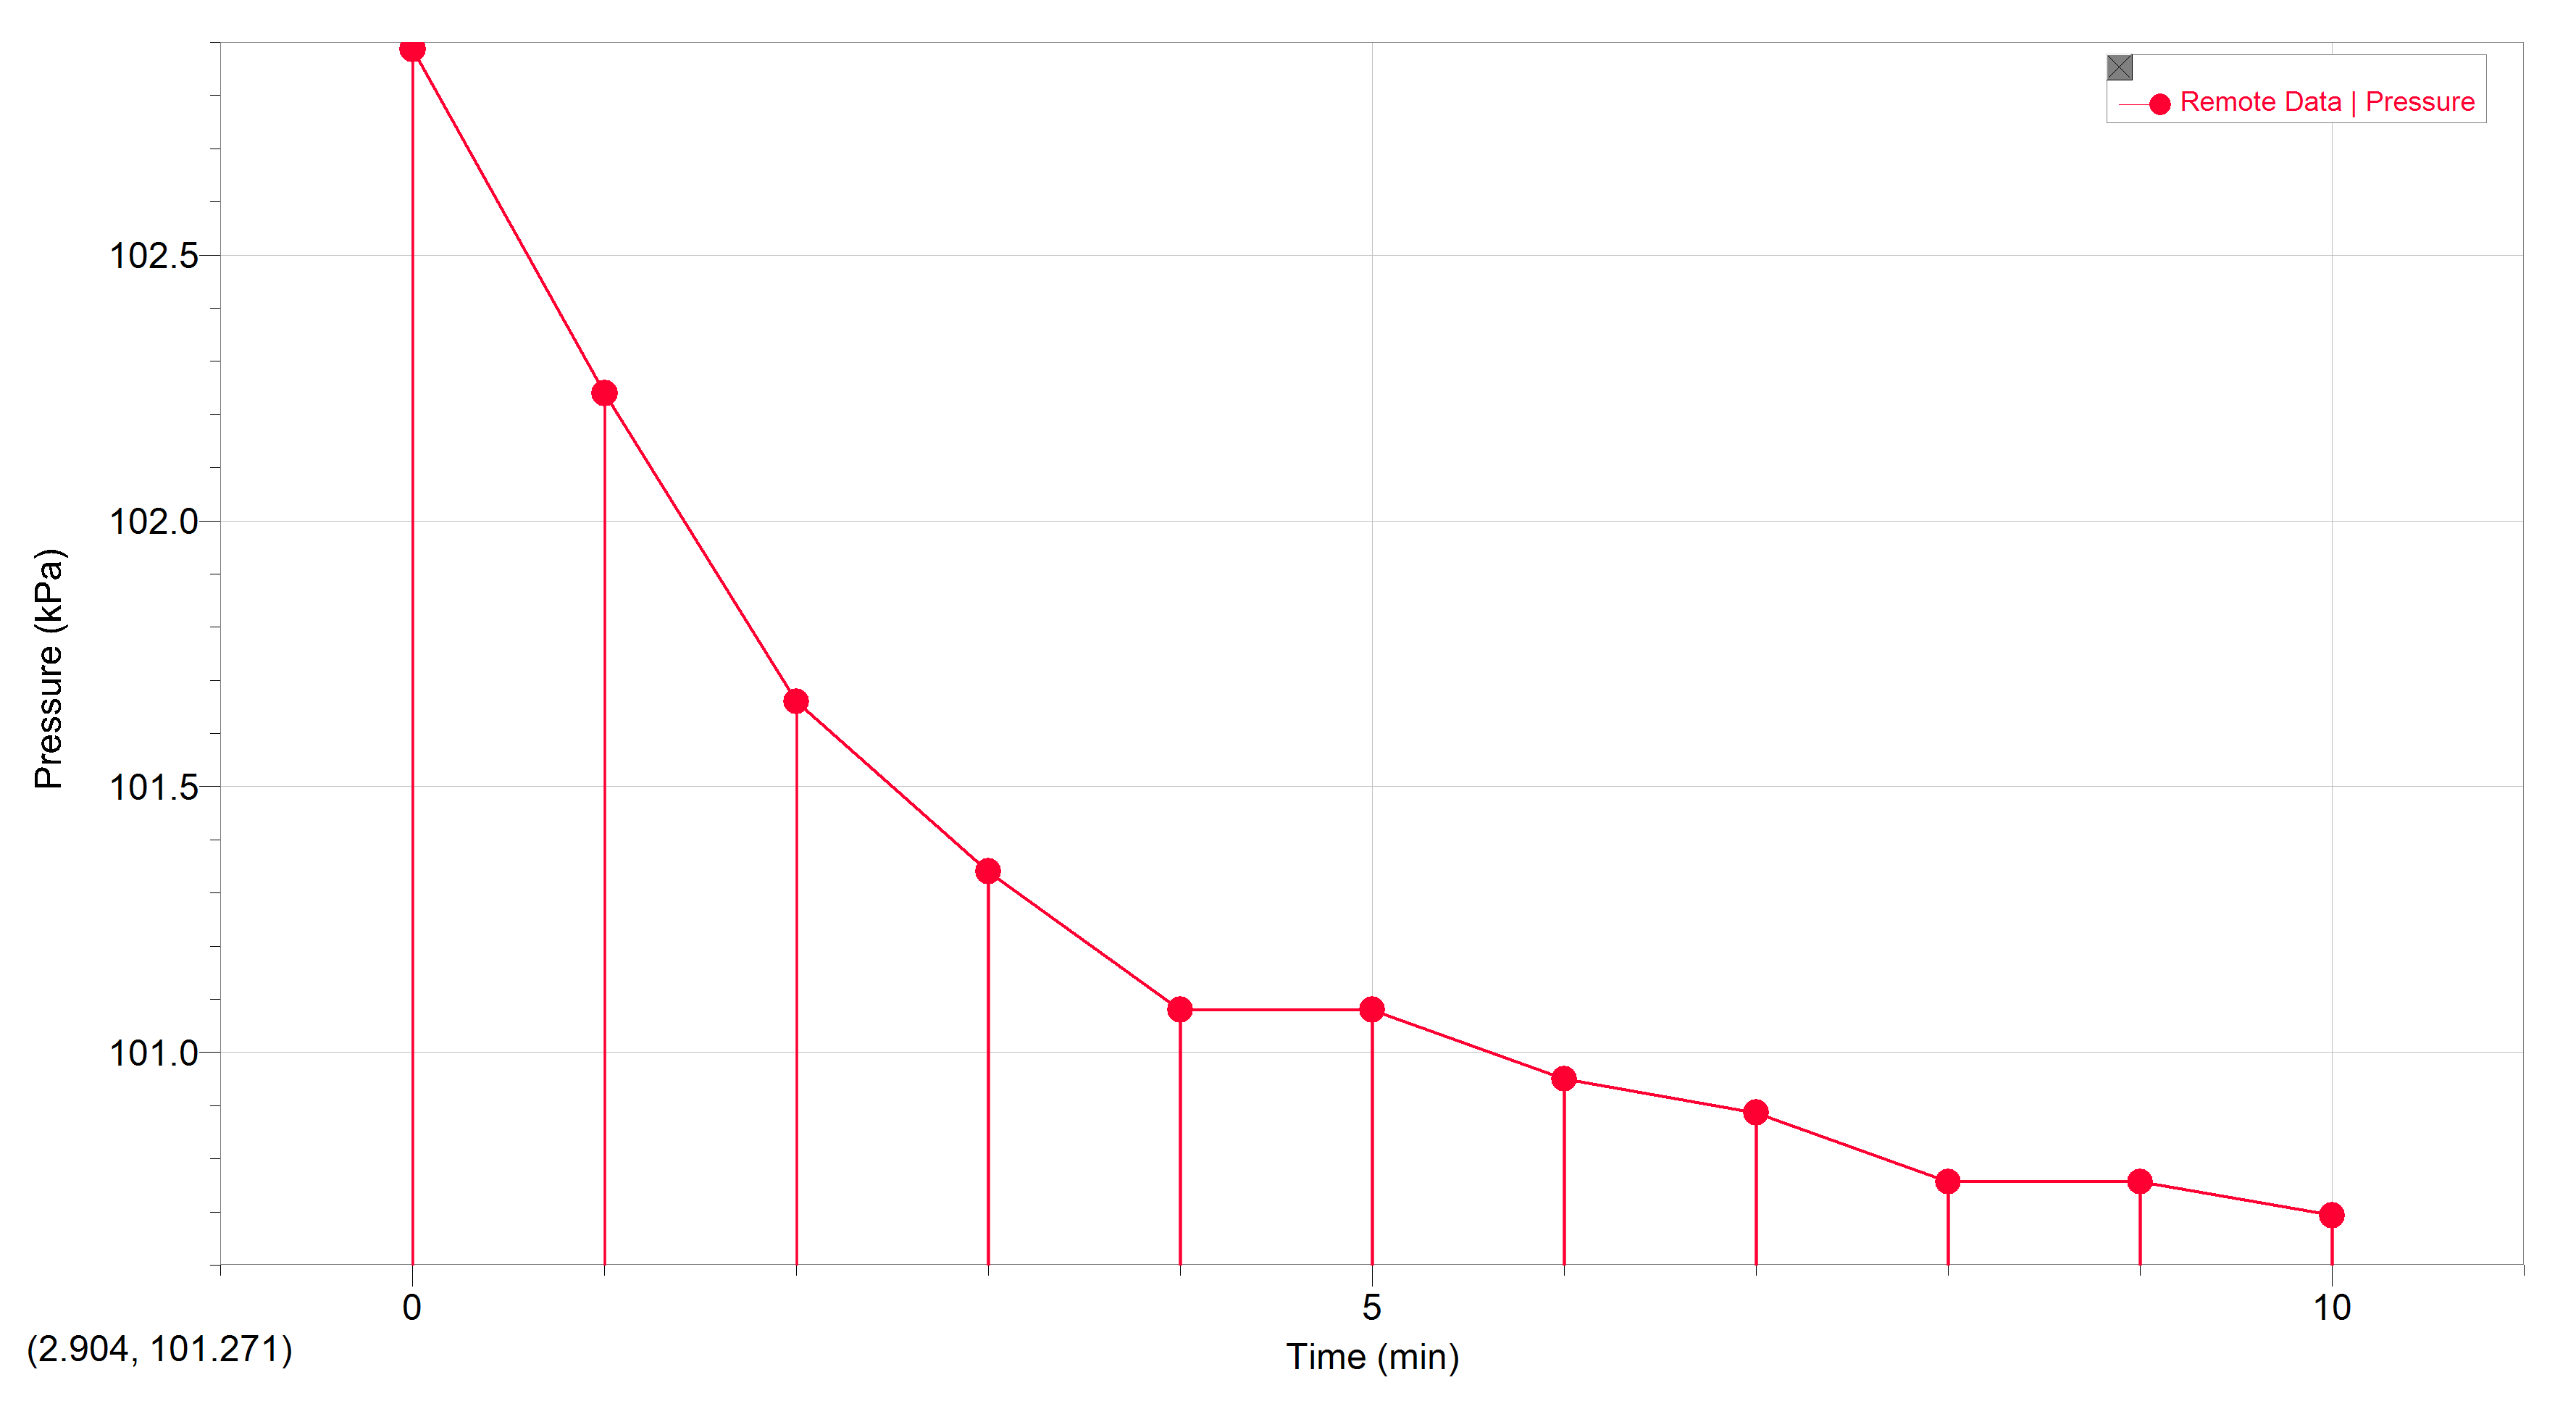
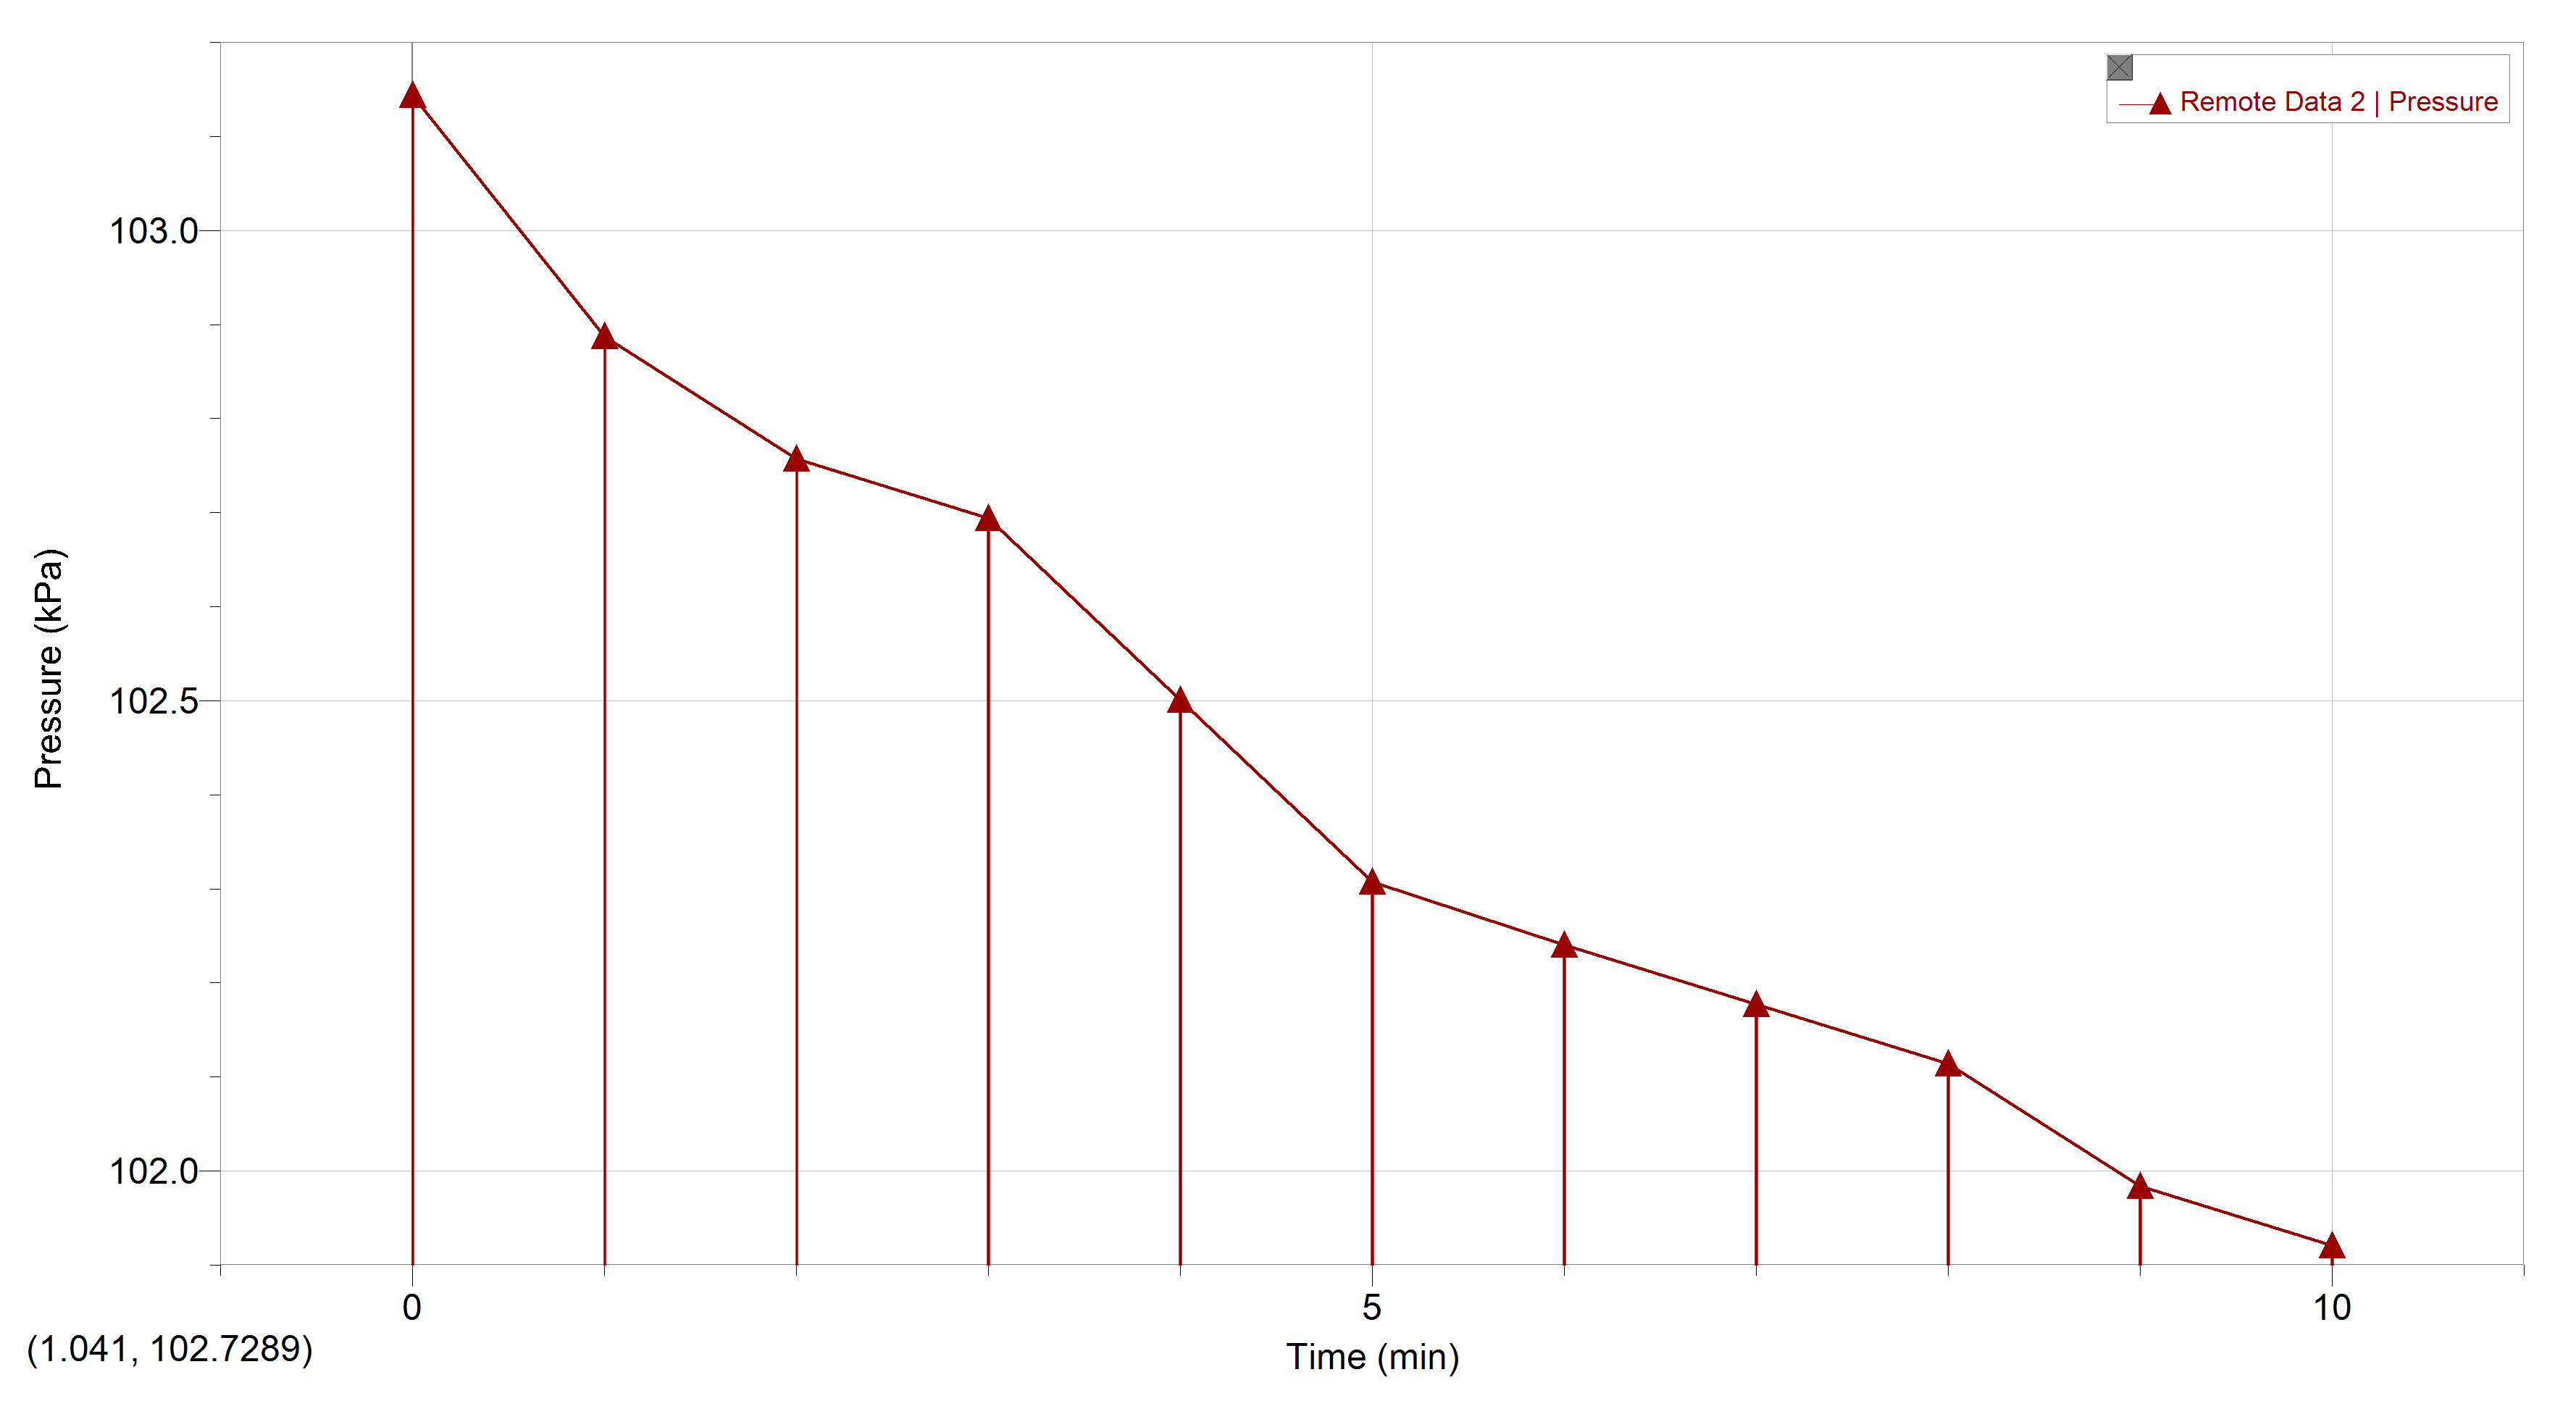
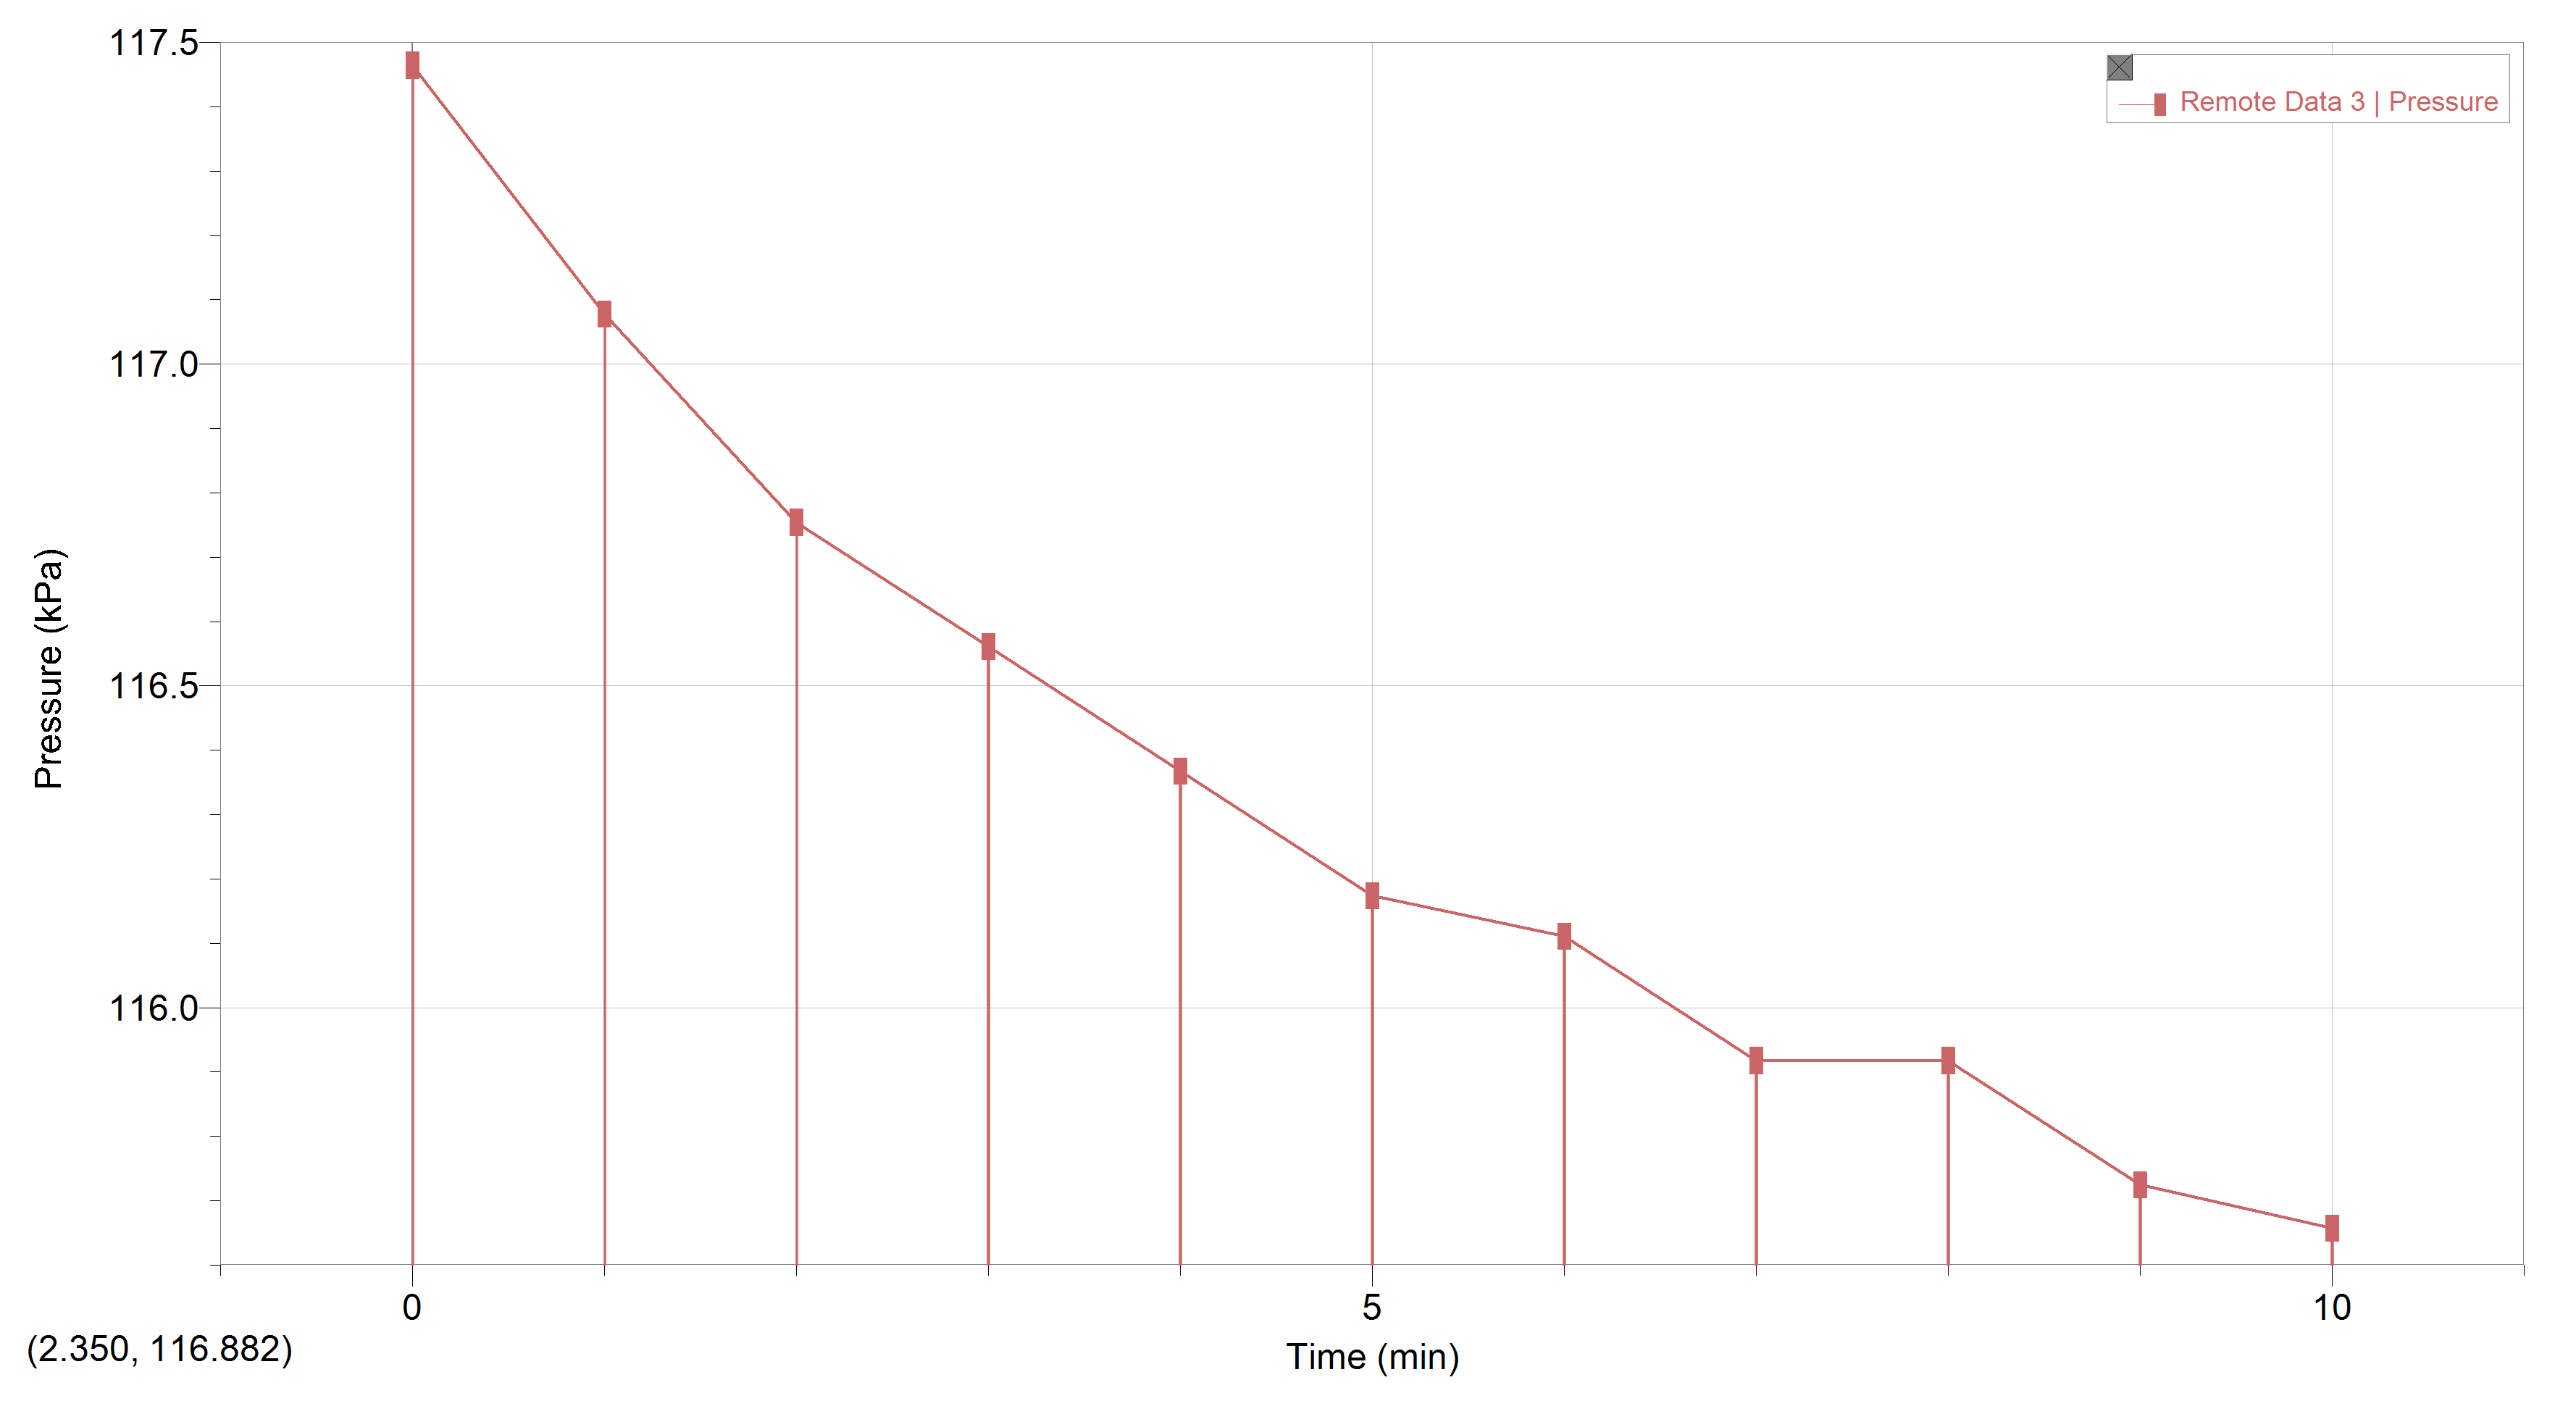
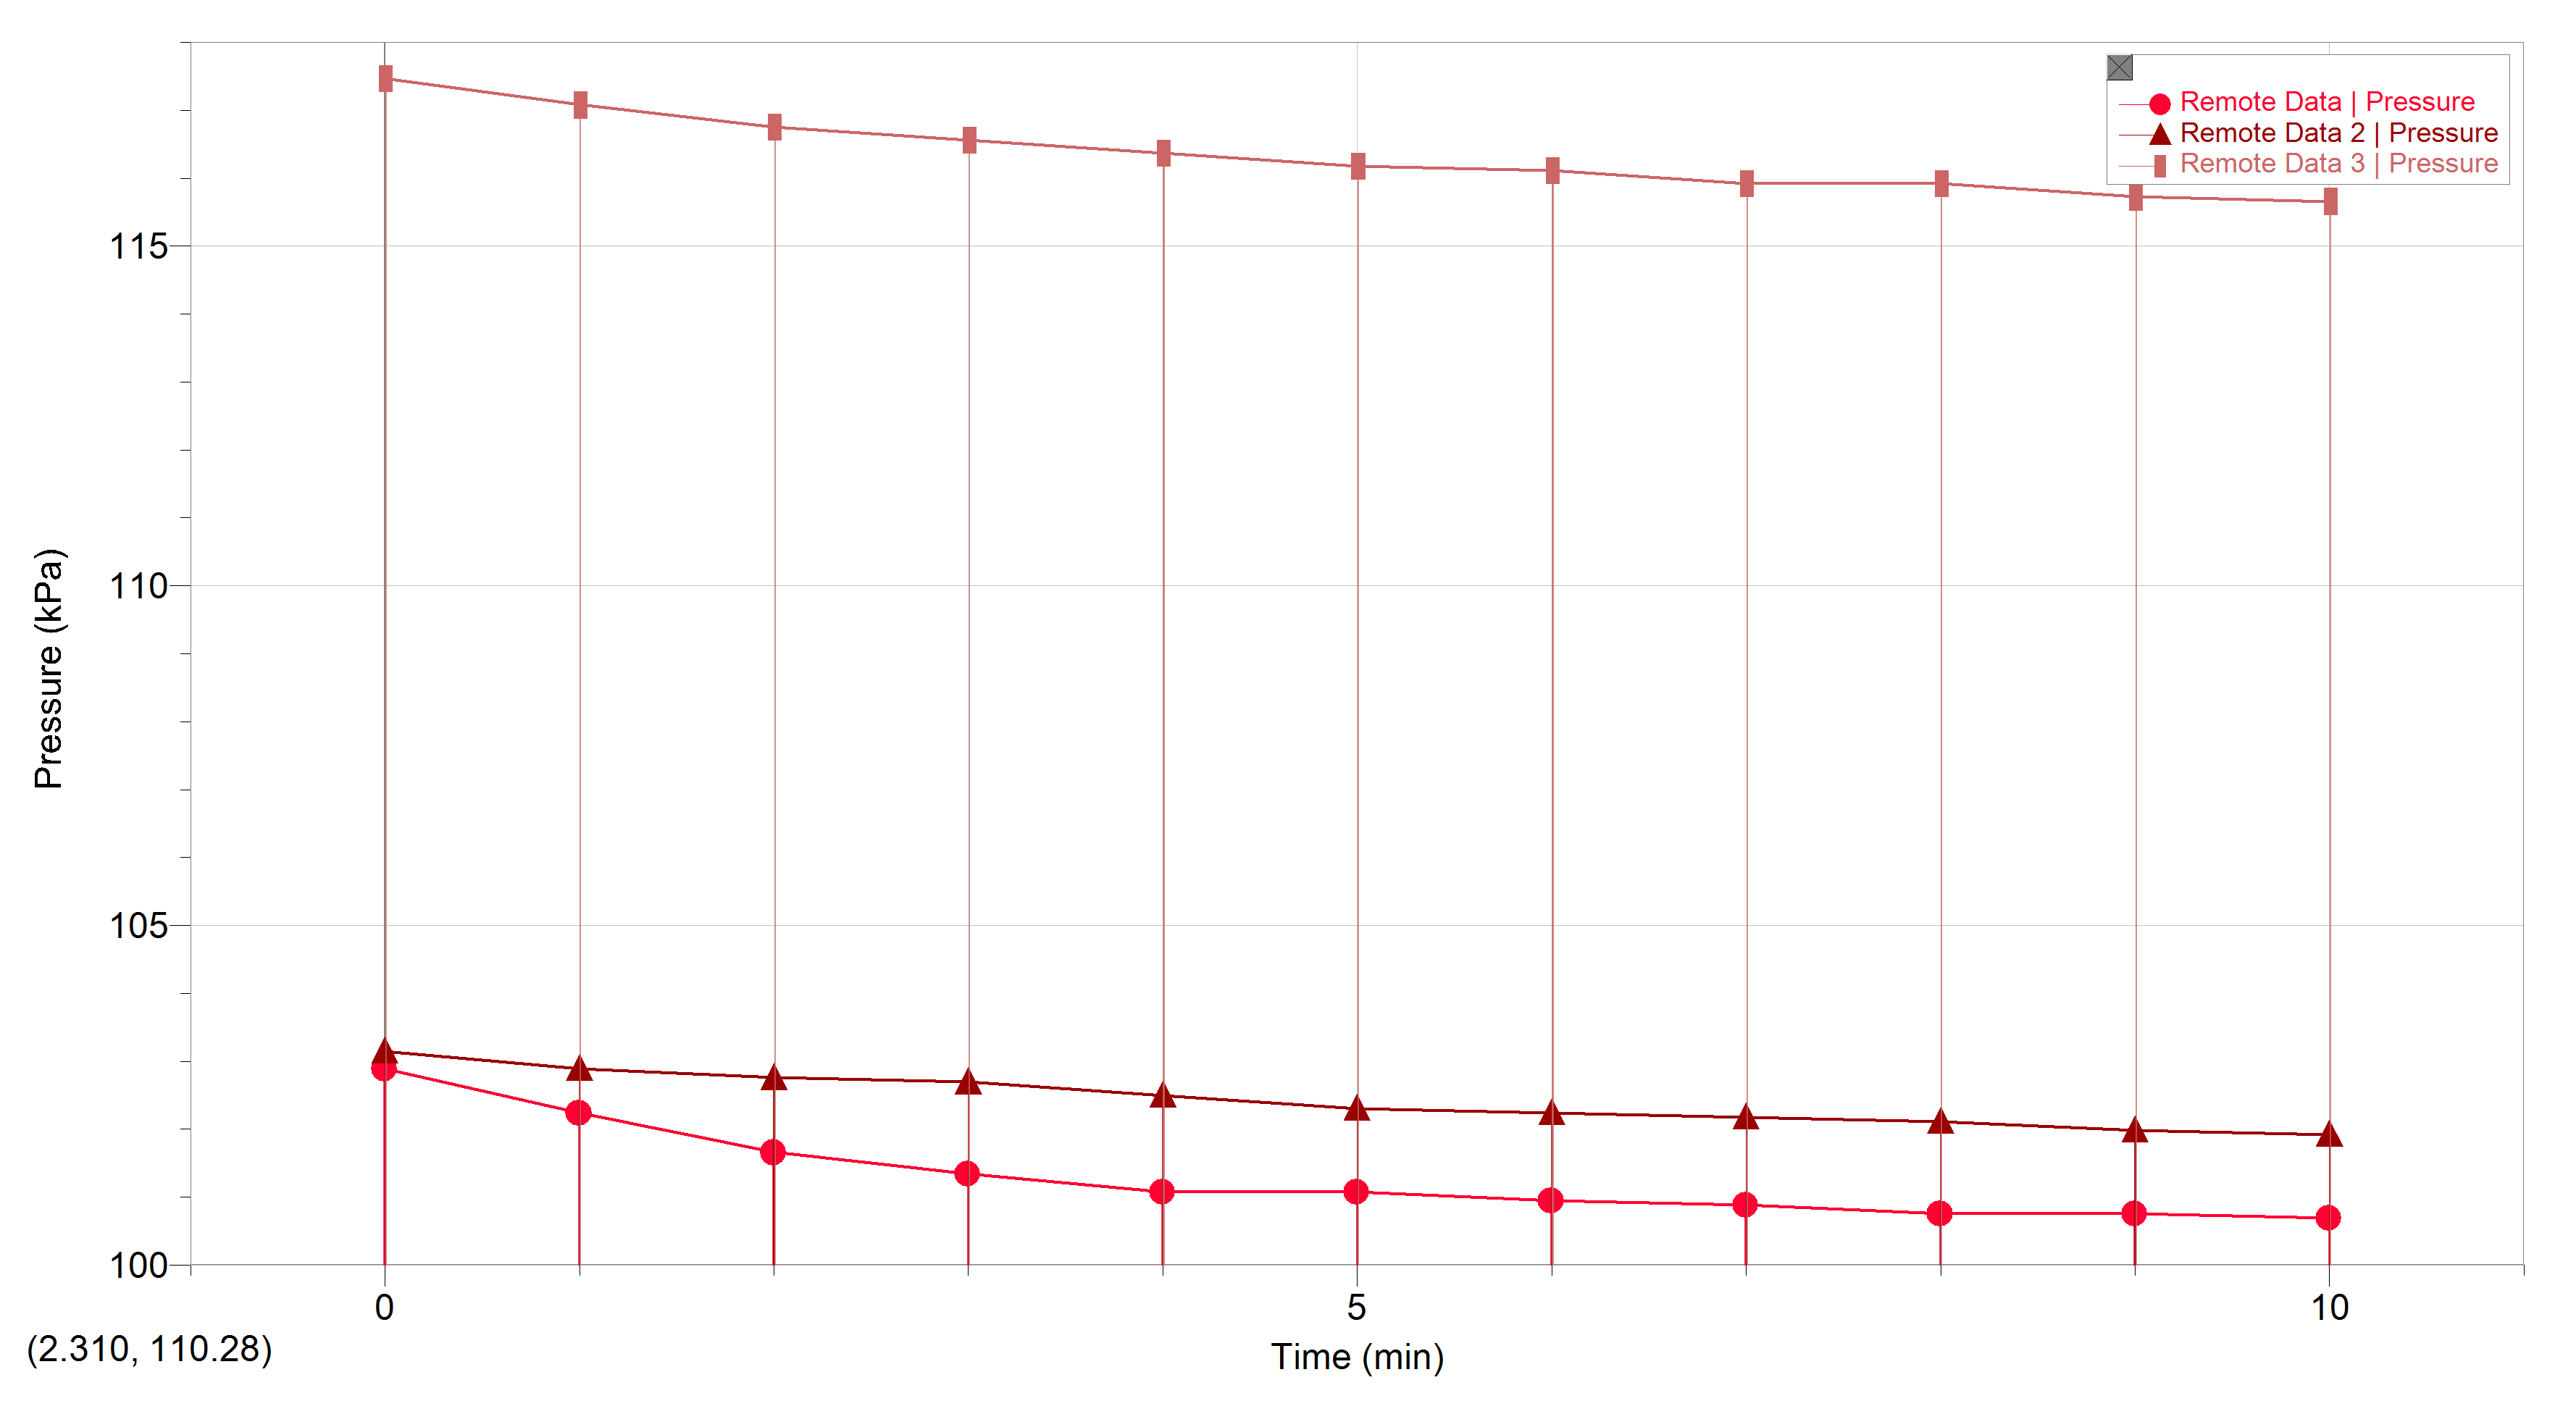
The initial experiment involved the normal light variable. The first trial exhibited an initial kPa of 102.9 with a final kPa of 100.7. Through the first five minutes of readings the kPa decreased at an average of 0.23 kPa per minute. Through the final five minutes the kPa decreased at an average of 0.15 kPa. The average kPa through the trial was 0.19 kPa per minute. The Normal Light Trial 1 graph exhibits the gradual dissention of kPa through the first trial. The second trial exhibited an initial kPa of 103.15 with a final kPa of 101.9. Through the first five minutes of readings the kPa decreased at an average of 0.20 kPa per minute. Through the final five minutes the kPa decreased at an average of 0.10 kPa. The average kPa through the trial was 0.15 kPa per minute. The Normal Light Trial 2 graph exhibits the gradual dissention of kPa through the second trial. The third trial exhibited an initial kPa of 117.5 with a final kPa of 115.7. Through the first five minutes of readings the kPa decreased at an average of 0.28 kPa per minute. Through the final five minutes the kPa decreased at an average of 0.11 kPa. The average kPa through the trial was 0.21 kPa per minute. The Normal Light Trial 3 graph exhibits the gradual dissention of kPa through the third trial. The combined three trials exhibited an average starting kPa of 107.85 and an ending kPa of 106.1 with an average kPa dissention of 0.15 kPa.
Normal Light Trial 1
Normal Light Trial 2
Normal Light Trial 3
Normal Light Combined Trials 1, 2, 3
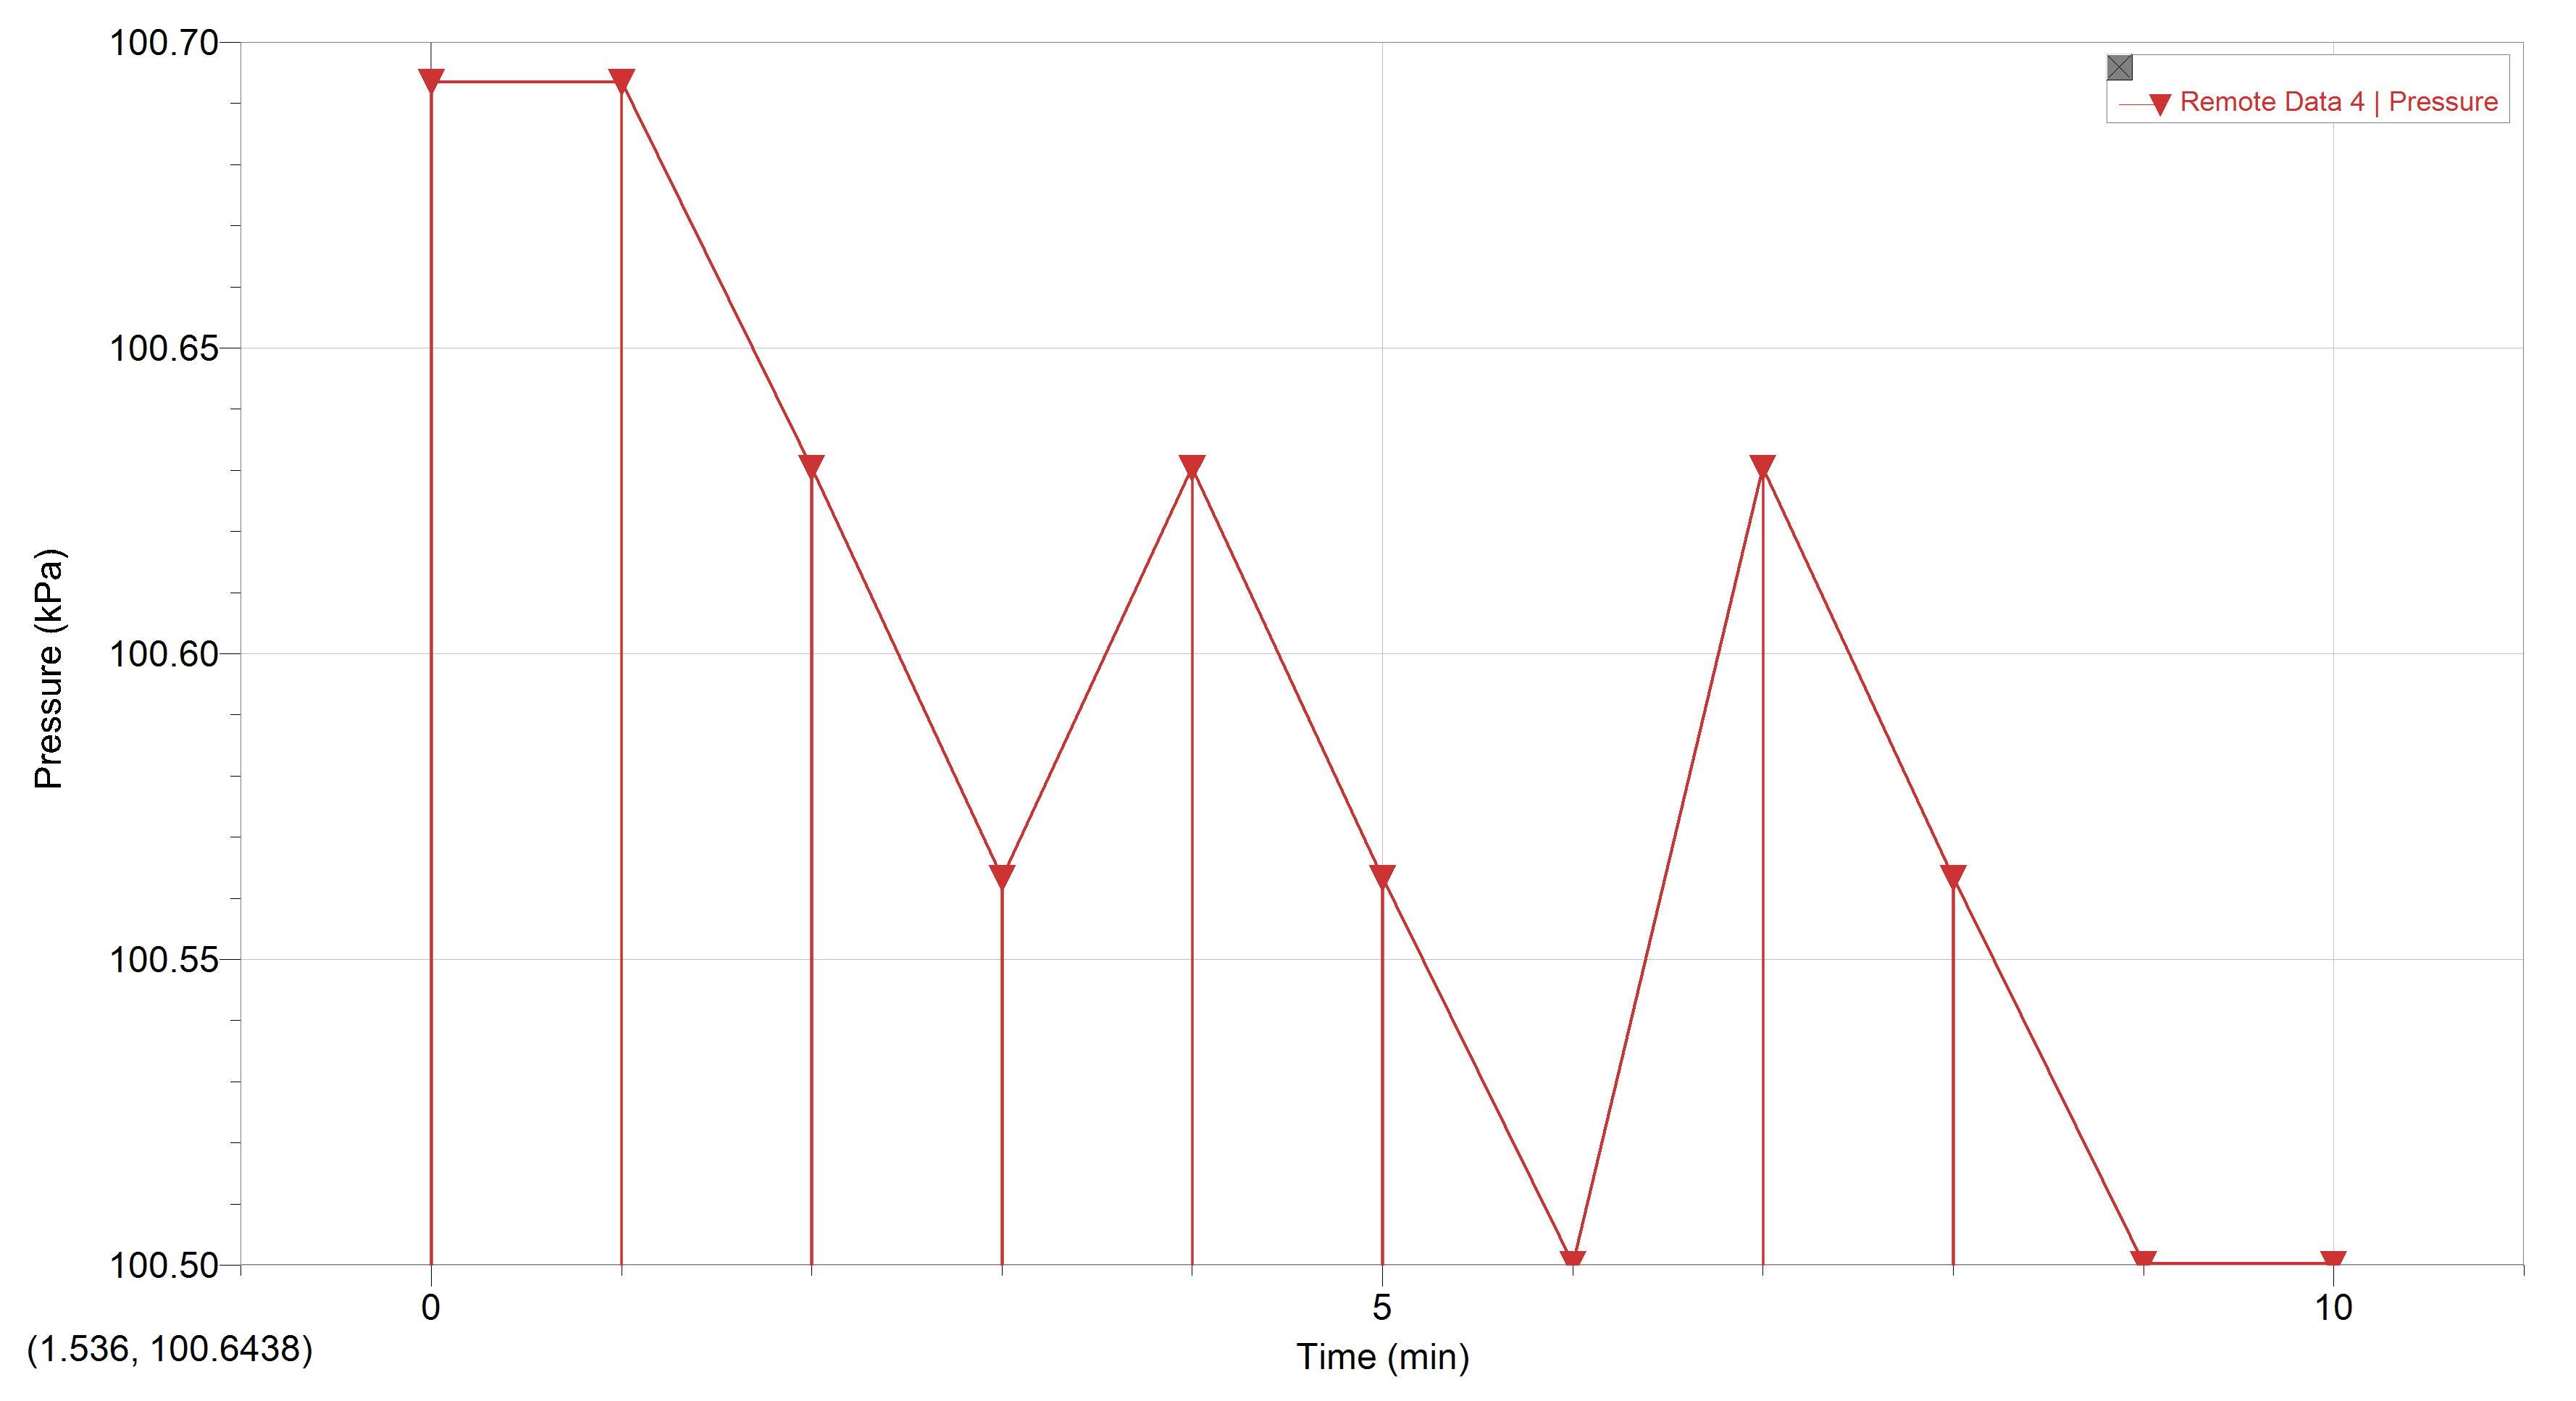
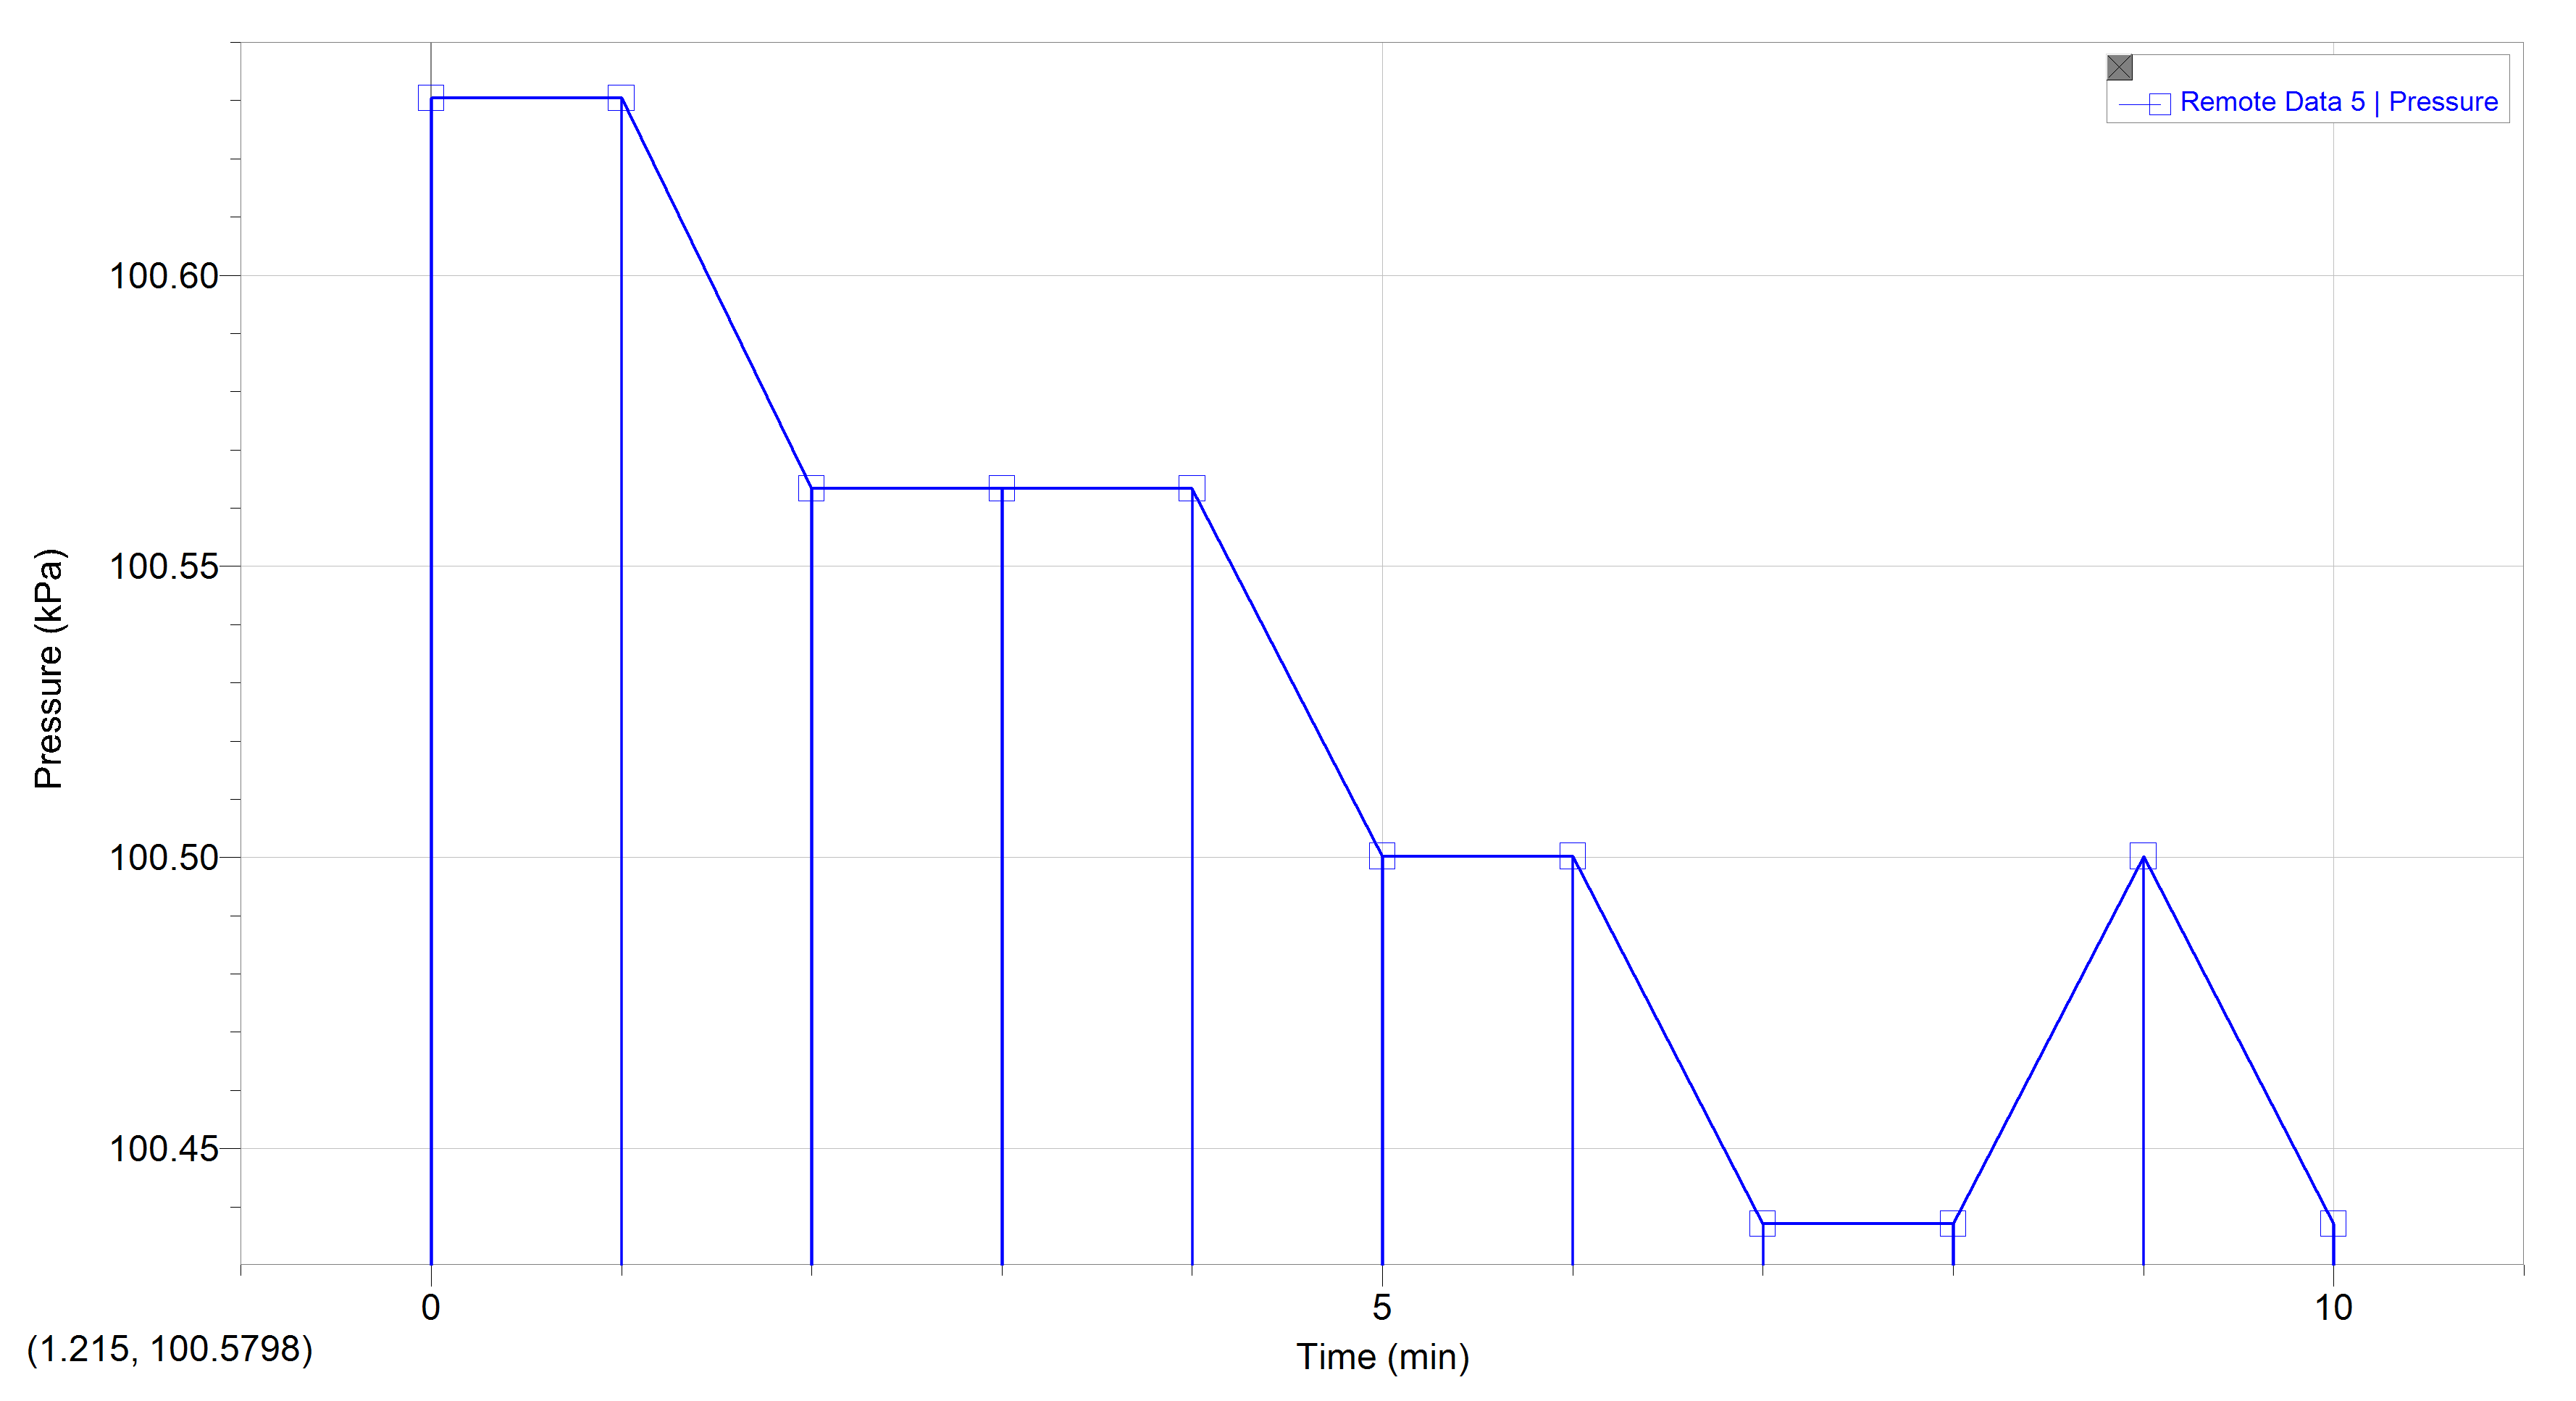
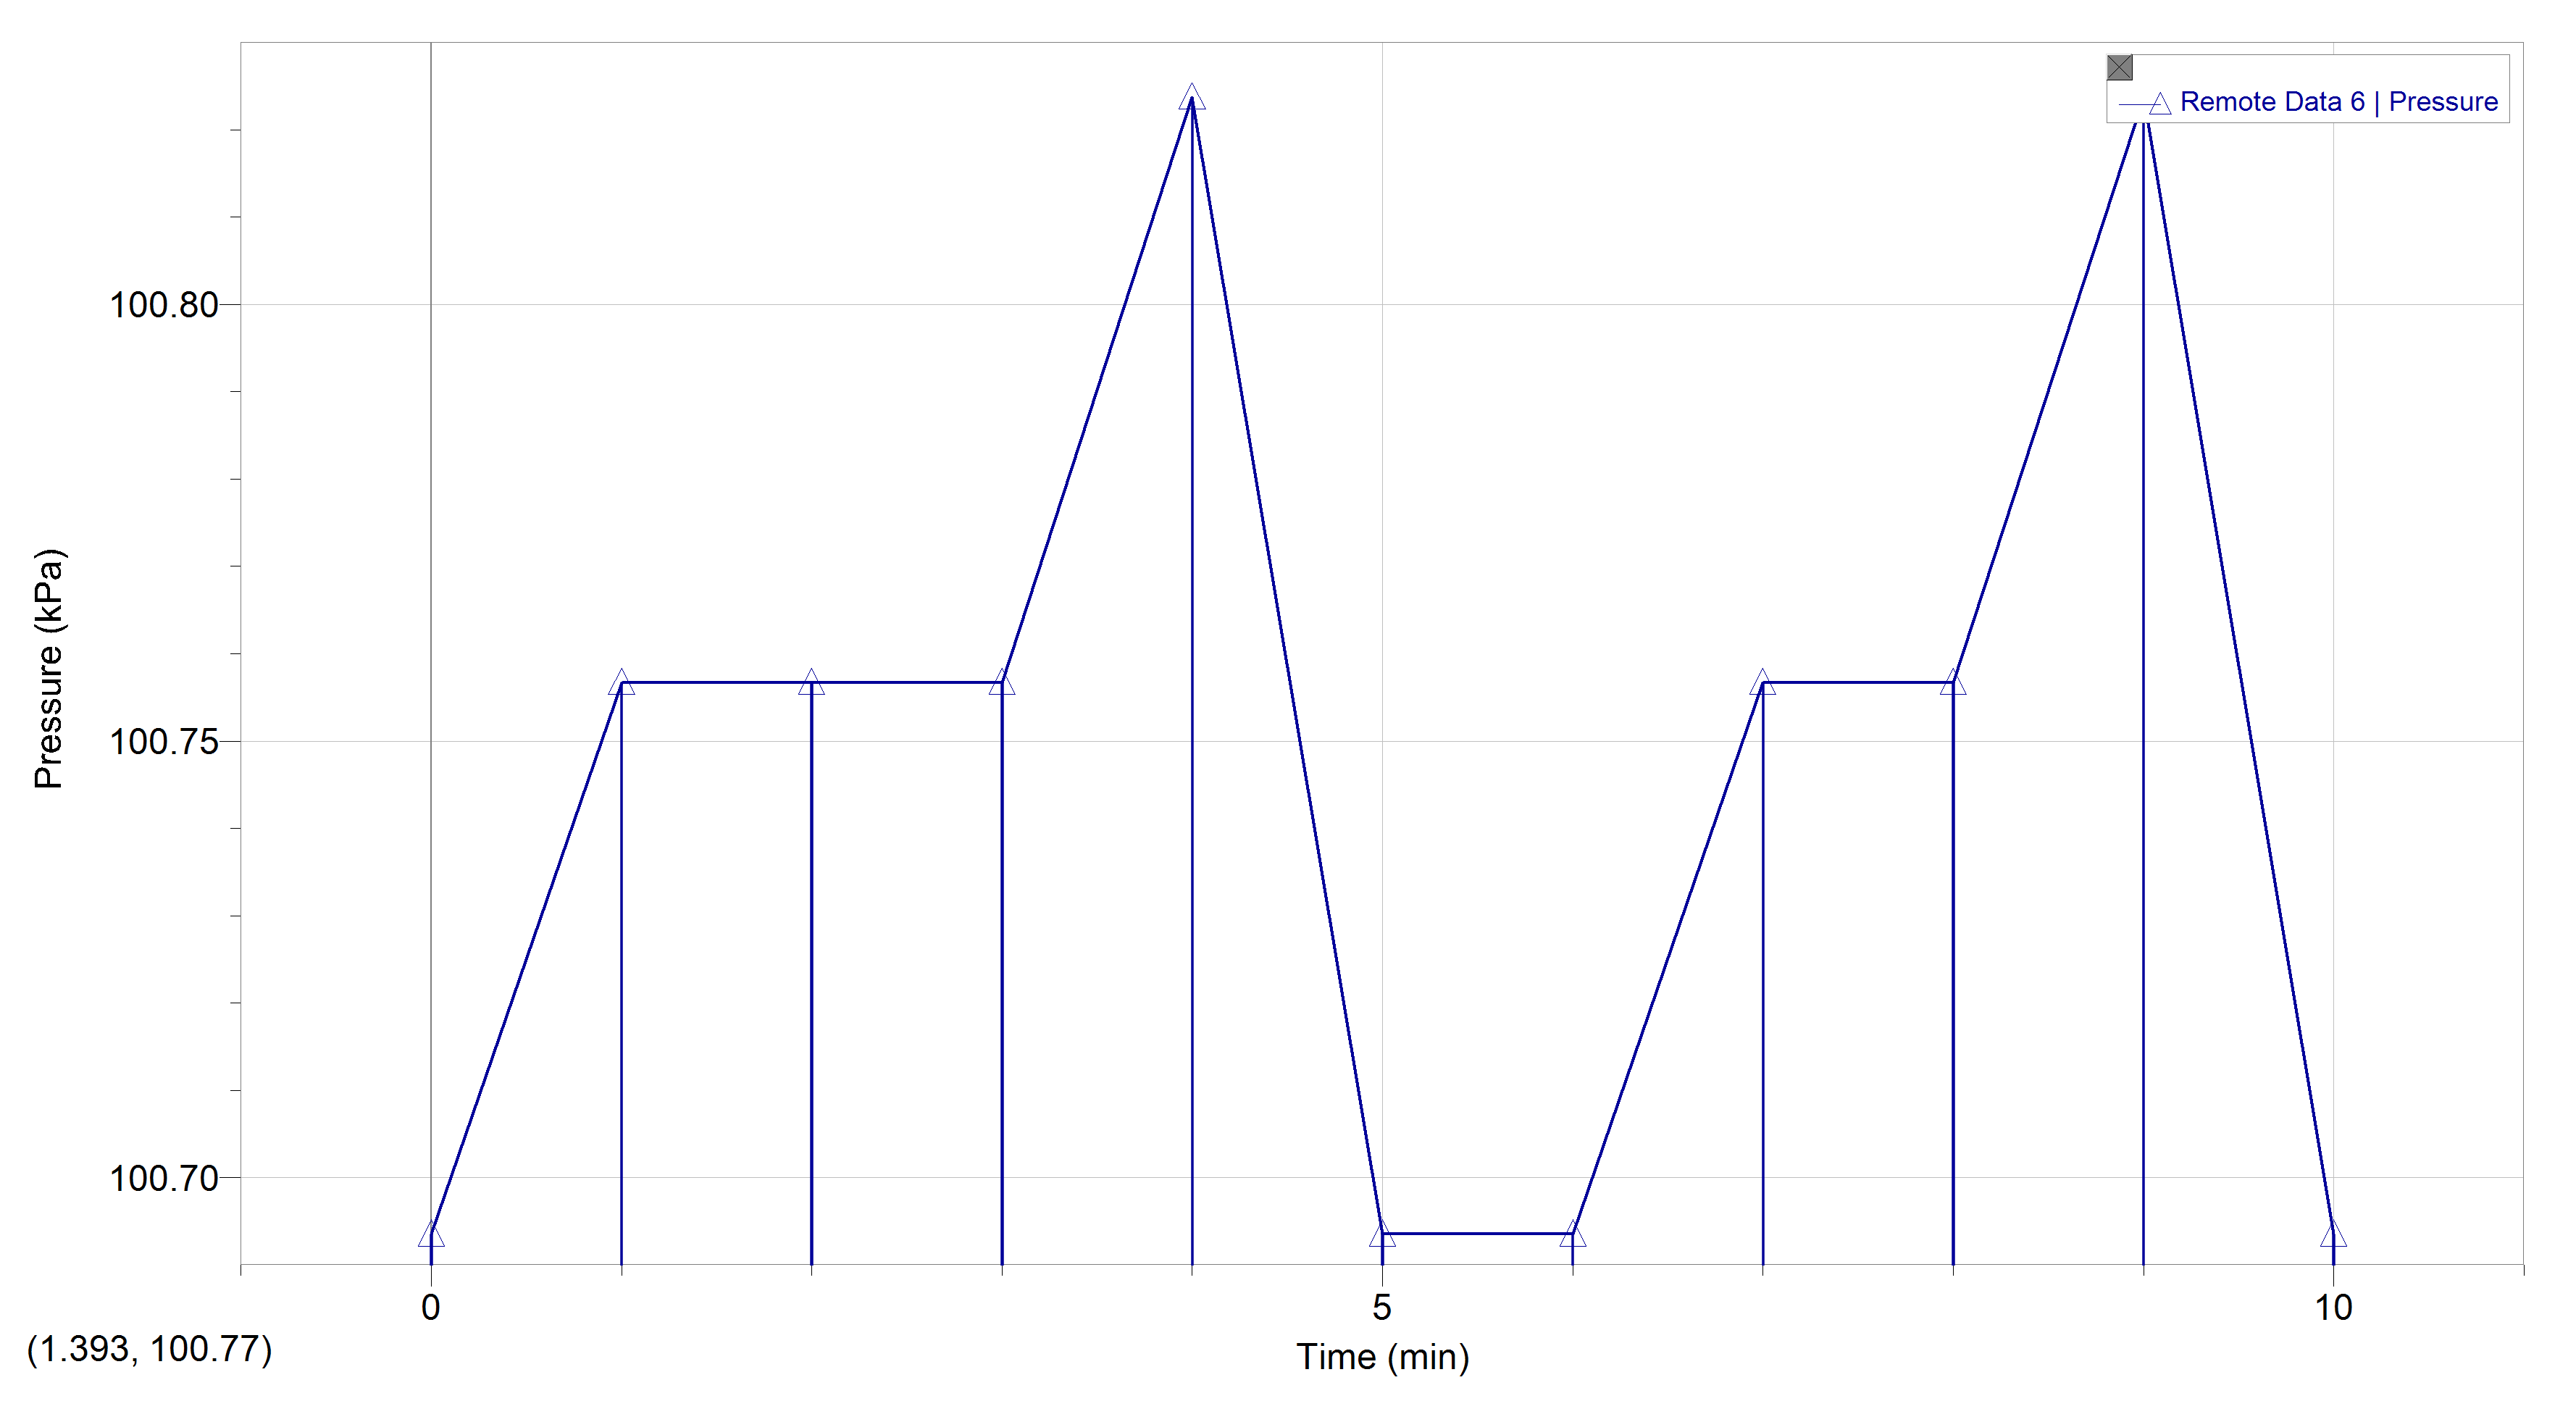
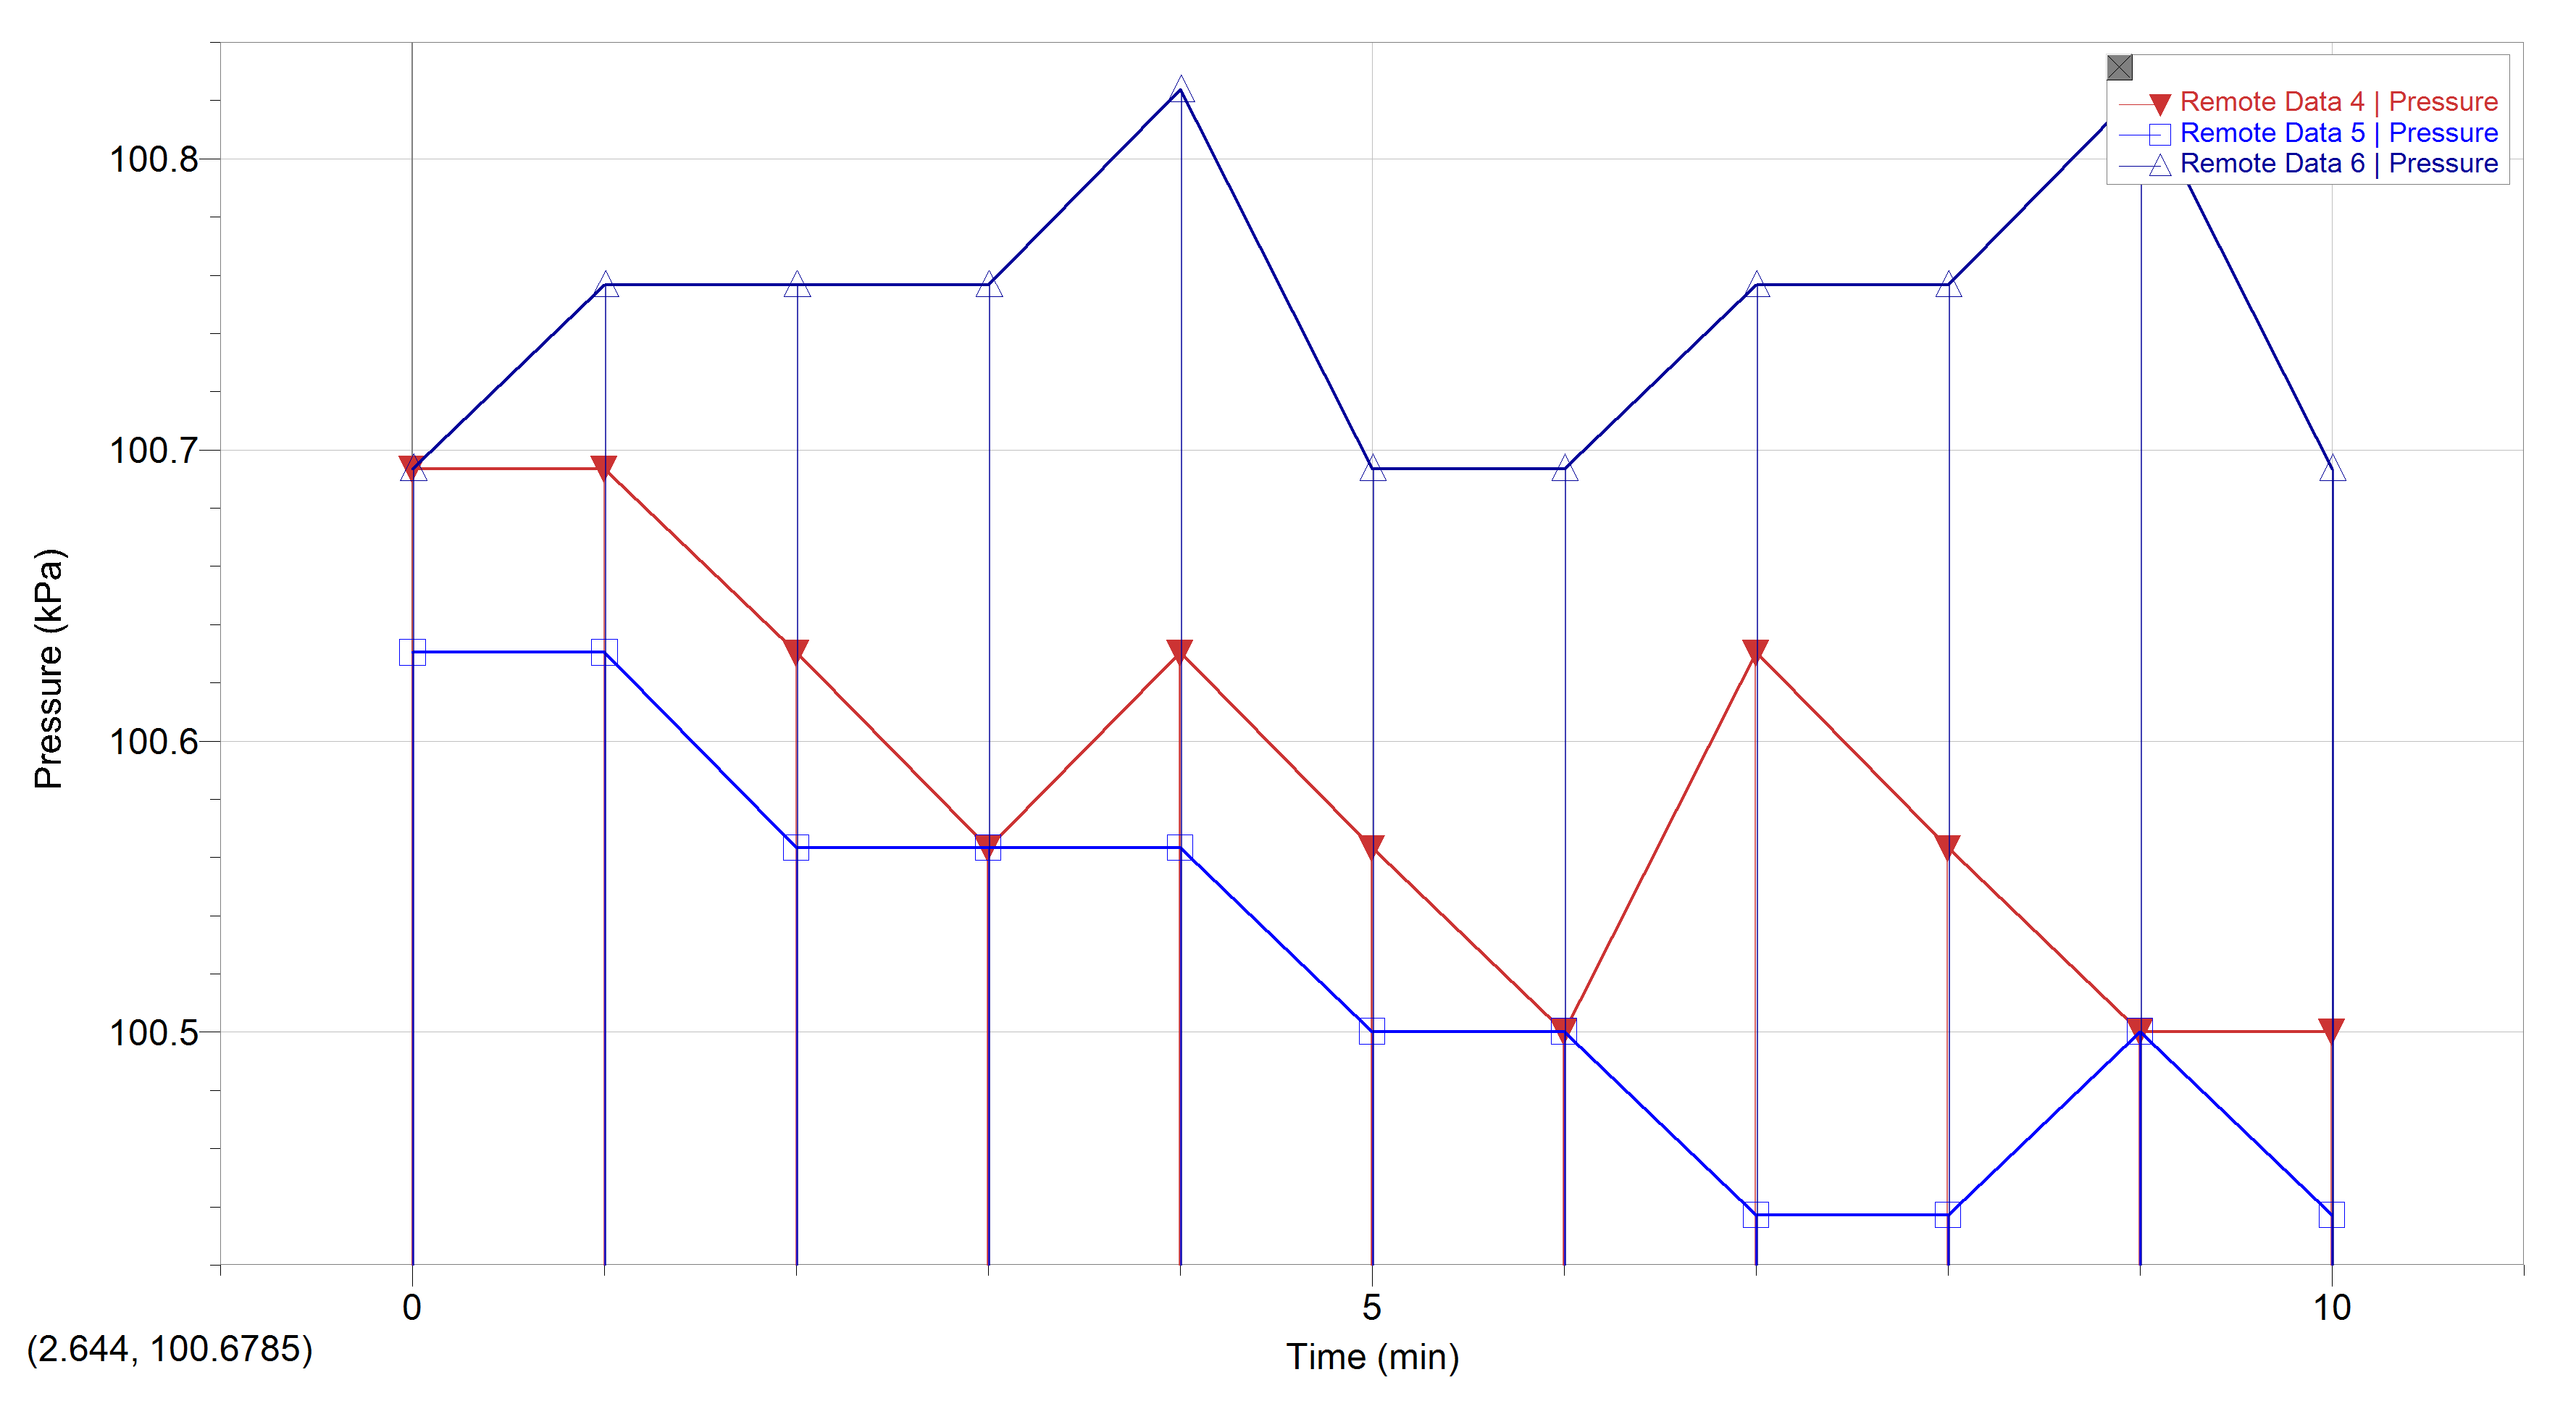
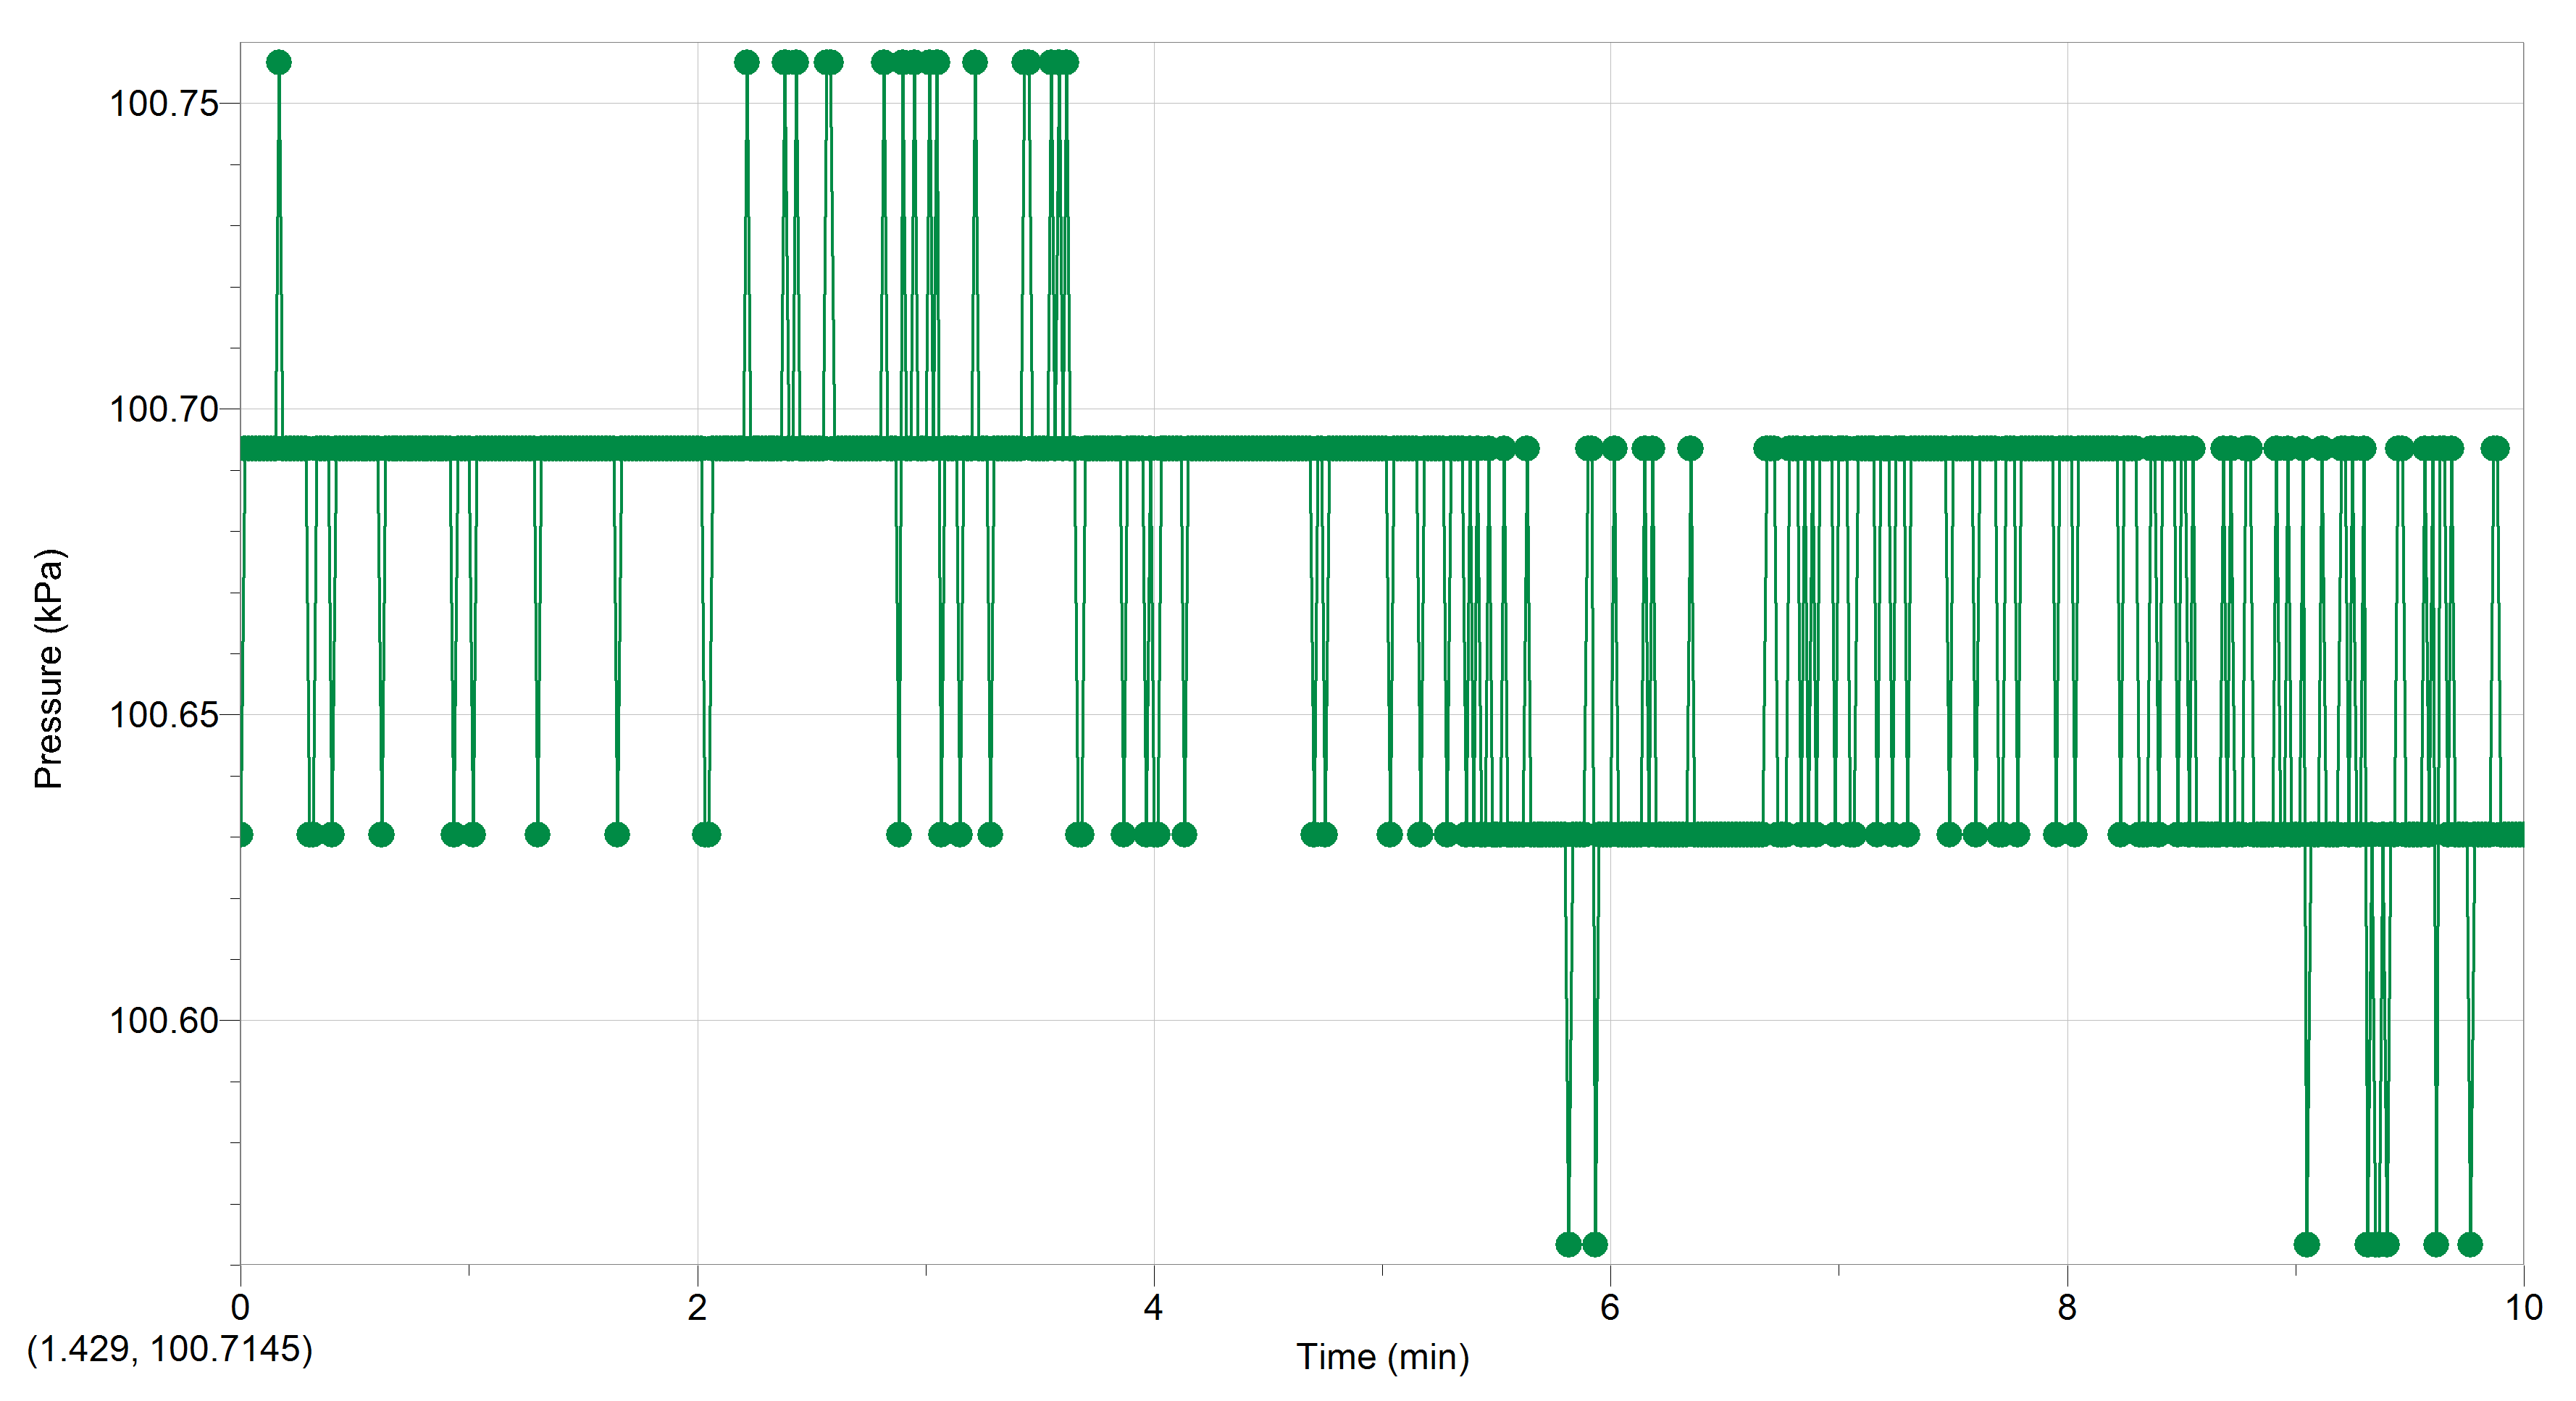
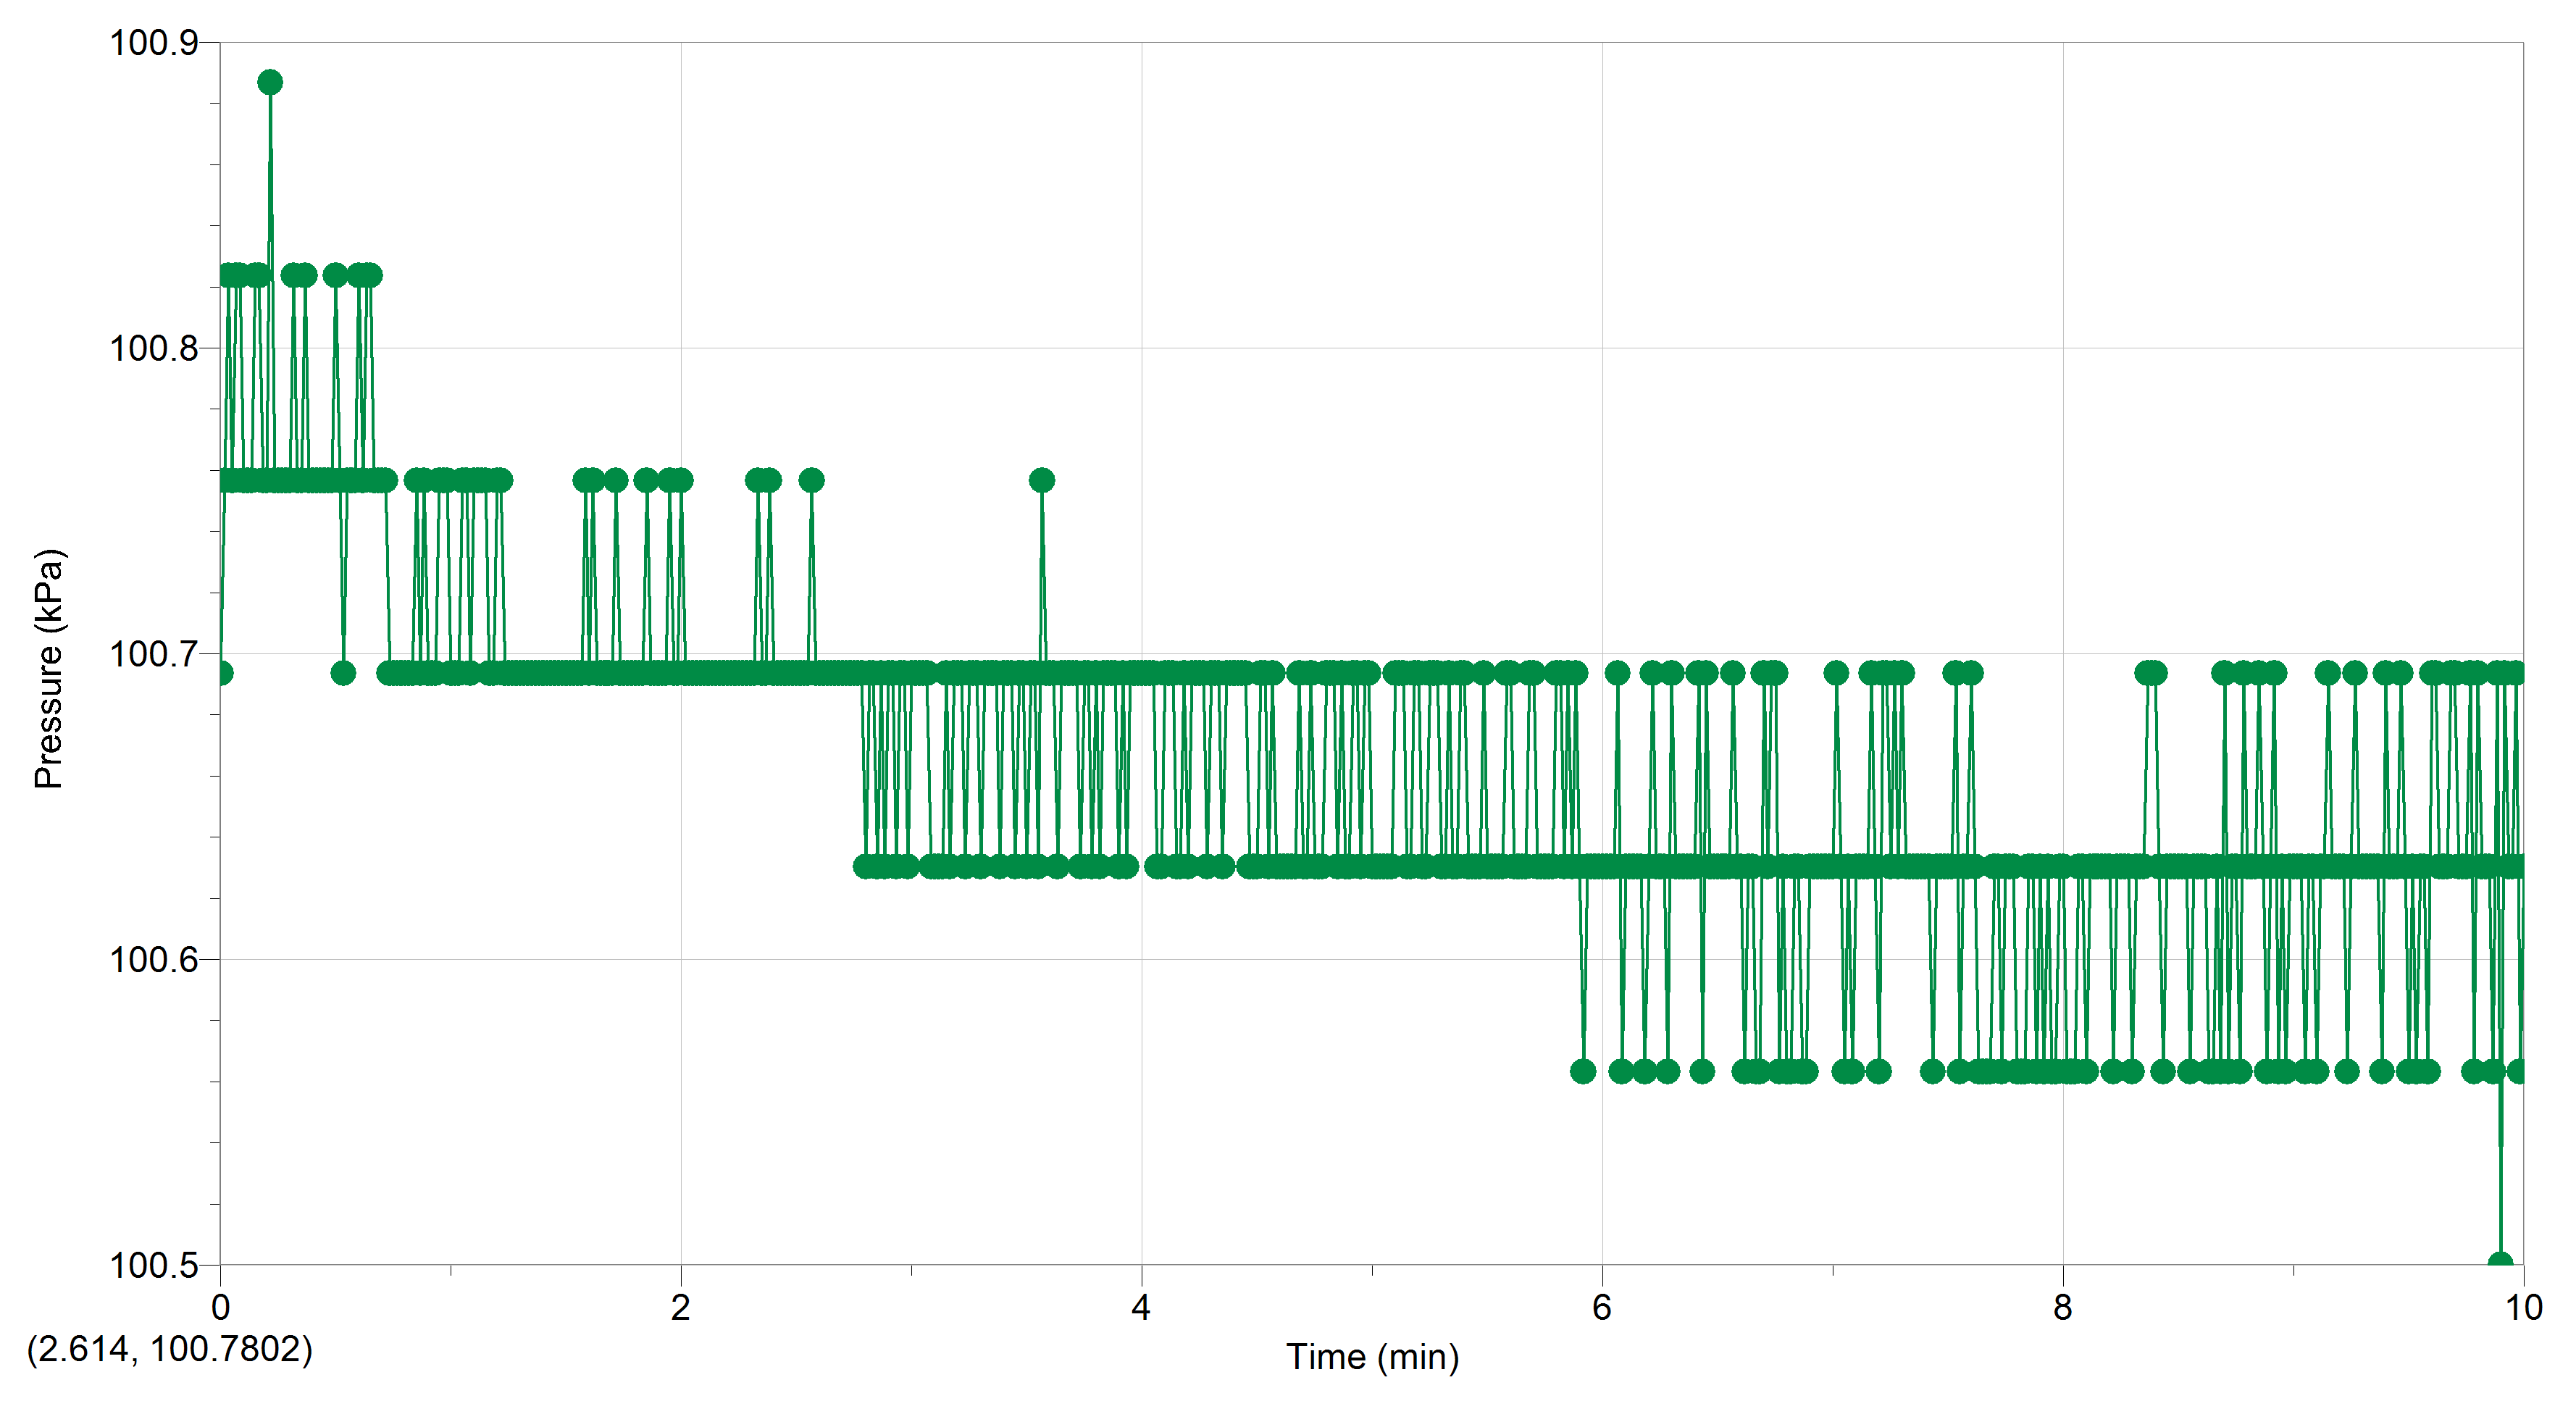
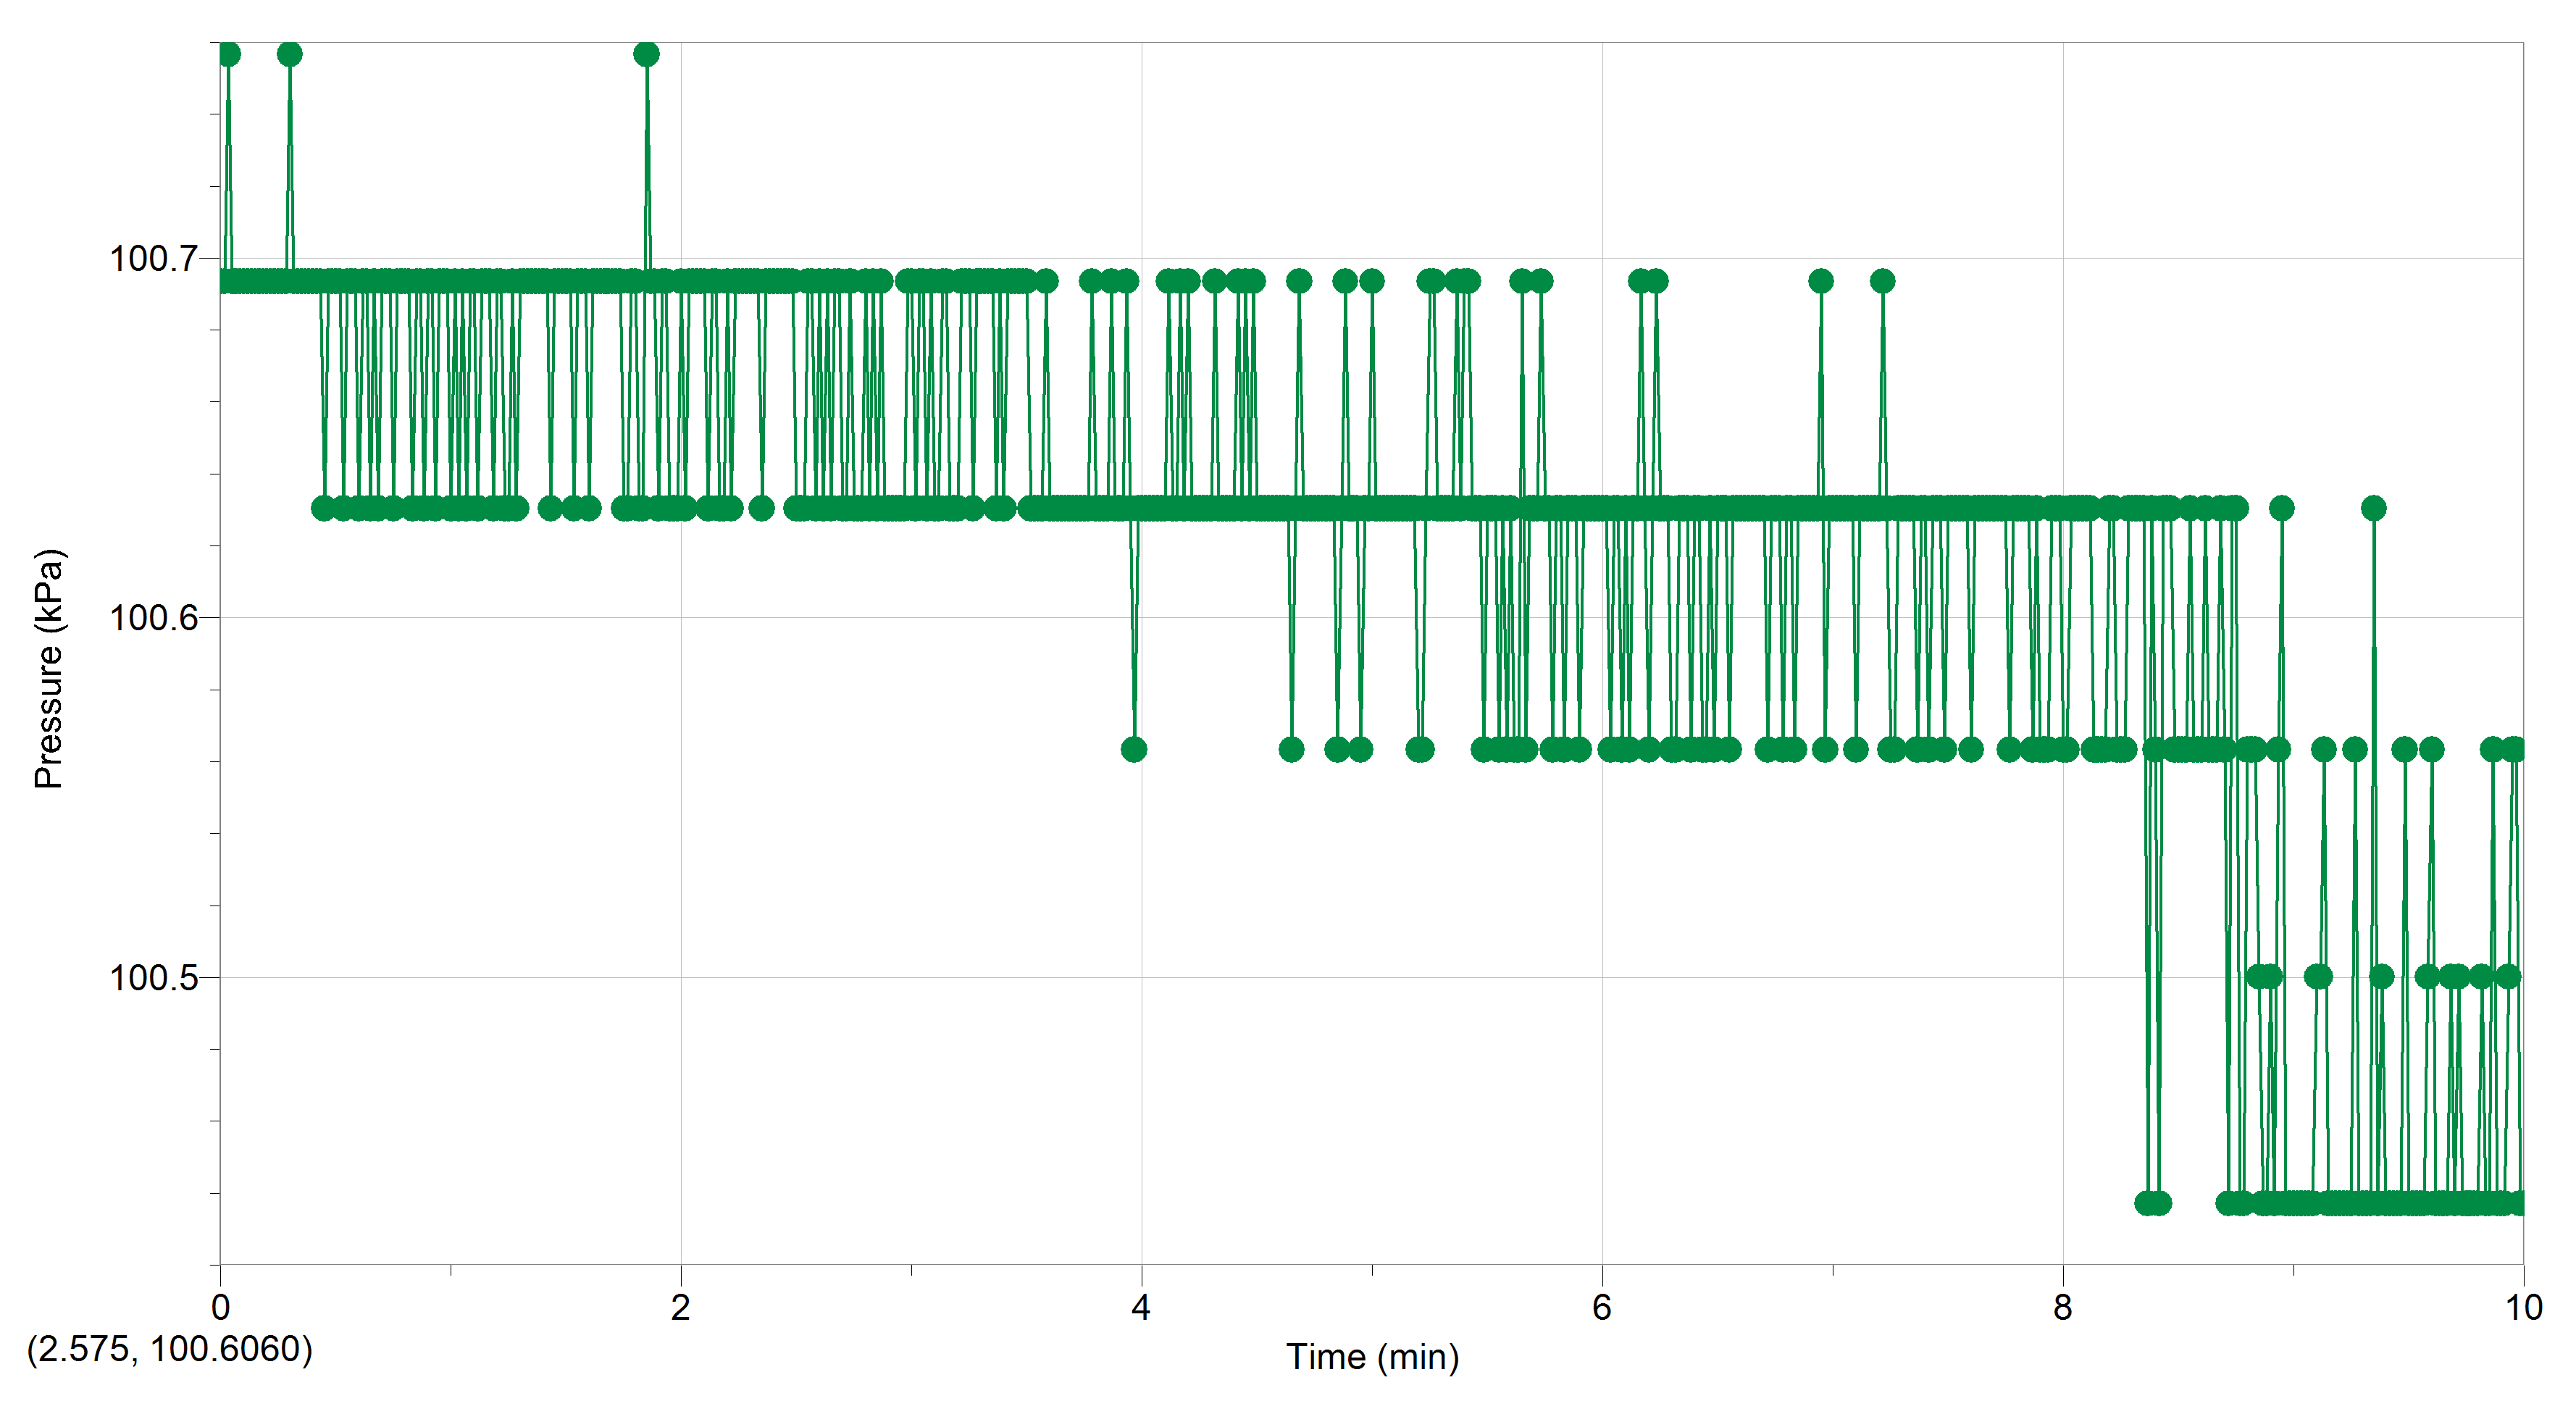
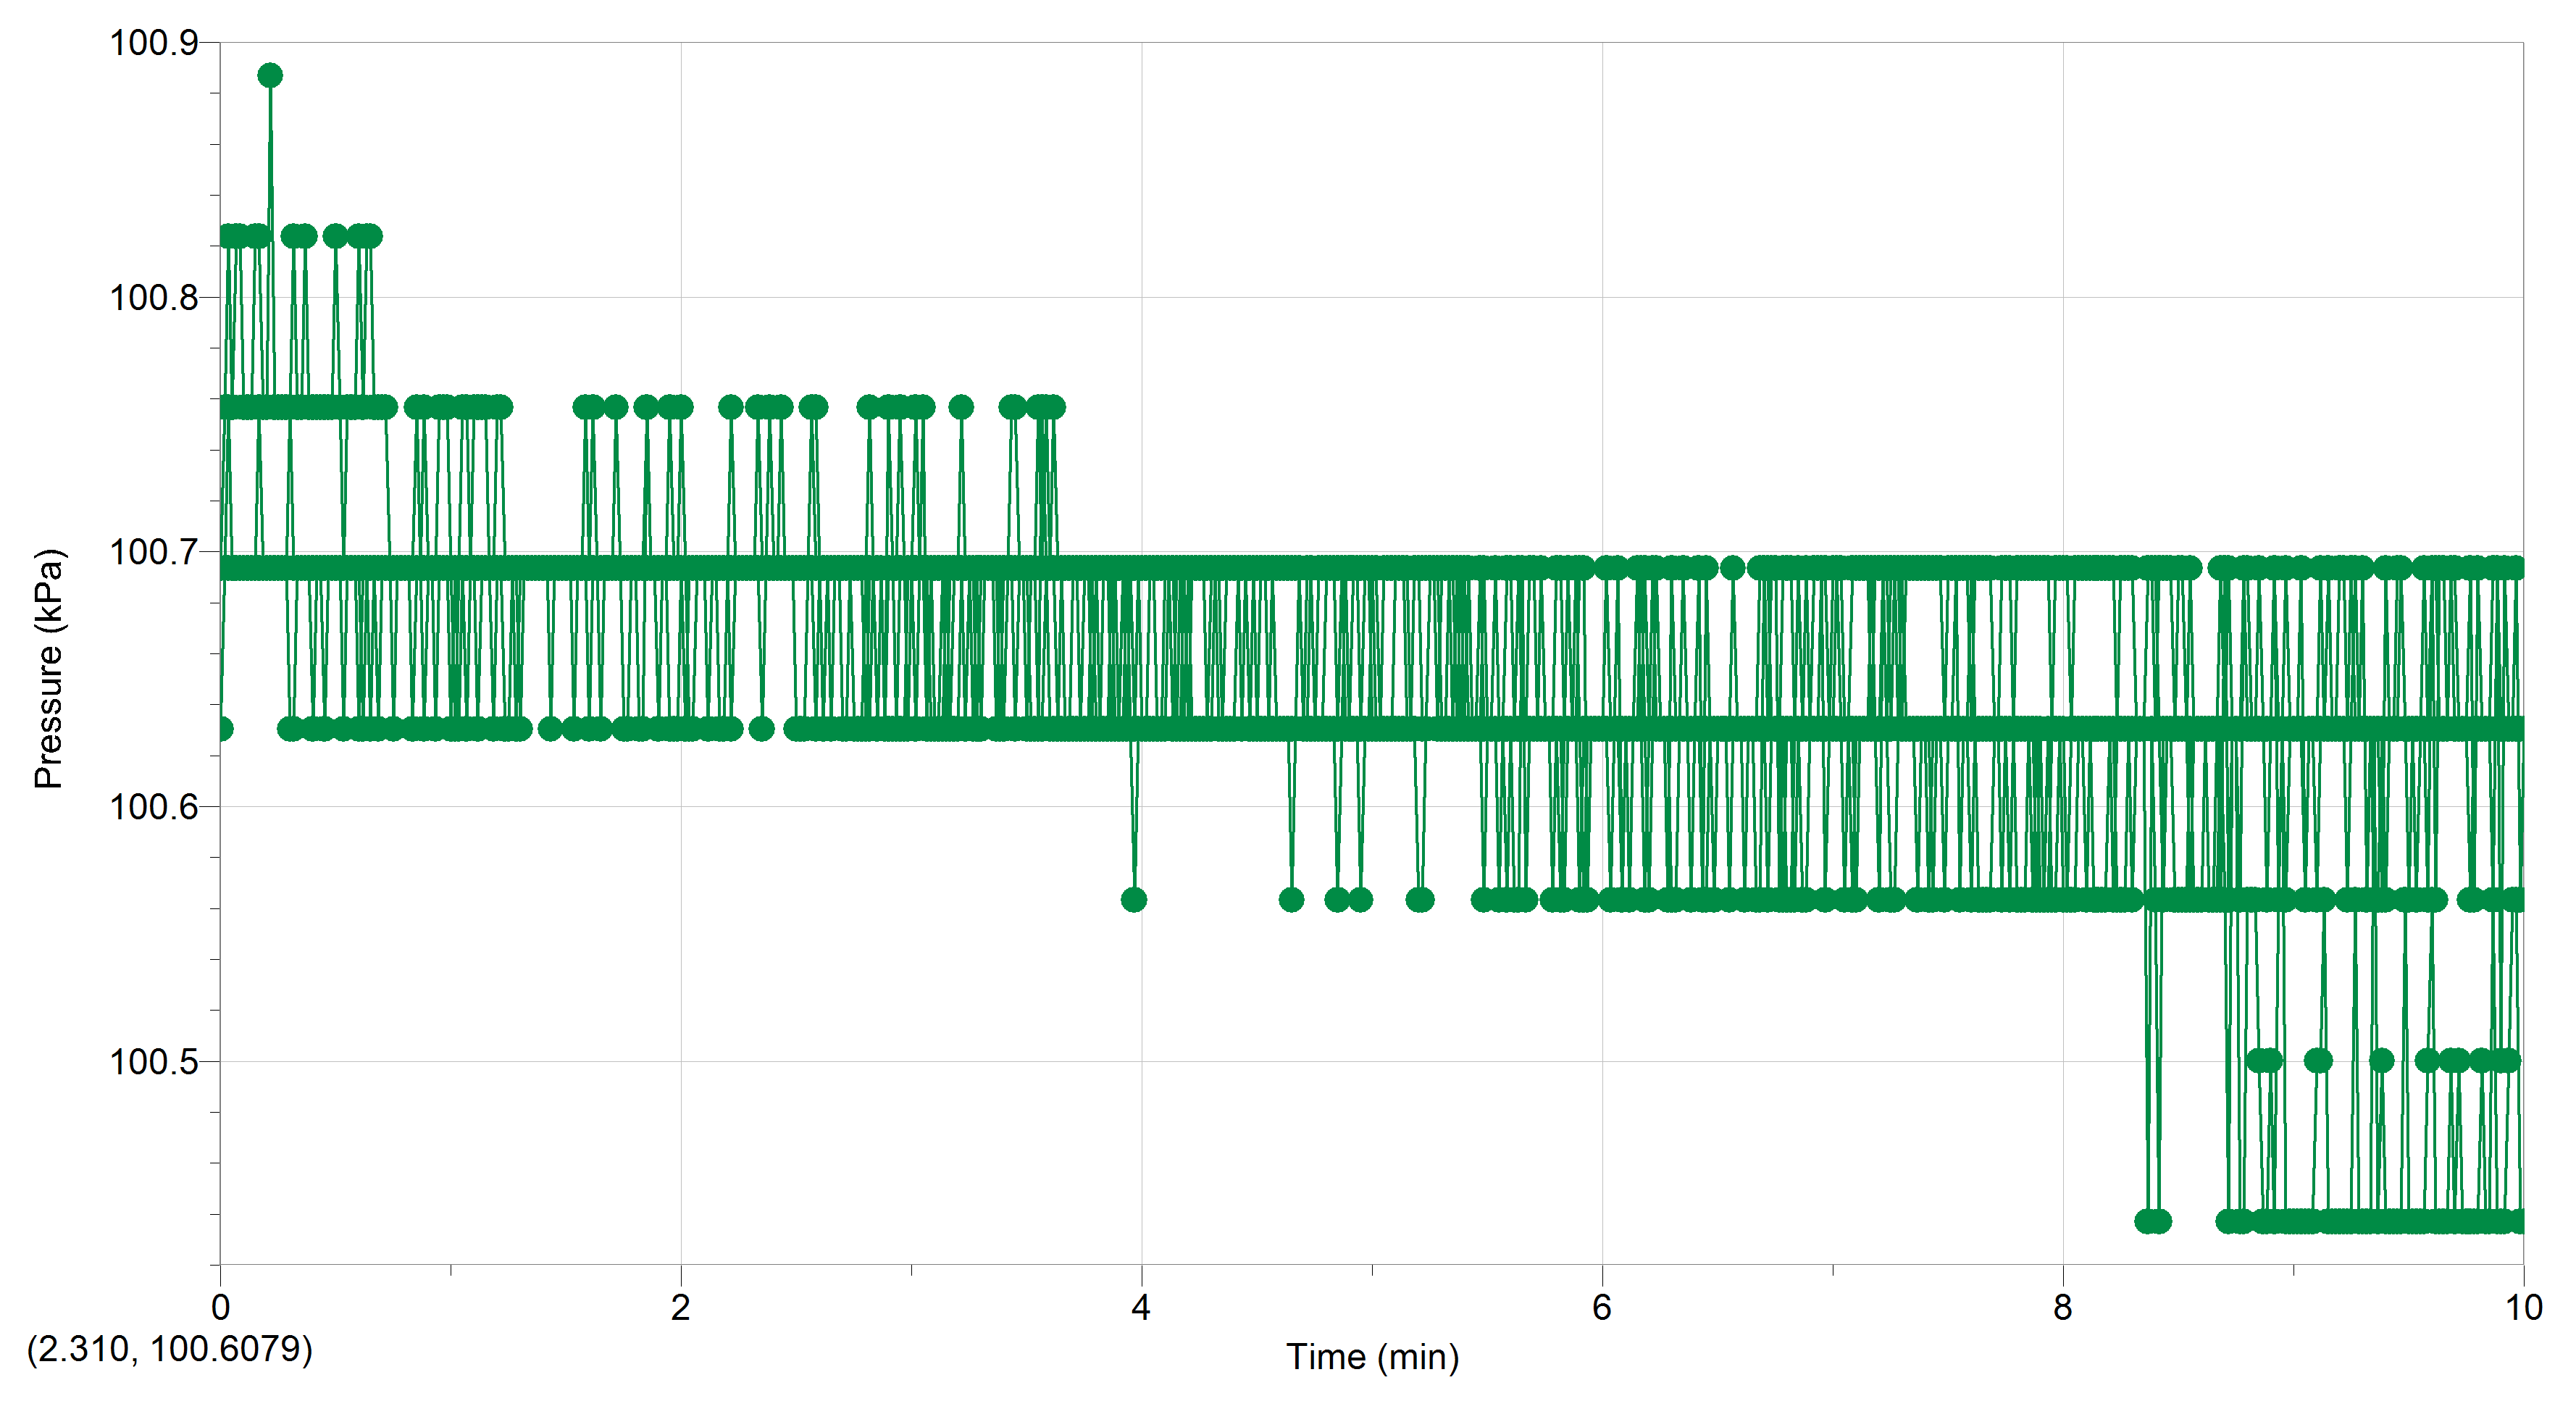
The next experiment involved the no light variable. The first trial exhibited an initial kPa of 100.695 with a final kPa of 100.5. Through the first five minutes of readings the kPa decreased at an average of 0.028 kPa per minute. Through the final five minutes the kPa decreased at an average of 0.039 kPa. The average kPa through the trial was 0.036 kPa per minute. The No Light Trial 1 graph exhibits minimal kPa through the first trial. The second trial exhibited an initial kPa of 100.63 with a final kPa of 100.44. Through the first five minutes of readings the kPa decreased at an average of 0.026 kPa per minute. Through the final five minutes the kPa decreased at an average of .012 kPa. The average kPa through the trial was .019 kPa per minute. The No Light Trial 2 graph exhibits minimal kPa through the second trial. The third trial exhibited an initial kPa of 100.69 and a final kPa of 100.69. Through the first five minutes of readings the kPa increased to a kPa of 100.82 and then returned to the initial kPa of 100.69. Through the final five minutes the kPa once again increased to a kPa of 100.82 and then returned to the initial kPa of 100.69. The No Light Trial 3 graph exhibits the mirrored display of increasing kPa and decreasing kPa within the trial. The combined three trials exhibited an average starting kPa of 100.67 and an ending kPa of 100.54 with an average kPa dissention of 0.15 kPa.
No Light Trial 1
No Light Trial 2
No Light Trial 3
No Light Combined Trials 1, 2, 3
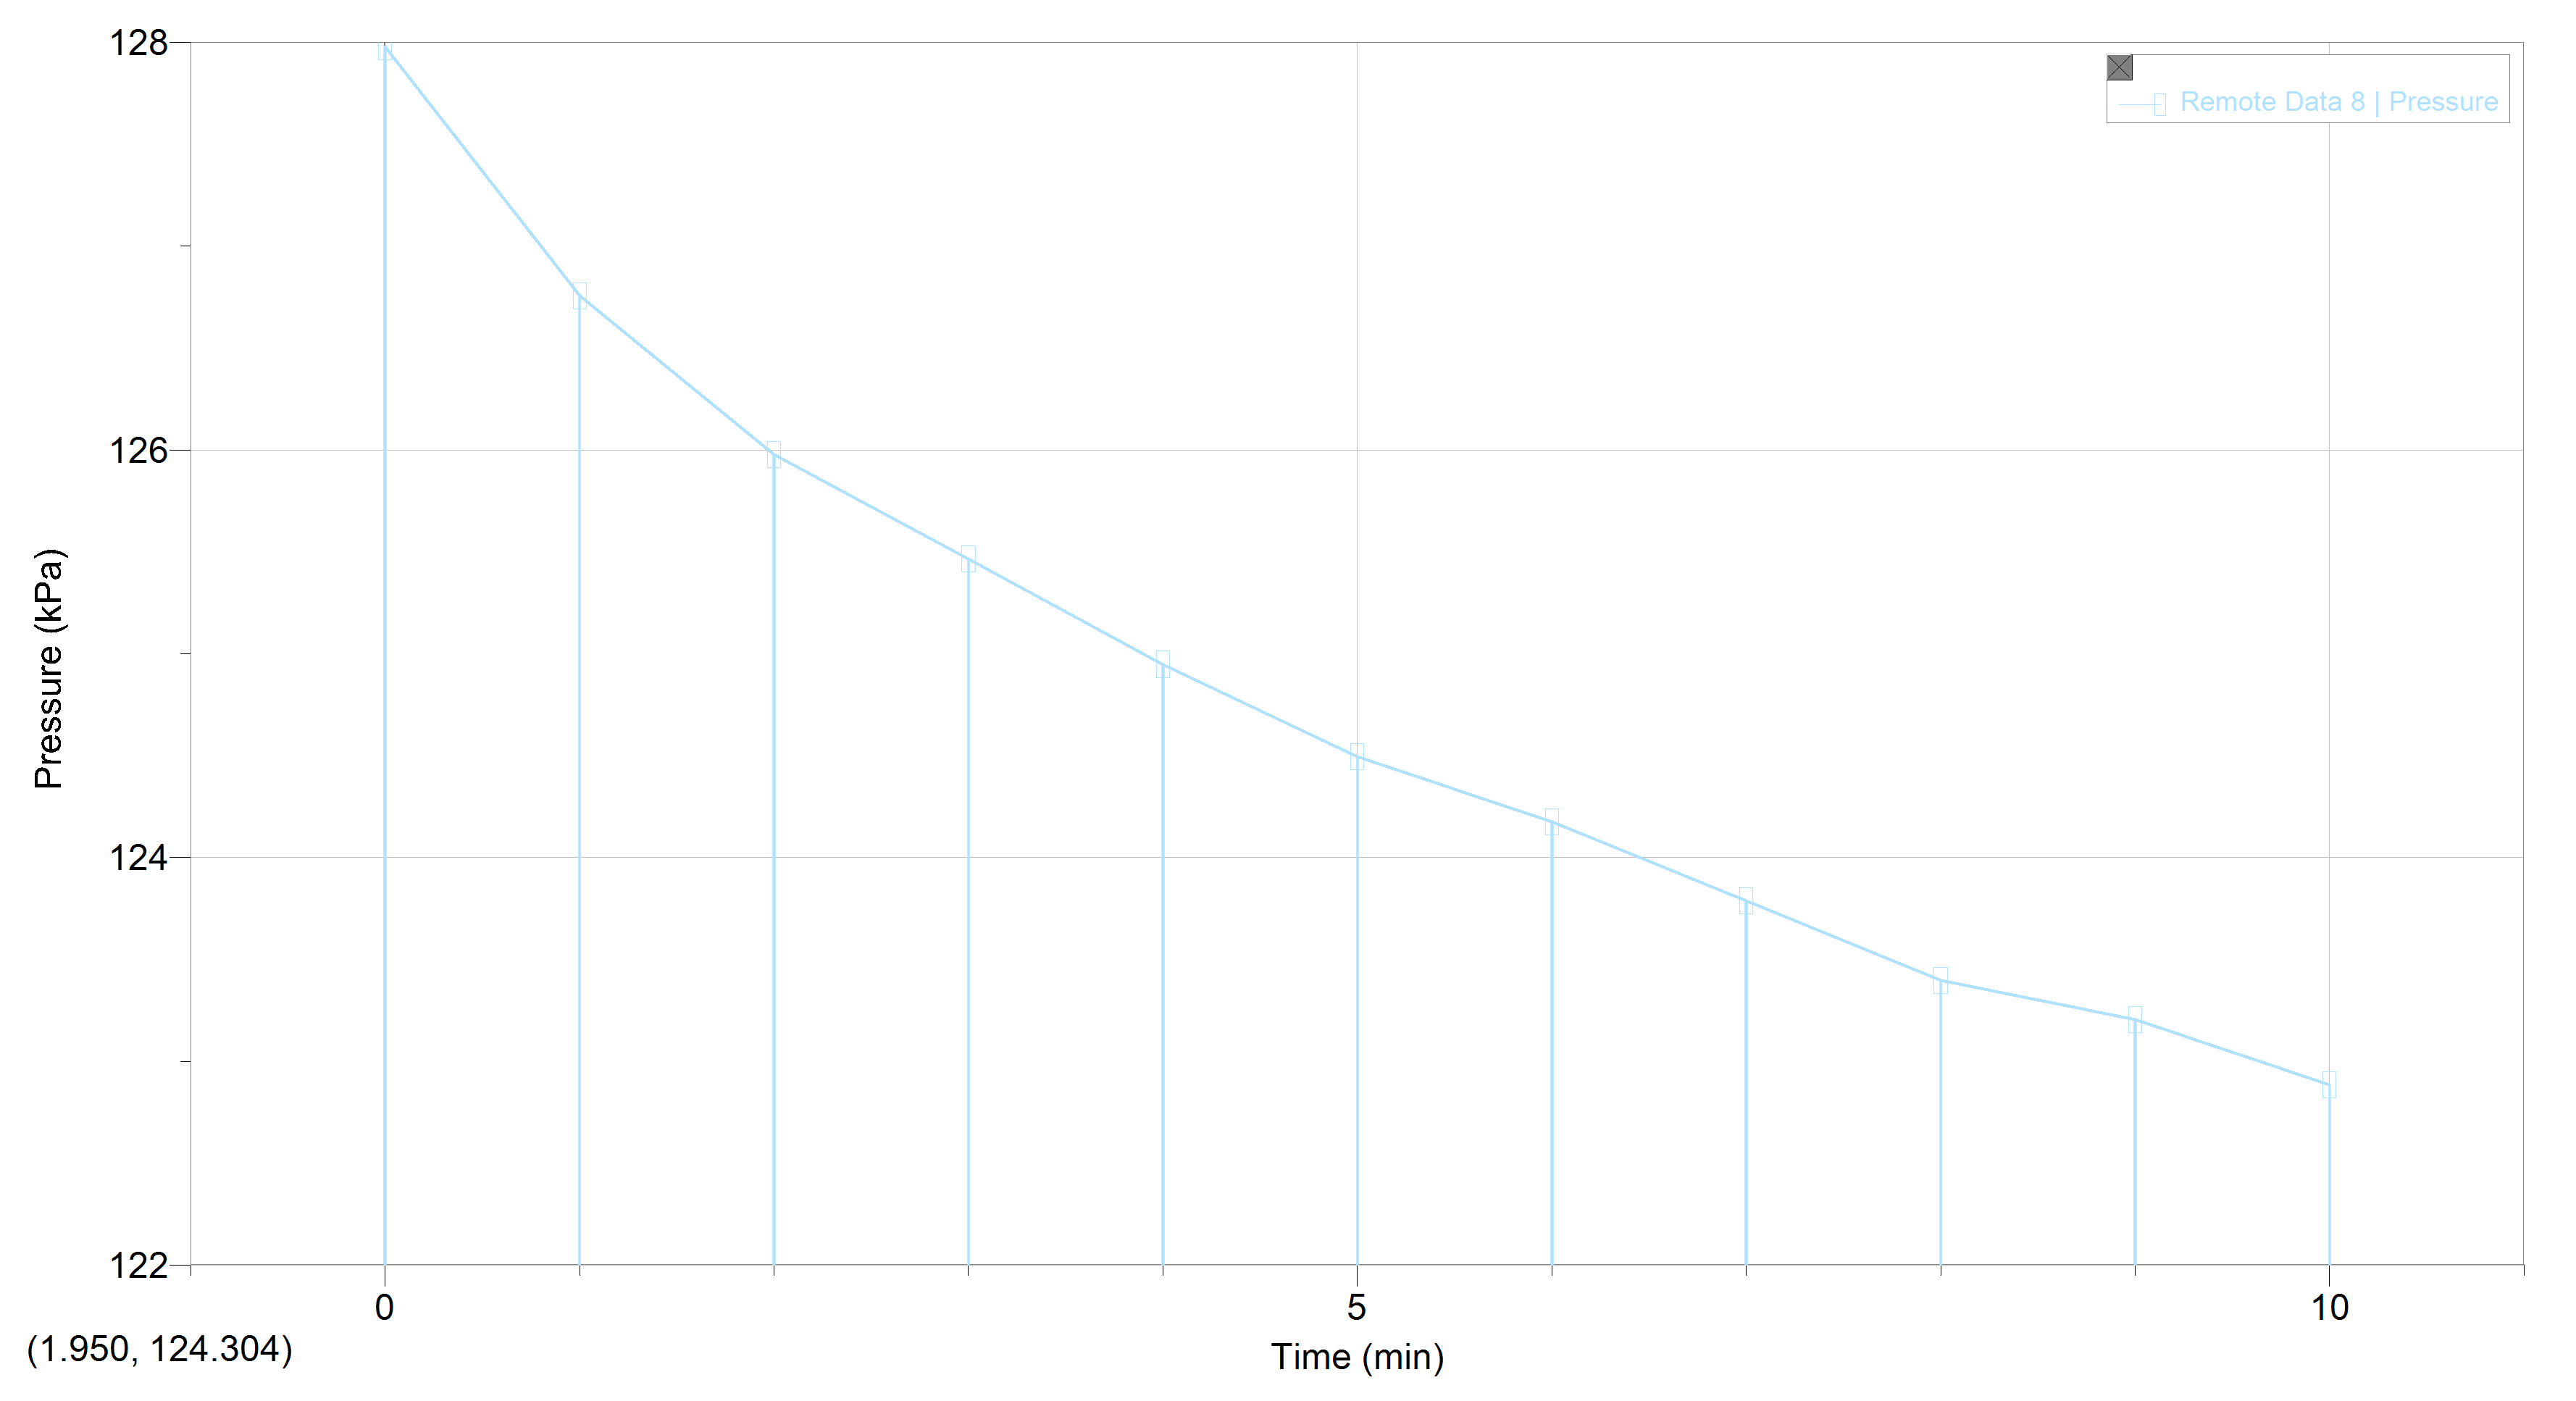
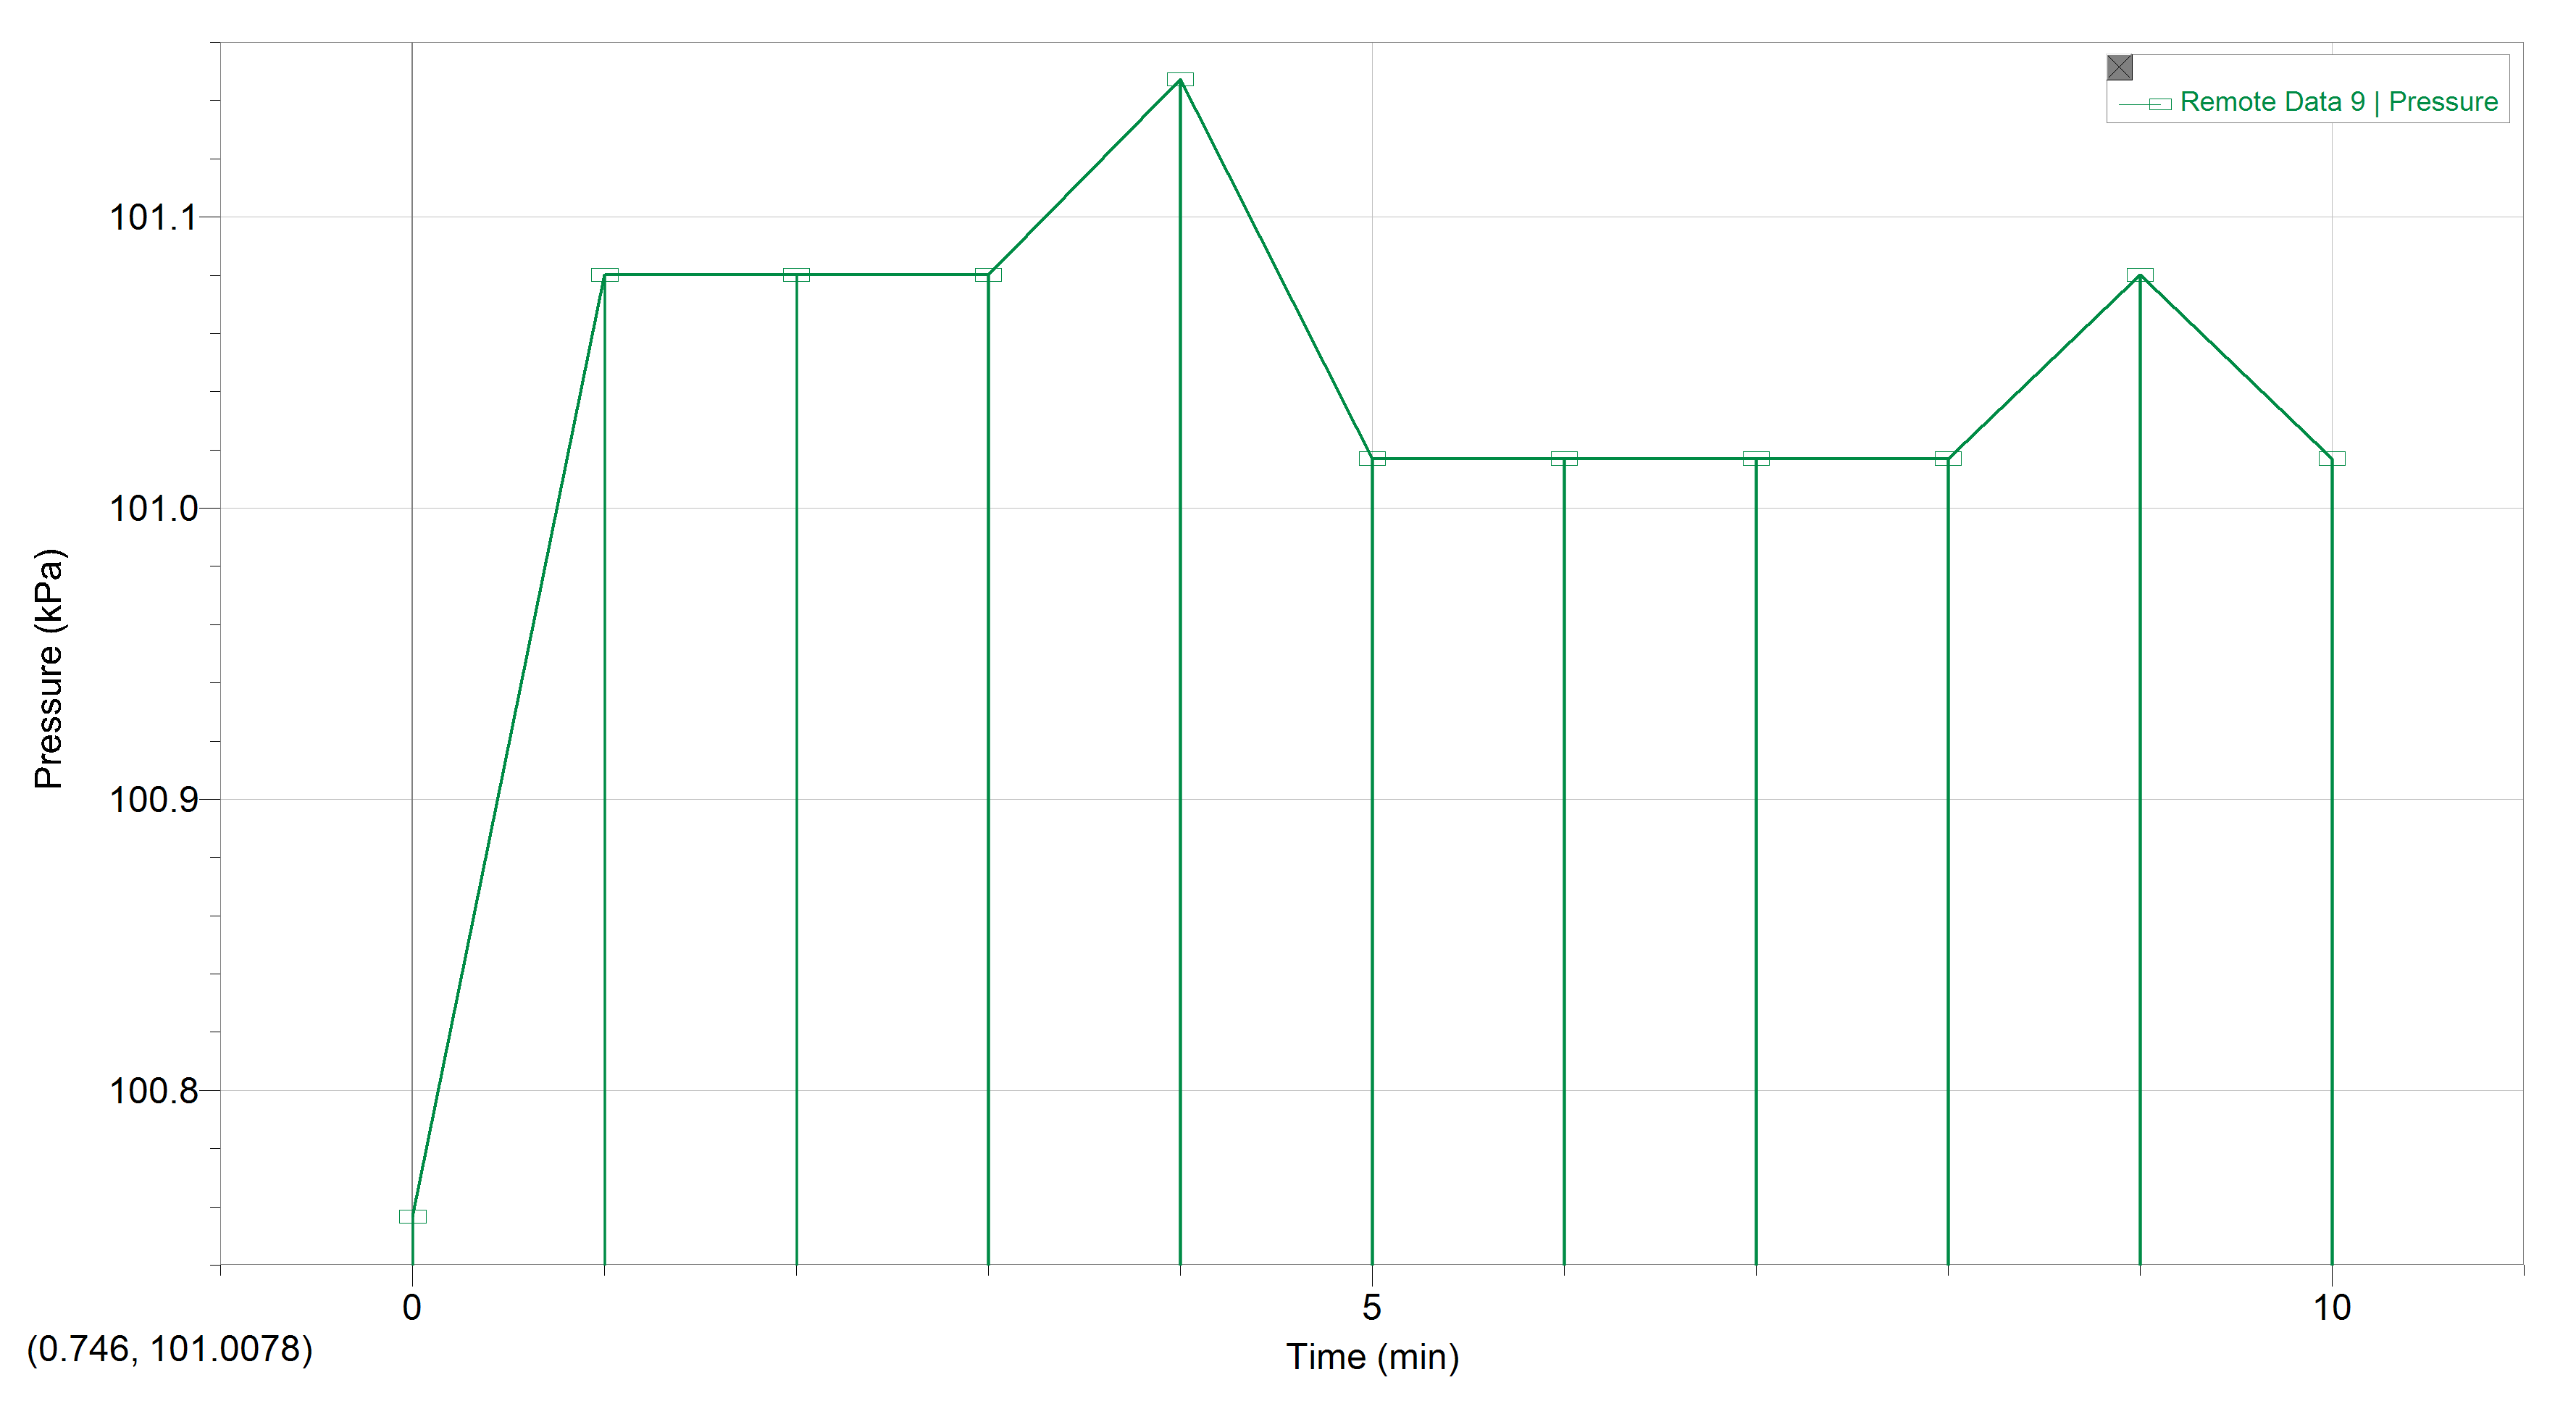
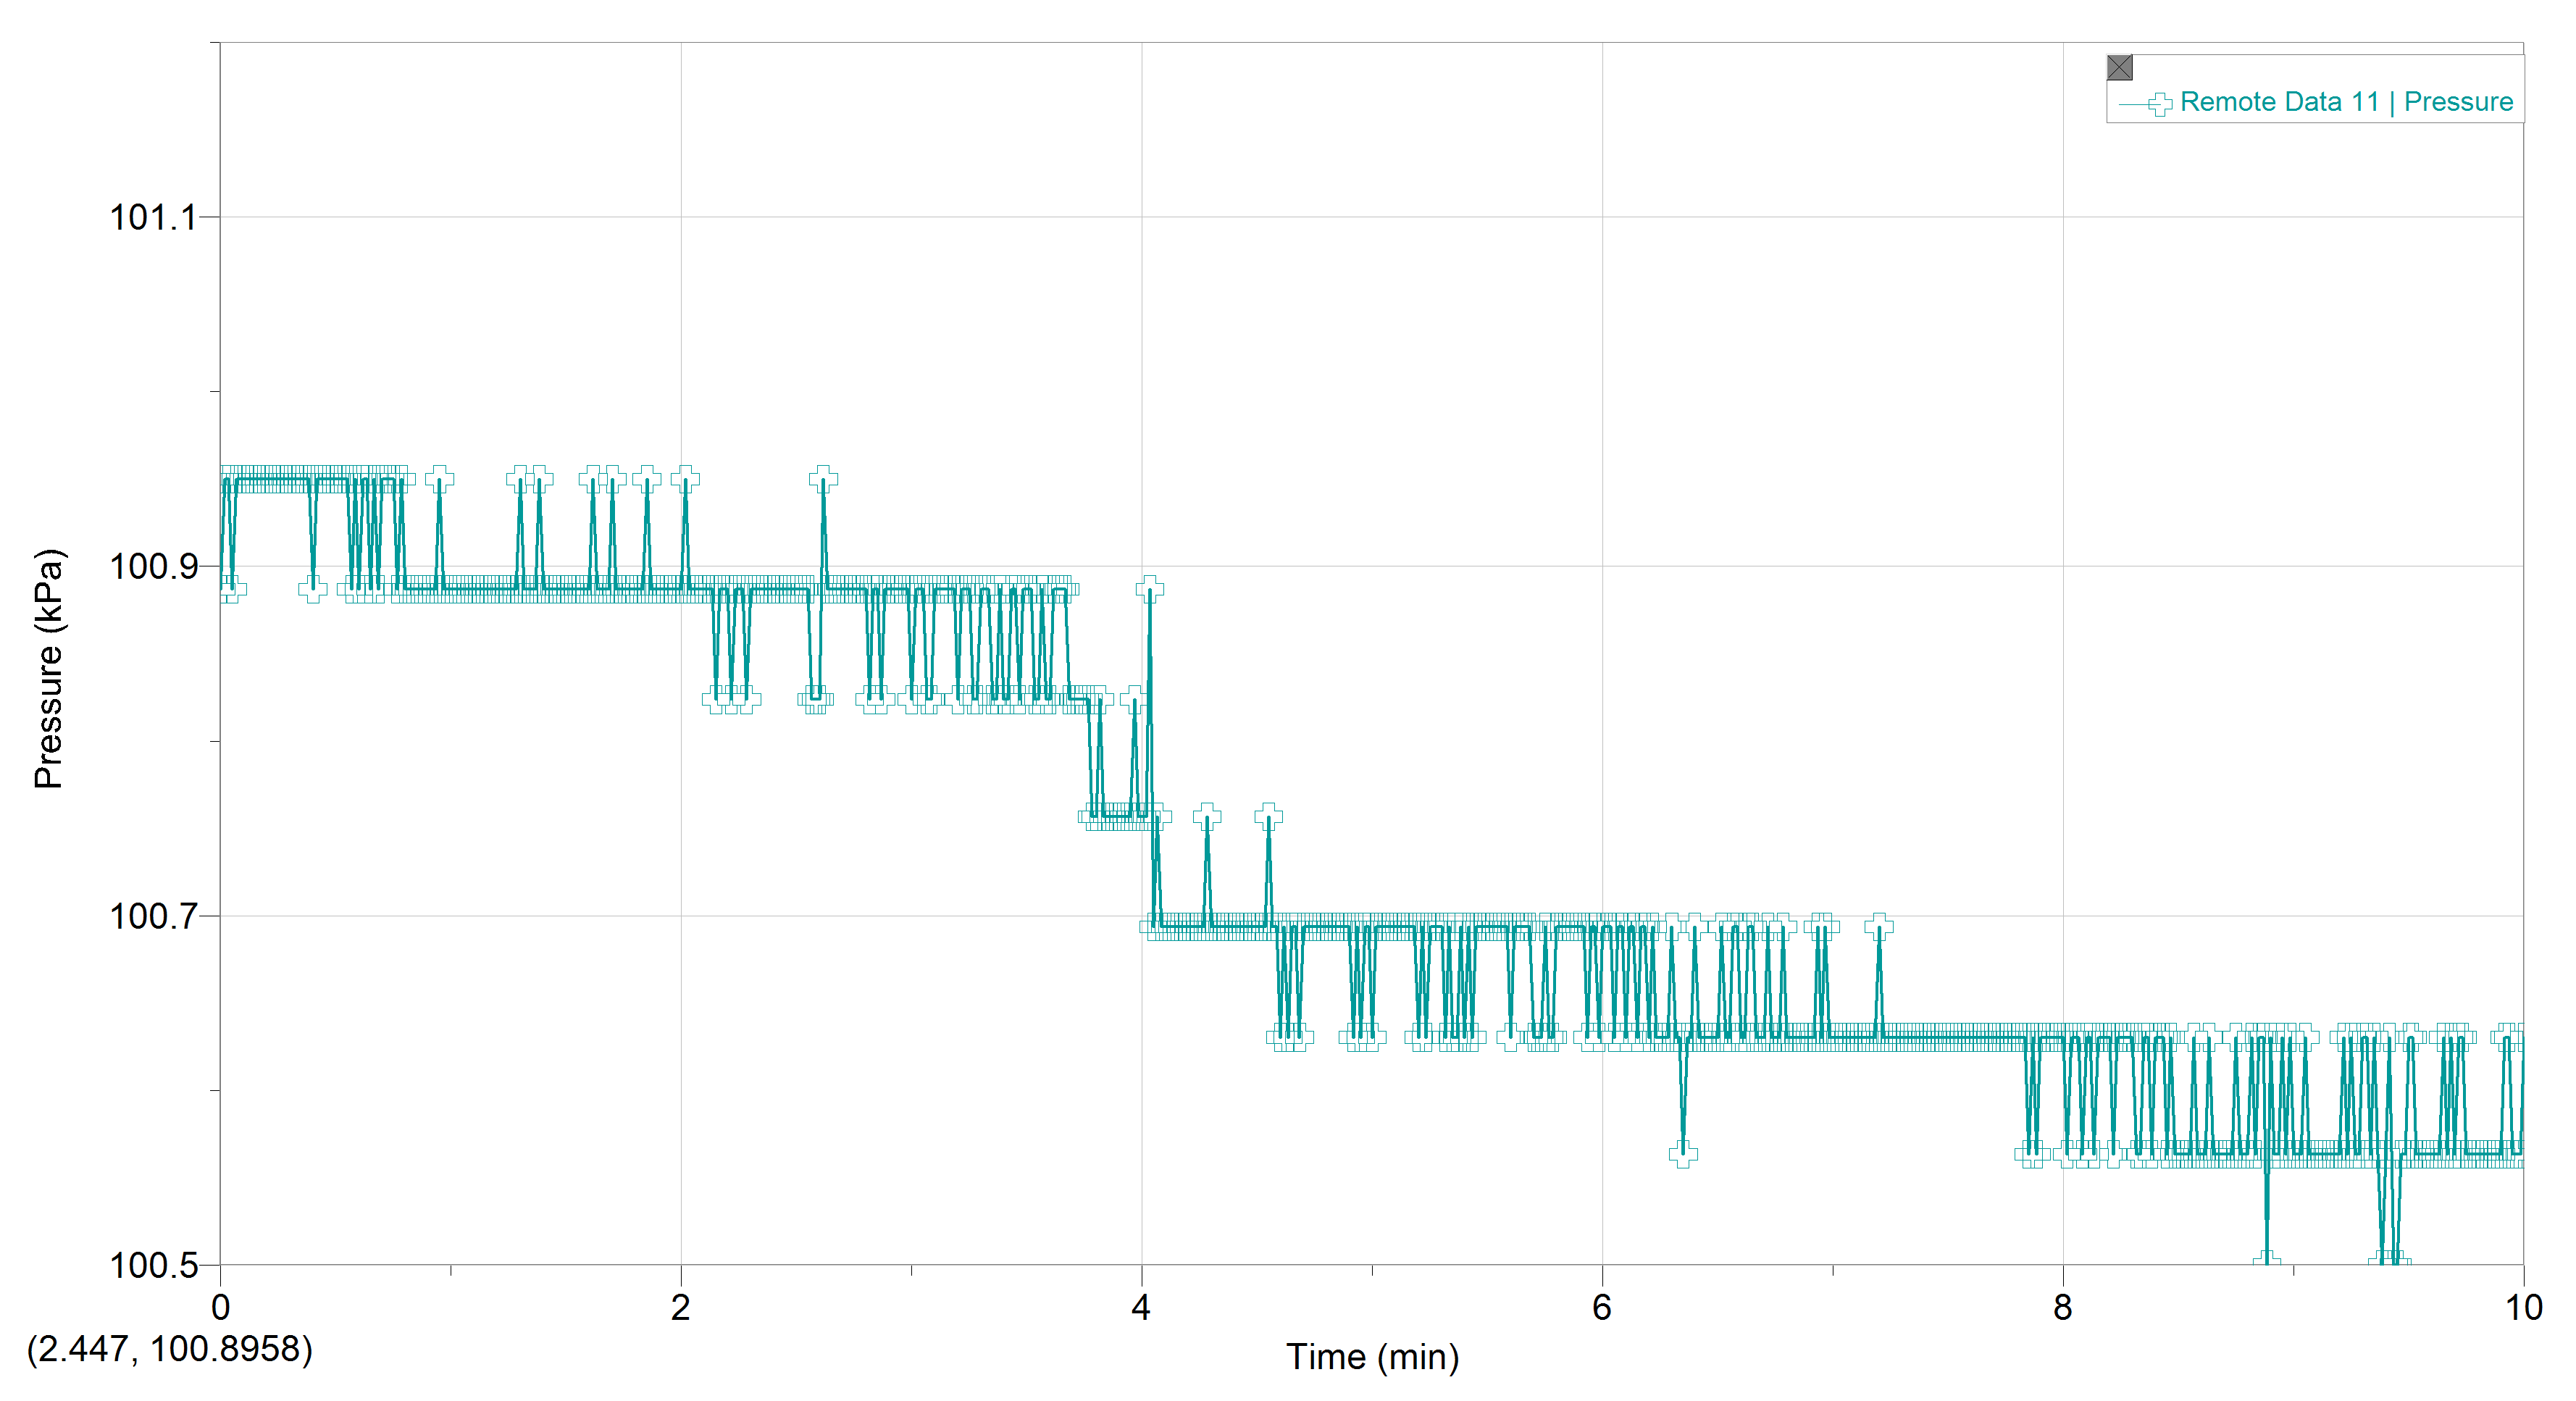
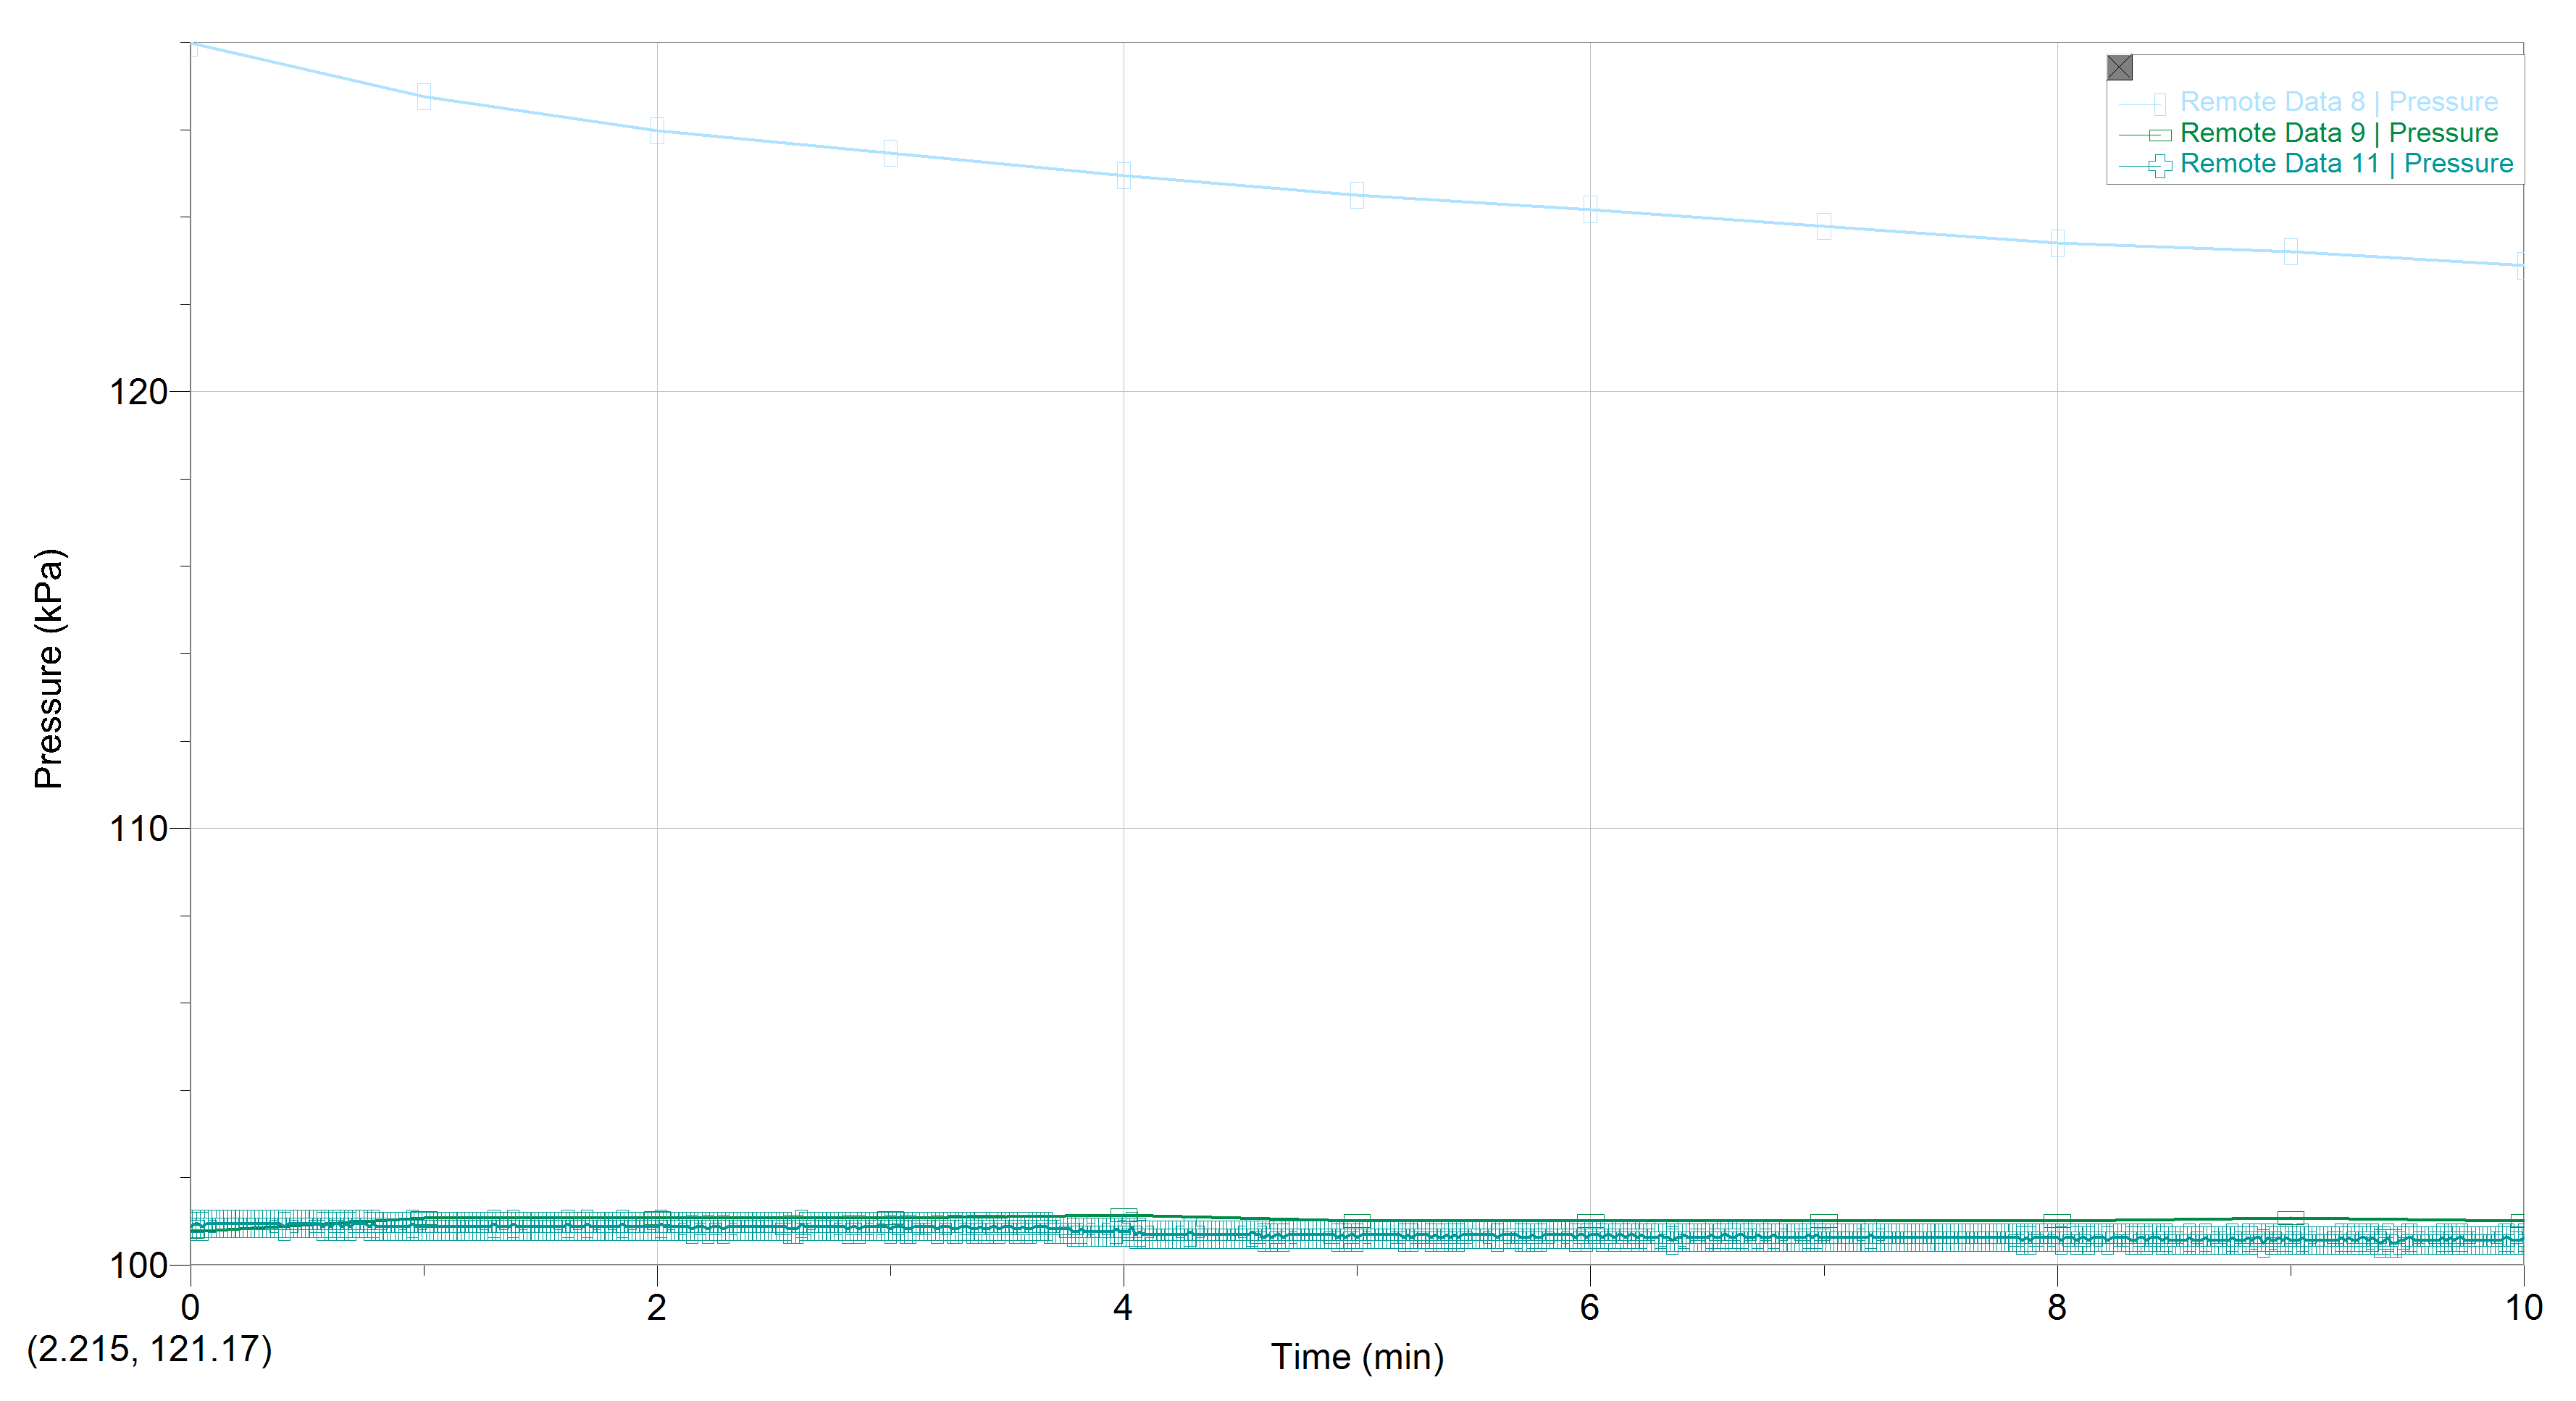
The next experiment involved the Continuous Light variable. The first trial exhibited an initial kPa of 128.0 with a final kPa of 123.0. Through the first five minutes of readings the kPa decreased at an average of 0.55 kPa per minute. Through the final five minutes the kPa decreased at an average of 0.25 kPa. The average kPa through the trial was .08 kPa per minute. The Continuous Light Trial 1 graph exhibits a higher kPa with minimal dissention. The second trial exhibited an initial kPa of 100.6 with a final kPa of 101.1. Through the first five minutes of readings the kPa increased at an average of .028 kPa per minute. Through the final five minutes the kPa started and ended at a kPa of 101.1 with minimal activity. The average kPa through the trial was an increase of 0.38 kPa per minute. The Continuous Light Trial 2 graph exhibits the increase of kPa through the second trial. The third trial exhibited an initial kPa of 100.95 with a final kPa of 100.6. Through the first five minutes of readings the kPa decreased at an average of 0.06 kPa per minute. Through the final five minutes the kPa decreased at an average of 0.02 kPa. The average kPa through the trial was .008 kPa per minute. The Continuous Light Trial 3 graph exhibits minimal dissention of kPa through the third trial. The combined three trials exhibited an average starting kPa of 109.85 and an ending kPa of 108.23 with an average kPa increase of 0.041 kPa.
Continuous Light Trial 1
Continuous Light Trial 2
Continuous Light Trial 3
Continuous Light Trial 1, 2, 3
The final experiment involved the Half-Light/Half-Dark variable. The first trial exhibited an initial kPa of 100.63 with a final kPa of 100.63. Through the first five minutes of readings there was no change in kPa. Through the final five minutes the kPa showed no change in kPa. The average kPa through the trial was 0.00 kPa per minute. The Half-Light/Half-Dark Trial 1 graph exhibits minimal kPa with no ultimate change in kPa at the minute measurement points. The second trial exhibited an initial kPa of 100.7 with a final kPa of 100.4. Through the first five minutes of readings there was no change in kPa. Through the final five minutes the kPa decreased at an average of .04 kPa. The average kPa through the trial was .02 kPa per minute. The Half-Light/Half-Dark Trial 2 graph exhibits minimal kPa through the second trial. The third trial exhibited an initial kPa of 100.7 and a final kPa of 100.42. Through the first five minutes of readings there was no change in kPa. Through the final five minutes the kPa decreased at an average of 0.052 kPa. The average kPa through the trial was .02 kPa per minute. The Half-Light/Half-Dark Trial 3 graph exhibits minimal dissention of kPa through the third trial. The combined three trials exhibited an average starting kPa of 100.68 and an ending kPa of 100.48 with an average kPa dissention of 0.013 kPa.
Half Light / Half Dark Trial 1
Half Light / Half Dark Trial 2
Half Light / Half Dark Trial 3
Half Light / Half Dark Trials 1, 2, 3
DISCUSSION
The experiment’s results supported the original hypothesis if the tested plant species is exposed to more light under a controlled level of moisture, then the plant species transpiration level will increase due to the result of the light stimulating the opening of the plants stomata mechanism. The plant used was a common plant known as Devil’s Ivy which had durable stems to insert into the tubing. The following are the overall results for the variables tested. The combined three trials of the Normal Light variable exhibited an average starting kPa of 107.85 and an ending kPa of 106.1 with an average kPa dissention of 0.15 kPa; the combined three trials of the No Light variable exhibited an average starting kPa of 100.67 and an ending kPa of 100.54 with an average kPa dissention of 0.15 kPa; the combined three trials of the Continuous Light variable exhibited an average starting kPa of 109.85 and an ending kPa of 108.23 with an average kPa increase of 0.041 kPa; and the combined three trials of the Half-Light/Half-Dark variable exhibited an average starting kPa of 100.68 and an ending kPa of 100.48 with an average kPa dissention of 0.013 kPa. The results prove more light does stimulate transpiration. Additionally, the Continuous Light variable yielded the highest kPa. The Normal Light variable was only 2.0 kPa less of a starting point and ended on approximately the same dissention of kPa as the Continuous Light variable. The No Light variable exhibited the least amount of transpiration proving light is a necessity to stimulate the transpiration process. The Half-Light/Half-Dark variable is not reliable as the testing was completed immediately following the 12 hours of dark. A better test would have been to do another variable of Half-Light/Half-Dark and immediately test the kPa following the 12 hours of light. Moreover, a more inclusive variable should have included a strobe light variable to test the effects of rapid light intervals on the plant’s transpiration.
Lastly, the experiment supported the testing administered to include different trials and supported results. Corrections for future experiments and research should include altitude differential, temperature changes, moisture changes, color filters, etc. Including these more extensive variables could prove the likeliness to determine ultimate transpiration requirements which could bode better plant production. Also, it would be smart to do several different full experiments including different plant species due to the fact different plants require different elements to thrive in their environments.
REFERENCES
Kubota, Chieri. Growth, Development, Transpiration and Translocation as Affected by Abiotic Environmental Factors. 2016. ScienceDirect & Elsevier B.V. https://www.sciencedirect.com/topics/agricultural-and-biological-sciences/transpiration
- Perlman, Howard. Transpiration – The Water Cycle. 2016. United States Geological Survey. https://water.usgs.gov/edu/watercycletranspiration.html
- Stomata. 2018. Maximum Yield Inc. https://www.maximumyield.com/definition/671/stomata-botany
- Transpiration. 16 May 2011. http://www.biology-pages.info/T/Transpiration.html
- Transpiration – Water Movement through Plants. 2018. USDA/NIFA. Plant and Soil Sciences eLibrary. https://passel.unl.edu/pages/informationmodule.php? idinformationmodule=1092853841&topicorder=6
Cite This Work
To export a reference to this article please select a referencing stye below:
Related Services
View all


DMCA / Removal Request
If you are the original writer of this essay and no longer wish to have your work published on UKEssays.com then please click the following link to email our support team:
Request essay removal