Testing of Aggregates Analysis
| ✅ Paper Type: Free Essay | ✅ Subject: Engineering |
| ✅ Wordcount: 3646 words | ✅ Published: 31 Aug 2017 |
This research was conducted at Englobe Corp laboratory located in Dartmouth, Nova Scotia. It was performed under the direction of Mr. Mark Downie. The laboratory supervision was provided by Mr. Daniel McMorran.
The quality of the aggregates in the construction materials, asphalt concrete is determined by various tests out of which Los Angeles, Micro Deval and Soundness are most widely used in construction industry. Los Angles Abrasion test and Micro Deval test involve the spinning of aggregates in a close vessel where there are spun in a medium of water or air. The vessel is filled with contact charges (Iron sphere) for a specific amount of time.
The analysis of particle degradation using mechanical test can be classified in two class, fragmentation and wearing. The sample that has more wide range of grain size ( e.g. 1250 gm of ) indicates fragmentation and has a well graded distribution curve whereas the sample that has poor range of grain size( 5000gm of…) indicates wearing with a bad graded distribution curve.
Soundness test involves testing the durability of the aggregates using sodium sulphate or magnesium sulphate solution. Samples of different grain sizes are washed and dried and kept in salt solution for 16 hours and then kept in oven to dry. This cycle is repeated for seven days and then the sample is weighed to see the loss of sample. This test usually received poor rating for its inconsistent repeatability and correlations.
Standard Testing methods
- Los Angeles Abrasion Test AASHTO T96 ( ASTM C131)
- Micro Deval Test AASHTO T327 (ASTM D6928)
- Sodium and Magnesium Sulfate Soundness AASHTO T 104 (ASTM C88)
As Per American Standard of Testing Materials following pass-fail criteria were used: –
- LA abrasion: Passed if loss ≤ 40%
- Micro Deval: Passed if loss ≤ 18%
- Sodium Sulphate Soundness: Passed if ≤12%
If the aggregates passed the above criteria, then they are durable.
Los Angeles Abrasion test involves the test to measure the degradation of the aggregates by creating actions like impact, abrasion, grinding and constant wear and tear inside a rotating steel drum. The steel drum spins for a specific time with a specific number of steel balls of specific weight to create an abrasion of aggregates. The number of steel balls and the amount of aggregates put in the steel drum depend upon the grading of the test sample. The steel sphere carries the aggregates and the steel balls creating a grinding effect and then drops it to the other side making a crushing effect. This cycle is repeated again and after certain number of revolution the sample is sieved too see the amount retained from the degradation and too see the percentage loss.
Apparatus
- Los Angeles Machine with wall thickness of at least 12mm. The inside diameter should be 711±5mm and the length of 508±5mm. The rotating drum should be closed from all ends and should be set at a rotating speed of 30±3 rpm. ( ASTM C131)
- Sieve with 1.7mm (No.12) passing.
- An accurate scale with no more than 0.1% error of the test load.
- The charges or the steel balls. The number of steel balls used in the test depend on the gradation of the sample to be tested. The steel balls should have diameter between 46.038mm and 47.625, with mass between 400g and 440g each. A constant weight check should always be performed on the charges because this test is very aggressive and could lead in loss of weight of the charges.
Table 1: Mass of Steel balls for LA Abrasion Test
|
Grading |
Number of Spheres |
Mass of the charges, gm |
|
A |
12 |
5000±25 |
|
B |
11 |
4580±25 |
|
C |
8 |
3330±20 |
|
D |
6 |
2500±15 |
Table 2: Grading of the Test Sample for LA Abrasion Test
|
Sieve Sizes (Square Opening) |
Mass of the aggregates, g |
||||
|
Passing Through Screen |
Retained on Screen |
Grading |
|||
|
A |
B |
C |
D |
||
|
37.5 mm (11/2 in.) |
25.0 mm (1 in.) |
1250±25 |
– |
– |
– |
|
25.0 mm (1 in.) |
19.0 mm (3/4 in.) |
1250±25 |
– |
– |
– |
|
19.0 mm (3/4 in.) |
12.5 mm (1/2 in.) |
1250±25 |
2500±10 |
– |
– |
|
12.5 mm (1/2 in.) |
9.5 mm (3/8 in.) |
1250±25 |
2500±10 |
– |
– |
|
9.5 mm (3/8 in.) |
6.3 mm (1/4 in.) |
– |
– |
2500±10 |
– |
|
6.3 mm (1/4 in.) |
4.75 mm (No.4) |
– |
– |
2500±10 |
– |
|
4.75 mm (No.4) |
2.36 mm (No.8) |
– |
– |
– |
5000±10 |
|
Total, g |
5000±10 |
5000±10 |
5000±10 |
5000±10 |
|
- Select the appropriate Grading according to the amount of aggregate available for test. It is recommended to go from higher to lower grade to gain accurate results.
- Wash and oven dry the sample at 110±5°C (230°F) to constant mass and then separate into individual sizes per their respective weights.
- Put the aggregates and the sample in the rotating drum. Close the Los Angeles Abrasion machine tightly and let it run for 500 revolutions at 30 to 33 rpm.
- After the drum stops take all the sample out and remove the steel balls from it. Now take the crushed aggregates and sieve it on 1.7 mm (No.12) sieve.
- Weigh the sample retained on the sieve and calculate the percentage loss.
Micro Deval
Micro-Deval is a test that involves measure of resistance of aggregates towards abrasion and test durability of the sample towards grinding of steel balls (ASTM D7428). The medium that is used here is water of room temperature. The sample and charges (steel balls) are kept in the Micro-Deval tank and then the apparatus is filled with water. The apparatus is rotated so that the aggregates undergo grinding and abrasion. The use of this test is mainly towards the aggregates that degrade more in presence of water than air. This test also gives a measure of how soft or “shaley” the sample is. The materials that give a high percentage loss degrade more during mixing or handling in industries. (ASTM D7428)
Apparatus
- Micro-Deval Abrasion Tank with volume of 5.03 L and external diameter of 202mm and the internal height shall be from 170 mm to 177 mm. The stainless-steel tank comes with a rubber sealing to make it water-tight. The inner and outer surface of the tank should be smooth and ridge free. (ASTM D6928)
- Micro-Deval Abrasion machine is a rolling machine with an adjustable speed which rolls the tank at 100±5 rpm.
- Steel charges of diameter 9.5±.5mm are requires. The total mass of steel balls needed is 5000±5g.
- Sieves with 5mm and 1.25mm sizes are also required.
- An accurate scale with no more than 0.1% error of the test load.
Table 3: Mass of Aggregates for Micro-Deval Test.
|
Passing |
Retained |
Mass |
|
20 mm |
16 mm |
375 g |
|
16 mm |
14 mm |
375 g |
|
14 mm |
10 mm |
750 g |
- Take washed and oven dried sample so it loses the dust on it. Prepare a representative sample of 1500±5g put it in the Micro-Deval tank.
- Add 5000±5g of steel charges in it and 2.0±.05L of tap water in the Micro-Deval tank. Let this sit for 1 hour.
- After the sample, has been soaked tighten it up and put it on the Micro-Deval rolling machine to roll for 2 hours±1 minute.
- After the machine stops rolling pour the sample on a stack of 5 mm and 1.25 mm sieve. Wash the remains of the sample in the tank on the sieve.
- Oven dry the sample at 110±5°C and weigh it later. Calculate the percentage loss using the calculation sheet.
Soundness
Soundness test is a very crucial test in paving industries especially when making massive highways, bridges and dams. This test measure the amount of degradation caused by weathering freeze-thaw cycles. The aggregates that pass this test are more durable to be used and don’t cause premature distress in pavements (http://www.pavementinteractive.org/article/durability-and-soundness/). The aggregates are kept in a sodium sulphate or a magnesium sulphate bath. The solutions is at a saturated state and causes salt crystals to be formed on the aggregates. This test is usually carried out for seven days which involves simultaneous wet-dry cycles. When the sample is submerged in the salt solution bath, salt crystals are formed in minute pores of the aggregates and causes internal forces that eventually lead crack in the aggregates. This gives us a replicated demonstration of how the substance will behave in natural habitat. This test has very poor repeatability so it is never considered as primary test to measure the degradation of the aggregates.
Apparatus
- Sieves of different sizes- 5â„16 in., 3â„8 in., No. 50, 1â„2 in., 5â„8 in., No. 30, 3â„4 in., 1 in., No. 16, No. 8, No. 4.
- Metal baskets made of wire mesh or stainless steel that allows the aggregates to freely contact the solution and permit free drainage of the loss of sample.
- Temperature regulator to ensure that the temperature of the sulphate bath is constant at specified one.
- Balances with the accuracy of 0.1% are must for this test.
- Hydrometers are also needed for this test to measure the specific gravity within ±0.001.
Procedure
- Prepare the sodium sulphate solution that has specific gravity between 1.154 and 1.171.
COARSE AGFREGATES
|
Mass of the Sample |
|
|
Sieve Size |
Mass |
|
2 in. (50 mm) |
3000g |
|
1.5 in. (37.5 mm) |
2000g |
|
1.0 in. |
1000g |
|
0.75 in. |
500g |
|
0.5 in. |
670g |
|
0.375 in. |
330g |
|
No.4 |
300g |
- Prepare Sample as per the table displayed above. The sample should be washed and dried at 110±5°C.
- Mix the 2 inch and 1.5 inch retained material and place the 5000g sample in a container.
- Mix the 1 inch and 0.75 inch retained and place the 1500g sample in a separate container and mark the container by making a groove on it with a particular symbol so it does not get mixed up with the other containers. This way it is also more efficient to identify them when changing the cycles.
- Mix the 0.5 inch and the 0.375 inch retained samples and put the 1000g sample together in a container.
- After the test samples are ready place them in the solution prepared for 16 to 18 hours and then let them drain for 15 minutes. Let the sample oven dry at 110±5°C for 4 hours and then let them cool down until they reach 20 °C to 25°C. Again, immerse it in the solution and repeat this cycle 5 times.
- After the 5 cycles are done the aggregates are to be washed thoroughly so that all the salt on the surface is removed and then oven dried at 110±5 °C.
Table 4: Sieve Sizes to be used to Measure Loss
|
Aggregate Size |
Sieve Used |
|
>1.5 inch |
1.25 inch |
|
1.5 to 0.75 inch |
5/8 inch |
|
0.75 inch to 0.375 inch |
5/16 inch |
|
0.375 inch to No.4 |
No.5 |
- Use the above given table to respective sieve the aggregates used in the test. Utmost care must be taken to sieve samples from each container separately.
- Take the sample that is retained on the sieve and weigh it to note it. The difference in the mass of the aggregates before and after the experiment gives us the amount lost due to the disintegration of the sample.
To compare the results of the following three, test a study was examined in which 20 Lab results were considered. These tests were performed by Montana Department of Transportation either in the Montana State University soil laboratory or Montana Department of Transportation (MDT) Helena materials laboratory. The samples were obtained from various random pits and quarries across Montana by MDT personnel. (Western Transport Institute) To get a very good relation and a study between these test, 5 repeats were done on the Micro-Deval test and at least 3 repeats were done for L.A Abrasion test. This also provided a good study of the repeatability of the tests.
There was no repeat test done on the soundness test since it has a very poor repeatability.
Repeatability
To analyse the repeatability of the tests, repeated Micro-Deval and Los Angeles Abrasion test were done on the same sample. The Coefficient of Variation was calculated to examine the variation in the test results for the same sample. There was no COV calculated for the Sodium Sulphate Soundness test because only one test result was provided by MDT.
The Coefficient of variation is standardized measurement calculate by diving the standard deviation of a set of results by the average mean and then multiplying it by hundred to get a percentage value. By analyzing and comparing this value we can predict the repeatability of the test. If the COV is a lower number, then the test is less variable and hence it has a good repeatability. The COV calculated for L.A abrasion test came out to be 6.5% with standard deviation of 1.5 loss percentage. Similarly, the COV for Micro-Deval test came out to be 6.5% for a standard deviation of 0.7 percentage loss. Since both the Coefficient of variations are less than 10%, both the tests are considered to have good repeatability. Another evidence to support the repeatability of the test is that there is no significant difference in the COV of Micro-Deval and L.A abrasion which are 6.6% and 6.5% respectively.
As per the comparative bar graph plotted below, majority of the coefficient of the variation fall between 5% to 15%. The COV of Lab number 861553 rocketed to 26.9% because the result was very small accounting to be 2.1% average loss. So, a small change in small result make a large COV.
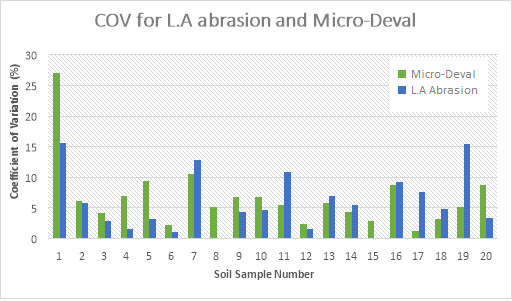
Figure 1: Graphical Representation of Coefficient of Variation for L.A
Abrasion and Micro-Deval Tests.
COMPARTITIVE RESULTS
As per the specifications provided by American Standard for Testing Materials the aggregates are classified as “durable” if the loss percentage is less than the cut-off percentage and they are “non-durable” if the loss percentage of the aggregates is more than the cut-off percentage. The cut-off percentage that we have used for L.A Abrasion, Micro-Deval and Sodium Sulphate Soundness Tests are as follows: –
- LA abrasion: Passed if loss ≤ 40%
- Micro Deval: Passed if loss ≤ 18%
- Sodium Sulphate Soundness: Passed if ≤12%
To create a direct comparison in between these tests normalized value for each test is calculated. Normalized value is used for a direct comparison between Micro-Deval, L.A Abrasion and Sodium Sulphate Soundness test. Normalized value is average loss percentage divided by the cut-off for that test. (MDT paper)
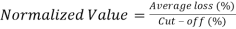
The ideal Normalized value is 1.0. If the calculated normalized value is greater than 1.0 it means that the test did not pass and the aggregate tested are not durable and if the value is less than 1.0 it means that the aggregates are durable and the test passed.
To draw a direct comparison in between two, test a two-dimensional scattered graph is plotted with four quadrants.
- The top right (North-East) quadrant depicts the are where both the test failed and the aggregates are not durable.
- The top left (North-West) quadrant depicts the area where the test plotted on the X-axis passed but the one on Y-axis failed.
- The bottom right (South-East) quadrant indicates the area where the test plotted on the Y-axis passed but the test that was plotted on X-axis failed.
- The bottom left (South-West) quadrant depicts the region where both the tests passed and the aggregates are durable.
The data points plotted in the top-right (NE) and bottom-left (SW) quadrants indicate that the tests are consistent as the aggregates were either durable for pass/pass or not durable for fail/fail. On the other hand, the data points plotted in the top-left (NW) and bottom-right (SE) quadrant indicate discontinuity and lack of coherence since one of the test would indicate that the aggregates passed the cut-off and are durable while the other would indicate that they didn’t pass are not durable for use.
- L.A abrasion vs Micro-Deval.
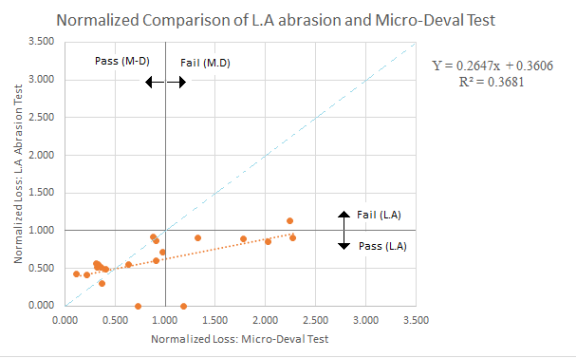
Figure 2. Graphical Representation of Comparison between Normalized Loss of L.A Abrasion and Micro-Deval Tests.
The above shown graphical representation is the plot of comparison between the Micro-Deval and the L.A Abrasion test on 20 different samples that were tested by Montana Department of Transportation. The blue dotted line that runs at 45° along the centre of the graph indicates symmetry and a perfect correlation. The data points close to the line indicate a good co-relation between the test. There was only one result that had failed both the test and was considered to be “non-durable” which accounted 5% of the materials tested. There were five results (25% of the samples tested) that fall in the awkward category and had lack of coherence since, according to L.A abrasion test it passed as was considered “durable” but according to the Micro-Deval test it was considered to be “non-durable”. The relations between these two test is quite strong as 70% of the samples tested i.e. 15 out of 20 passed the test and fall in the bottom-left quadrant which indicates that the samples were durable according to both the test.
- Sodium Sulphate Soundness Test Vs L.A Abrasion Test.
Figure 3. Graphical Representation of Comparison between Normalized Loss of Sodium Sulphate Soundness and Micro-Deval Tests.
- Sodium Sulphate Soundness Test Vs Micro-Deval Test.
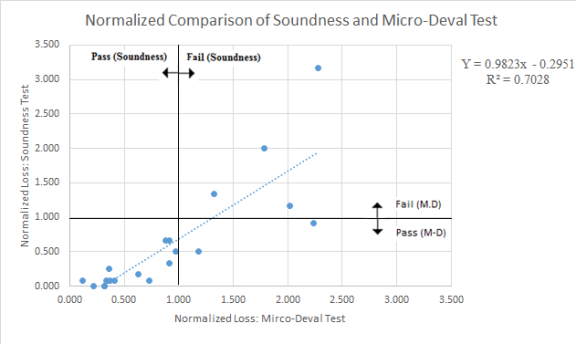
Figure 4. Graphical Representation of Comparison between Normalized Loss of Sodium Sulphate Soundness and L.A Abrasion Tests.
The co-op report guidelines suggest separating the Results and Discussion sections. I think that it is usually easier to present a discussion immediately after the results. But, you may choose to use the structure that makes the most sense for your report.
Gregates typically encountered on Montana highway projects, and to determine if the MicroDeval test provides better, timelier, and more repeatable information about the quality of an aggregate than the Sodium Sulfate test. The laboratory testing program was structured to examine how well three aggregate durability test methods correlate for a sampling of Montana soils. Aggregate durability tests were conducted on 32 different soils using the Micro-Deval, L.A. Abrasion, and Sodium Sulfate tests. Multiple Micro-Deval and L.A. Abrasion tests were conducted on some of the soil samples to investigate the same-lab repeatability of the test methods. The methods differ in their treatment of the aggregate during testing; and consequently, each method produces a unique value of percent loss, which is used to distinguish between durable aggregate and non-durable aggregate. For the purposes of this study, the following percent loss pass-fail standards were used for each test: • Micro-Deval: passing (durable), if % loss ≤ 18%; • L.A. Abrasion: passing (durable), if % loss ≤ 40%; and • Sodium Sulfate: passing (durable), if % loss ≤ 12%. Because of the differences in percent loss criteria for each method, results from the suite of laboratory tests were normalized to facilitate direct comparisons between the three methods. Normalized results were obtained by taking the average percent loss for a particular soil and dividing it by the cutoff for that test. Table 16 summarizes the comparisons between each test using data collected during this study. Based on the metrics identified in the table, the MicroDeval and Sodium Sulfate tests had the best correlation, while the Micro-Deval/L.A. Abrasion and the L.A. Abrasion/Sodium Sulfate correlations were significant, but not as strong. Table 16. Summary Comparison of Test Methods Test Methods R2 Pass/Fail Agreement (%) Inconsistent Durability Determination* (%) M-D versus NaSO4 0.72 92.9 7.1 M-D versus L.A. 0.46 85.2 14.8 L.A. versus NaSO4 0.28 84.0 16.0 Perfect Correlation 1.0 100.0 0.0 *Note: Column 4 refers to the percentage of samples that passed one of the tests but failed the other test. This inconsistency is identified as a data point that plots in one of the cross-hatched zones identified in Figures 3, 4, and 5. Conclusions and Recommendations Western Transportation Institute 35 The percentages of inconsistent durability determinations (pass or fail inconsistencies) listed in column 4 of Table 16 are indicative of a discontinuity between tests and are probably the most important metric for the comparison study. In this case, one test characterized the material as durable aggregate, while the other test characterized the same material as non-durable aggregate. Qualitatively, the authors believe that an excellent correlation between two test methods is obtained when the percentage of inconsistent results is less than about 5%, values between 5 to 10% signify a good correlation, values between 10 to 20% signify a fair to poor correlation, and values above 20% signify a poor or unreliable correlation between tests. Multiple tests conducted on samples obtained from the same sources indicate similar values of same-lab repeatability for both the Micro-Deval and L.A. Abrasion tests. The coefficients of variation for the multiple tests were less than 10% for both methods. Considering the natural variability that occurs within an aggregate source, the measured variations were low, indicating good repeatability of the test methods. This conclusion has also been supported by others (Jayawickrama et al., 2006; Tarefder et al., 2003; and Hunt, 2001). Repeatability of the Sodium Sulfate test was not examined in this study. The relationship between Micro-Deval test results and field performance was not examined in this study; however, evaluations by Fowler et al. (2006), Rangaraju et al. (2005), Tarefder et al. (2003) and Wu et al. (1998) indicate that Micro-Deval test results relate well with field performance. An excellent correlation between rutting performance and Micro-Deval test results were observed by White et al. (2006). They sug
There are many reference styles available to choose from. It is not very critical which one you use, as long as you are consistent throughout the report. The APA reference style is an appropriate choice. You can quickly generation citations for your reference list using the online citation generator from RefME (RefME, 2016). Always review the text the generator has populated in the form for you as it is not always accurate.
Entries in the reference list are sorted alphabetically. Some examples of common references for the reference list and in-text citations are shown below.
Websites
Robertson, J. (2016, August 8). Man solves Rubik’s cube while free-falling. Retrieved August 9, 2016, from http://www.cbc.ca/news/canada/edmonton/learning-to-solve-a-rubik-s-cube-while-free-falling-1.3712116
RefME. (2016). FREE APA citation generator & format. Retrieved July 30, 2016, from https://www.refme.com/ca/citation-generator/apa/
In-text Citation: (Robertson, 2016)
In-text Citation: (RefME, 2016)
Books
Felder, R. M., & Brent, R. (2016). Teaching and learning stem: A practical guide. United States: John Wiley & Sons.
In-line Citation: (Felder & Brent, 2016)
Journal Articles
Lombardo, S. J. (2010). Teaching technical writing in a lab course in chemical engineering. Chemical Engineering Education, 44(1), 58-62.
In-line Citation: (Lombardo, 2010)
Cite This Work
To export a reference to this article please select a referencing stye below:
Related Services
View all


DMCA / Removal Request
If you are the original writer of this essay and no longer wish to have your work published on UKEssays.com then please click the following link to email our support team:
Request essay removal