Navel Model to Image Separation in Scanning Tinny Letter
| ✅ Paper Type: Free Essay | ✅ Subject: Engineering |
| ✅ Wordcount: 2359 words | ✅ Published: 31 Aug 2017 |
Somayeh Komeylian
Department of Tel-Communication Engineering, Islamic Azad University South Tehran Branch, Tehran, Iran
Armin Mehrabian
Department of Medical, Mashhad Medical Science University, Mashhad, Iran
Saeed Komeylian
Factory of graduated students, Department of Tel-Communication Engineering, Sharif University of Technology, Tehran, Iran
In this paper, a navel model has been introduced to image separation in scanning tinny letter. The proposed model is based on Almeida et al. (2006) model. First, the basic image separation method has been explained, and then the proposed pre-processing methods have been presented. In addition, separation method presents based on two sampled wavelet and contour transform which has adaptive structure. The result showed that proposed model has a good quality with a little runtime. On the other hand, this model which use directional filter bank has better effect in separation with approximately two level of decomposition. Finally, the two mainly proposed algorithms (NSWT and Improved NSCT) shows that, we achieve to really good results which our separated images have absolutely good quality by using preprocessing and these methods simultaneously.
Keywords: Image separation; contour let; non-subsample wavelet.
When we scan or photograph a paper document, especially if the paper is thin or transparent, the image from the backside often appears on the image from the front page. This is a routine problem which is usually occurs, when the electronic version of an old document or a book is needed. Extracting sources from mixture images is a problem of blind source separation. Independent Component Analysis (ICA) is one of the good solutions for this problem, which is done with linear and nonlinear ICA in [3] and [4], respectively. The results show that the nonlinear solution is better, because images are mixed through a nonlinear procedure. In [3] authors use a nonlinear method, which is named MISEP that is based on multilayer perception used in neural network. In the most of ICA methods the result are achieved from adaptive or iterative algorithms, which are time-consuming procedures. Another work was based on the nonlinear de-noising source separation (DSS) method [6]. This method is supposed when two images have independent sources and have different frequency components in the same locations. These conditions are the same as those exist when a source is contaminated by noise. Therefore, nonlinear de-noising might be used for source separation. The separation method used here is similar to that implemented in [6]. However, we believe that human visual perception uses different edge directions in the mixed subjects to separate them. Therefore, we improved the method in [6] which based on exact high frequency separation. As well known, wavelet analysis offers limited directional information in representing image edges when separable one-dimensional transforms are used for images. Minh N. Do and Martin Vetterli developed a “true” two dimensional representation, called contour let [7], which can capture the intrinsic geometrical structure that is key in visual information. Compare to the recent image representations this construction results in a flexible multi-resolution, local and directional image expansion using contour segments. Moreover, sub sampling process in the wavelet transform change the geometric information of image details like edges. So, non-subsample wavelets are introduced for decomposing the image frequency components with better saving its geometric information. For comparing the results with [6], here we use the images that Mr. B. Luis. Almeidamade in his laboratory. He dealt with a difficult version of image mixture problem, corresponding to the use of onionskin paper, which causes a strong nonlinear mixture. The source and mixture images are shown in figures 1 and 2. More information about images is available in [1] and [2]. This paper is organized as follows: Section 2 explains the basic image separation method which is used in this paper. Section 3 introduces the proposed pre-processing methods. Section 4 presents separation method based on non-sub sampled wavelet and non-sub sampled contour let transform which has adaptive structure. Section 5 explains the experimental result. Section 6 has some discussions about the results. Section 7 gives the concluding remarks.
The nonlinear image separation procedure based on de noising source separation [1] is based on wavelet transform, and uses very basic information about the sources and the mixture procedure. This information is based on two observations: First; the high frequency components (details) of common images are sparse. As a consequence, the wavelet coefficients from two different source images will seldom both have significant values in the same image location.
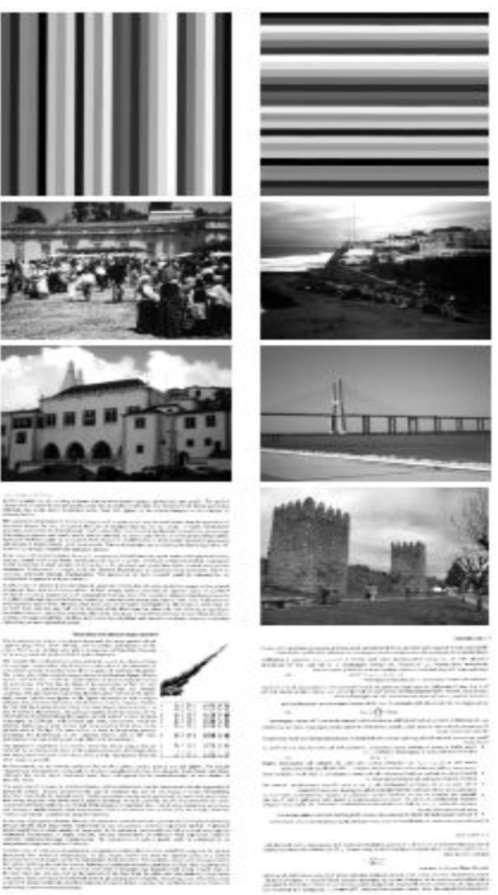
Fig. 1 :Five source image pairs [1].
Second: Each source is more strongly represented in the image acquired from that side of the paper in which that source is printed than in the image acquired from the opposite side. The schematic representation of the separation method is shown in Figure 3. In this figure, the mixed images are first pre-processed by the following relation:

where elements of Q matrix is the auto covariance of mixture matrix. This equation applies a linear transformation to the mixed sources. The nonlinear process is based on wavelet analysis which iteratively decomposes the approximation coefficients Aj(the low frequency component) at level j to four components (the approximation at level j+1, and the details in three orientations; horizontal, vertical, diagonal).
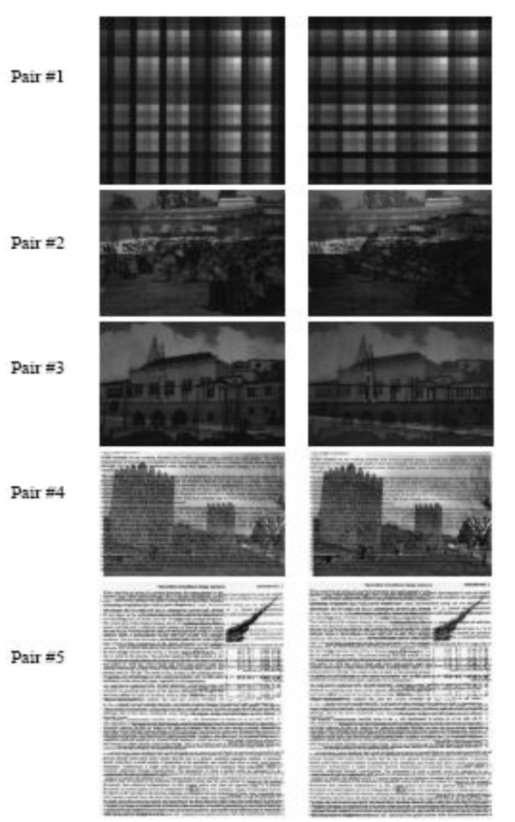
Fig. 2: Five mixture image pairs after scanning [1]. components (the approximation at level j + 1, and the detail sin three orientations; horizontal, vertical, diagonal).
After performing wavelet decomposition on mixed images for a certain number of levels, a competition is performed between the corresponding high frequency components from the two mixture images in each side of paper, according to following equation:


are the wavelet coefficients of a given type (for example vertical coefficients at the first decomposition level) of the decomposition of the i th mixture image, x3−i are the corresponding coefficients from the other mixture image, and a is a parameter that controls the strength of the competition.
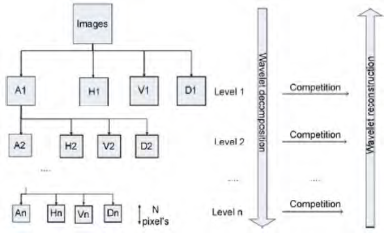
Fig.3: Schematic representation of wavelet-based separation method[1]
This competition was applied to all horizontal, vertical and diagonal wavelet coefficients at all decomposition levels. The competition computes mask mi through a soft winner take all function [1], and then applies this mask to the wavelet high frequency coefficients of the mixture images, so that the coefficients are intensified in the image in which they originally were stronger and weakened in the image in which they were weaker. The separated images then will be synthesized using the wavelet coefficients compute competition in high frequency. In [1], one-dimensional discrete wavelet basis are separately used in horizontal and vertical directions.
In the first step we assume the mixing procedure is a linear process and try to estimate the mixing matrix and implement the inverse matrix for separation. Although, we know the linear assumption is not completely right, however, it can be used as a pre-processing step to separate the mixed images.
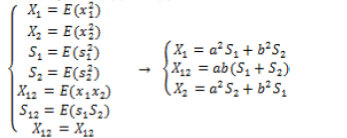
Since the source images are not available, the mixing matrix should be estimated through a statistical approach. The following approach is written for this purpose. If we show the source signals as S, mixture signals X and the mixing matrix as A, then we have:
X= AS (4)

In equation (5) we assume that the variables are zero-mean. This means we deal with the mean subtracted source and mixture images. From Eq (5) the autocorrelation matrix of mixed images is:

From Equation (6) and (7) we could write:
 (8)
(8)
 (9)
(9)
Since b>a, then only the plus sign is correct and from equation 6 we have :
X1 + X2 = (a2 + b2) (S1 + S2)(11)
A. First Pre-processing Method
We assume that total energy of pictures before mixing and after that are equal. We use equation 11 and have some manipulation from these simple equations for a and b.
a2 + b2 = 1 (12)
 (13)
(13)
 (14)
(14)
B. Second Pre-processing Method
We assume that when a packet of light emitting from scanner laser, b is the amount of light which went through the paper and a is the amount of light which reflect from first side of paper. In this method, we assume that, the amount of light which go through the paper and the amount of light which reflect back, together are constant. We have:
a + b = 1(15)
 (16)
(16)
But in this case, when we extract images, the contrast of images is high. For this effect we use modified form of this equation as below:
a+b = 1.4(17)
 (18)
(18)
C. Third Pre-processing Method
We know from equation 5 that:
 (19)
(19)
This equation has four undefined parameter and from equation 8 we have three equations. Assume that for normal deviation of mixture images and primary image we have:
 (20)
(20)
This is the other equation to solve four undefined parameters. By solving(19),we can determine a and b. :
 (21)
(21)
Where s1 and s2 are separated sources through a linear process.
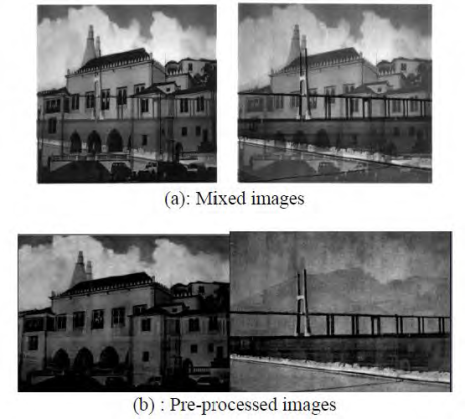
Fig.4: Result of implementing the proposed pre-processing method
Since, we estimated the mixing matrix through non-exact assumptions it should be examined to show how it can separate the mixed images. Therefore we applied these three pre-processing method.We see that these three equation which derive from previous assumption has approximately the same extraction Figure (4-a) shows the mixed and processed images. From Fig4 b) we can see the proposed linear process 3 could approximately separate the mixed images. Although, s1 and s2 are not completely separated, we use the linear process as pre-processing step and those may be used for final separation through the nonlinear process that will be explained in the next section. The results of applying our pre-processing method to one pair of mixed images are shown in Fig. 4. The results show that the proposed method has partly separated the mixed images.
The most important goal of this separation method is to obtain a sparse edge and contours of images that are placedin high frequency component of images. Wavelets for decomposition is not good [9] because when we use wavelets, in each level of decomposition, a down sampler shrink the size of the remainder and competition in high frequency is not exact and when we reconstruct image from that, blocking effect appear. Because assume the size of image is odd. In down sampling we have not an exact decomposition and in reconstruction, images don’t have a good quality and appear some block.
In first method we use NSWT which approve those blocking effect. This method has very short runtime and is acceptable for approximately all application. The other method is based on NSCT. This method is composed of pyramid decomposition and directional filter bank. Pyramid decomposition is shown in figure5 and directional filter bank is shown in figure 6. When we use these two decomposition at the same time we have a composed method which is shown in figure 7.
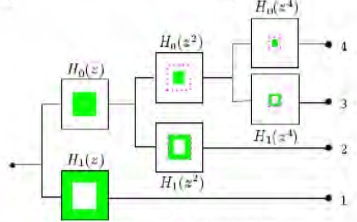
Fig.5: Pyramid Decomposition
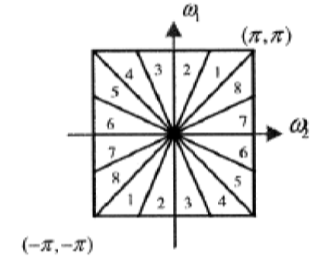
Fig.6: Directional filter bank
Directional filter bank have a good property that can describe diagonal line in pictures and if we use it for separation we have a better result. For each decomposed frequency based part, we use our well-known mask which is described before. We present an adaptive form of NSCT which is announced below.
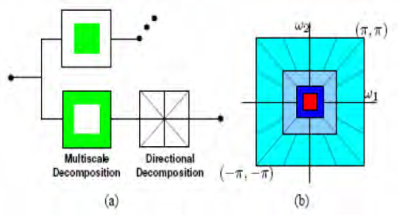
Fig.7: Combining two methods
We first decompose in first level and apply separation mask. Then we reconstruct images and use correlation factor among them. If it is too low for example 0.01, extraction is good. If it is higher than some threshold we decompose image in further level and use separation mask. In this method, it is not necessary that we define decomposition level at first. NSCT has other good performance which is shift invariant. This property has no blocking effect.
In this section we present experimental result from our method which are NSWT and improved NSCT. These two methods have an approximately complete separation result. First method has low runtime but in order to compare it with NSCT, the last one has a better separation result because we use directional filter bank and it could better separate high frequency in two images in every direction which we want. In NWST we use 6 and 7 level decomposition and since it has fast algorithm to decompose picture in wavelet form. In improved NSCT we use an adaptive form which it has little runtime and can separate in each direction we want. In figure 8 we show the experimental result for NSWT and in figure 9 we show the other one for NSCT.
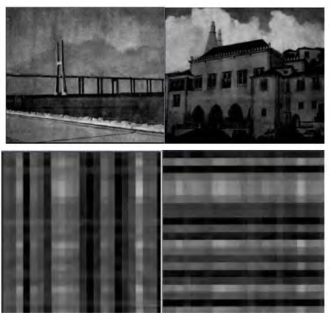
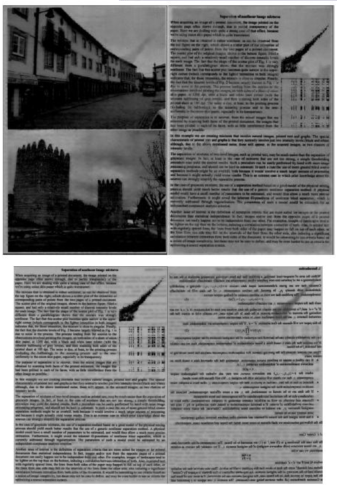
Fig.8: The result with NSWT
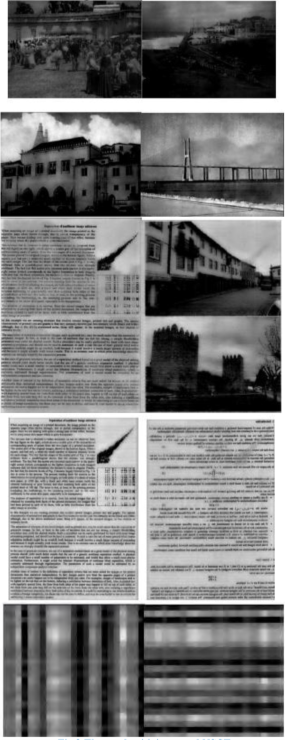
Fig.9: The result with improved NSCT
We see from the results that, our separation methods have better results in compare with the proposed methods in references. In our case, we derive very simple equations that can separate two mixture images linearly, which leads to a from the results that, our separation methods have better results in compare with the proposed methods in references. In our case, we derive very simple equations that can separate two mixture images linearly, which leads to a time-efficient algorithm. The two mainly proposed algorithms (NSWT and Improved NSCT) shows that by using preprocessing and these methods simultaneously, we achieve to really good results and our separated images, have absolutely good quality.
In this paper we present a new preprocessing method which has a simple function and high precision in separating mixture images with linear form. Also we use two other separation rule that approximately separate images completely. NSWT has a good quality with a little runtime. On the other hand, NSWT which use directional filter bank has better effect in separation with approximately two level of decomposition.
References
[1] Mariana S.C. Almeida and Luis B. Almeida, “Wavelet Based Nonlinear Separation Of images”, Instituto de Telecommuincacoes, Lisboa, Portugal, 1-4244-0657 -9/06, 2006 IEEE.
[2] Luis.B.Almeida,”http://www.lx.it.pt/~lbameida/ica/seethrough/index.html.
[3] L.B. Almeida, “MISEP-Linear and Nonlinear ICA Based On Mutual Information”, Journal of Machine Learning Research, vol. 4, pp. 1297-1318, 2003
[4] L.B. Almeida, “Separating a Real-life Nonlinear Image Mixture”, Journal Of Machine Learning Research, vol.6, pp. 1199-1229, July 2005.
[5] Mariana S.C Almeida and Luis B Almeida, “Wavelet Based Separation of Show-through and Bleed-through Image Mixtures”, Instituto de Telecommuincacoes, Lisboa, Portugal, November 2007.
[6] M.S.C.Almeida, H.Valpola and j. Sarela, “Separation Of Nonlinear Image Mixtures By Denoisind Source Separation” in Independent Component Analysis and Blind Signal Separation, J. Rsca, D. Erdogus, J.principe and S.Haykin, Eds.,Belin,Germany,2006
[7] Duncan D., Y. Po and Minh N. Do, “Directional Multi-scale Modeling of Images Using the Contourlet Transform”, IEEE Transactions on image processing, vol. 15, Issue 6, Jun 2006, p.p.1610-1620
[8] AzadehBamdadMoghadam, “NSCT based for image extraction”, Master of science Thesis in Iran University of Science and Technology,Spring2008.
[9] Gonzalez and Woods, “Digital Image Processing” 3rd Edition 2008.
Cite This Work
To export a reference to this article please select a referencing stye below:
Related Services
View allDMCA / Removal Request
If you are the original writer of this essay and no longer wish to have your work published on UKEssays.com then please click the following link to email our support team:
Request essay removal


