Indirect Tension Test Analysis
| ✅ Paper Type: Free Essay | ✅ Subject: Engineering |
| ✅ Wordcount: 1431 words | ✅ Published: 30 Aug 2017 |
IDT
The indirect tension test involves applying compressive loads on cylindrical specimen. This would develop uniform tensile stress perpendicular to direction of applied load as shows in figure1. Resulted horizontal and vertical tensile deformation is measured using linear variable displacement transducers(LVDTS). The specimen is loaded until splitting along axis of applied load as shows in figure 2 [1]. Different type of loading mode, temperature and device setup modification were used to measure different material properties. IDT test have many advantages such as simplicity in accompanying test, and preparation samples. Specimens failure is started in uniform tensile stress, and it is not affected by surface condition of specimen make it popular test in pavement . [2]
AC mixture properties obtained by load, displacement – time plots at different loading mode and temperature as shows in figures 2. Initially, IDT was used to measure strength of specimen. It was defined as the maximum load on specimen until failure. It is loaded with constant deformation rate at specified temperature until failure. The strength was obtained by dividing peak load of specimen, on it diameter and thickness using u equation 1.The detailed procedure is described in [4], where it was recommended to test material with 50mm/min loading rate , at 77°F
Equation 1
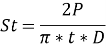
Where:
St = tensile strength, kPa (psi)
P = maximum load, N (lbf)
t = specimen height immediately before tensile test, mm(in.),
D = specimen diameter, mm (in.)
Indirect Tensile Creep Tests
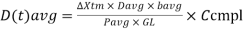
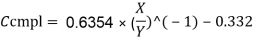
In addition, ITD is used to conduct creep compliance test on mixture. These values was addressed by Superpave specification to prevent thermal cracking, also, it is one of primary inputs in ASSHTO ME design method. Creep compliance represent ratio between time-dependent (creep) strain to applied stress as function of time. It is reflected the stiffness and time-dependence of material .[2].. In this test, the specimen is loaded with constant static load, that make Maximum measured horizontal strain below 500-10-6 mm. Three measurement is taken at three different temperature, selected based in PG grading of binder. The creep compliance calculated as function of time using equationS 2,3. The detailed procedure is described in [5].
Equation 2
Equation 3
Where:
D(t) = creep compliance at time t (kPa)
GL = gauge length in meters (0.038 meters for 150 mm diameter specimens)
Davg = average diameter of all specimens [typically 3] (nearest 0.001 meter)
bavg = average thickness of all specimens [typically 3] (nearest 0.001 meter)
Pavg = average creep load (kN)
ΔXtm,t = trimmed mean of the normalized, horizontal deformations (nearest 0.001meter) of all specimen faces [typically 6] at time t
(X/Y)absolute value of the ratio of the normalized, trimmed mean of the horizontal
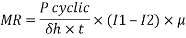
Also, it was used to determine resilient modulus of pavement mixture. Resilient modulus is stiffness measurement, reflecting material behavior within undamaged loading mode. It was defined as ratio between applied stress to recoverable strain. Within IDT device a cyclic load is applied to give specimen enough time to recoverable it is strain. Each cycle included applying compressive load, followed by rest period. Horizontal and vertical recoverable deformation is recorded within test as shows in figure 3. It is used to calculate Passion’s ratios, to obtain the resilient modulus using equation 2 and 3. Two different values of resilient modulus could be obtained, based on measured deformation. Instantaneous resilient modulus depends on instantaneous recoverable deformation during unloading of each cycle. Total resilient modulus is obtained using total recoverable deformation including both instantaneous and time-dependent recoverable deformation. Detailed test procedure is described in[6]. Three specimens with (4 or 6) in diameter, (1.5 or 2) height are tested at (77±2F). Initially, 100 loading cycles are applied, to get five stable cycle with less than 1 % change on resilient modulus. Loading levels are selected as ( 10 – 20 ) percentage of one specimen. Instantaneous deformation is represented as difference between peak and curve deformation. Total deformation was determined as difference between peak and end of one loaded- unloaded cycle as shows in figure 3.
Figure 3[6] load, displacement – time plots for IDT test output
Equation 2
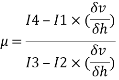
Equation 3
Where :
µ = Poisson’s ratio,
δv = the recoverable vertical, mm (in.)
δh = the recoverable horizontal deformation, mm (in.)
MR = resilient modulus of elasticity, MPa (psi),
δh = recoverable horizontal deformation, mm (in.),
I1,I2,I3,I4: Constant values depends on gauge length as a fraction of diameter specimen
µ = instantaneous or total Poisson’s ratio,
t = thickness of specimen, mm (in.),
Pcyclic = Pmax – Pcontact = cyclic load applied to specimen, N(lb),
Pmax = maximum applied load, N (lb) and
Pcontact = contact load, N (lb)
Indirect Tensile Fatigue Tests
IThe specimen tested for fatigue under repeated load mode. The fatigue life was represented by number of cycle until failure during the test.Different fatigue criteria were developed within on IDT test. Number of cycles to complete failure (Nf); or 50 % reduction in resilient modulus of its initial value was used [7].[8] defined it as when the permeant horizontal deformation ranges between 0.25-0.38 in. However [3] found dramatically increasing in total horizontal deformation was happened after a value of 0.1 in and select as failure criteria. [9] define it as the point when horizontal deformation increase in faster rate more than constant rate. [10] select a value of 9 mm of total vertical deformation as failure criteria.[11], introduced theoretical criteria based on energy ratio for both control stress and strain mode of loading. [2] introduced logit model used fracture energy as indicator for fatigue based on fatigue cracking.[12] used viscoelastic continuum damage (VECD) model to predict fatigue life. A single-characteristic curve of an asphalt mixture and is independent of loading types (C1-S1 curve) model was used. A 50 % reduction in normalized pseudostiffness (C1) was selected as failure criteria.
[13] introduced new approach based on crack development. Two digital cameras were used to record development of cracks every minute. The failure criteria was selected as number loading cycle when rapid crack beginning.
Two asphalt mixture, dense graded and stone mastic were tested based on AASHTP TP9-96. Control-stress mode of loading was used at 20 C with 10HZ frequency. Two digital cameras were used to record development of cracks every minute, as shows in the figure 3. Scion Image software was used to analysis results images. Both length and width of cracks was recorded. The failure criteria was selected as number loading cycle when rapid crack beginning.
Figure 4[13]
overlay tester (OT)
The overlay test was introduced by [14] to induced resulted displacement from temperature change at layers below the overlay. The original OT was upgraded to test HMA laboratory mixes and field cores. The specimen size was modified to be obtained from superpave gyratory compactor samples (figure 6) and fully computer controlled system is used to control the test [15] .
The test setup shows in figure 7 two steel blocks, one free to slides horizontally, while the other is fixed. The sliding process reflects the opening and closing of cracks or joint in pavement thus, will represent the two-stage fatigue process in pavement. The crack initiation, includes growing of micro-cracks and the crack propagation, represented by macro cracks on surface layer .[16].
Figure 5 Overlat test setup,[15]
Figure 6 OT Sample preparation[15]
The Trimmed specimen is glued with epoxy between two blocks. The sliding is applied cyclic triangular waveform direct tension on the specimen. It is controlled with maximum displacement opening. The test could be conducted with loading rate ranges (1-600) second/cycle, controlled opening displacement (0-0.08) and temperature between (32-77 F) [17].However, Texas Department of Transportation (TxDOT) published standardized test procedure designation (Tex-248-F. It was specified that the specimen is loaded with 10 second cyclic controlled with 0.025 maximum displacement at 77+1F temperature.[18]
Figure 7:overlay setup-Tex-248-F test [19]
The crack resistance is represented based on number of cycle correspond to 93% in maximum applied load in first cycle. (Hu et al. 2008; Sheng and Ping 2016). However, [22] compare between different methods to analysis the data. The area under- the load-cycle response curve was used; the result shows no improvement in variability. In addition, the rate of load decrease was studied, it was unsatisfactory. different load reduction percentage was tested as alternative for 93%. The 85% load reduction seem to be good.
The test is recommend for performance measures for reflective cracks. [15] test field cores from different highways in taxas state. They suggest 300 cycle @93 % load reduction was selected as pass /failure criteria and 750 cycle was For the rich bottom layer. Also, New Jersey department of transportation (NJDOT) adopted OT test as performance measure for different mixes . The test conduct 10 second cyclic load controlled with 0.025 maximum displacement at either 59 or 77 F. The failure criteria of specimen selected to be 93 % or until minimum 1200. The detailed procedure published in designation NJDOT B-10[23]. The design Binder-Rich Intermediate Course(BRIC) require minimum of a 700 cycle at 77F as pass criteria. For high rap mixes it is require minimum 150,175 For PG64-22,PG76-22 respectively for surface course while intermediate course required minimum 100,125 cycle for PG64-22,PG76-22 respectively[24].
Cite This Work
To export a reference to this article please select a referencing stye below:
Related Services
View all


DMCA / Removal Request
If you are the original writer of this essay and no longer wish to have your work published on UKEssays.com then please click the following link to email our support team:
Request essay removal