Frictional Pressure Losses in Pipes
| ✅ Paper Type: Free Essay | ✅ Subject: Engineering |
| ✅ Wordcount: 3322 words | ✅ Published: 23 Sep 2019 |
Abstract
This laboratory was carried out to investigate the accuracy of the Darcy-Weisbach equation by using this to calculate theoretical values and to understand how pressure loss occurs in pipes with the factors affecting the drop. Results and analysis of this investigation show that pressure drop in a pipe greatly depend on the geometrics of the pipe and the flow rate, the pressure drop is seen to be inversely proportional to the inner diameter of the pipe and the Darcy-Weisbach equation predicts this and the overall trends in the relationships. The equation was found to be very accurate at predicting pressure drop in laminar flow but not as much in turbulent with pressure drops in laminar having a much lower percentage difference, however this may be due to assumptions made such as assuming all the pipes were smooth, roughness is irrelevant for the friction factor in laminar flow and thus irrelevant for those pressure drops whereas the results in turbulent flow and especially for a particular pipe in the experiment show pressure drop in turbulent flow is very likely to depend on roughness of the pipe. Pressure drop was also seen to be directly proportional to the flow rate in laminar and directly proportional to the squared flow rate in the turbulent regime.
Table of Contents
1. Nomenclature…………………………………………………………….……1
2. Introduction……………………………………………………….…….………2
3. Theory………………………………………………………………….……….3
3.1 Flow Regimes………………………………………………………….………………3
3.2 Assumptions………………………………………………………..………..…………4
3.3 Theory and Darcy-Weisbach Derivation………………………….……….….…..4-6
4. Method……………………………………………………………….………6-9
5. Results……………………………………………………………….………9-10
6. Results and Analysis……………………………………………………..10-13
7. Conclusion…………………………….………………………..…………….13
8. References………………………………………………….….…………13-14
Nomenclature
|
Symbol |
Units |
|
|
Cross Sectional Area |
A |
m2 |
|
Density |
|
kgm-3 |
|
Diameter |
D |
M |
|
Dynamic Viscosity |
|
Pa s |
|
Friction Factor |
|
No Units |
|
Kinematic Viscosity |
v |
m2s-1 |
|
Length |
L |
M |
|
Pressure |
P |
Pa |
|
Radius |
r |
M |
|
Reynolds Number |
Re |
No Units |
|
Shear Stress |
|
Pa |
|
Fluid Velocity |
|
ms-1 |
|
Volumetric Flow Rate |
Q |
m3s-1 |
|
Change in Length |
dL |
m |
|
Change in Pressure |
dP |
Pa |


Introduction
Pressure drop is the reduction in pressure as a fluid moves through a system and it is essential that such a drop is accurately measured and monitored in a system within industry. Pressure in a system must often conform to strict safety regulations and so it is crucial that pressure drop is accurately measured so that there can be confidence that the system in question is well within the specified regulations.
As well as safety reasons, economics of the processes also come into play. Excessive pressure drops often cause poor system performance and higher energy consumption, especially when leaks and other unregulated uses occur unnoticed and for this reason it is imperative pressure drop can be monitored accurately and thus help maximise efficiency throughout a process. [1]
For these reasons it is important that the theoretical model that is being used to predict pressure drop is accurate and holds true for the actual pressure drops that occur in the system and one of the main aims of the laboratory that was carried out was to validate a theoretical model that predicts pressure drop, the Darcy-Weisbach equation. This was done by comparing how close the experimental data was to the theoretical data calculated by this equation. Validating this model would help discern whether the model is suitable for use in industry to accurately monitor pressure drops and provide the aforementioned social and economic benefits.
Another aim was to identify and explain the differences between experimental and theoretical pressure drops and to also identify the assumptions that were most probable in causing any errors and to recognise if there were any errors from physical measurements.
Investigating the parameters that affect pressure drop was also a main aim of the experiment and this was done by measuring pressure drop through different pipe geometries and using different flow rates which affected the velocity. Knowing the parameters that affect pressure drop would be extremely useful in industry as it would enable the pressure drop to be easily controlled and adjusted to whatever is most desirable for a process.
3. Theory
3.1 Flow Regimes
In this experiment the flow rates were used in the laminar and turbulent regimes. Laminar flow is characterised by smooth and regular paths of the fluid particles and they flow in parallel layers with no disruption occurring between layers and so often laminar flow is referred to as a streamline flow. Turbulent flow has characteristics of irregular movement of particles with lateral mixing occurring and the flow also is also characterised by eddies and recirculation. [2] The flows can be represented by the diagram below.
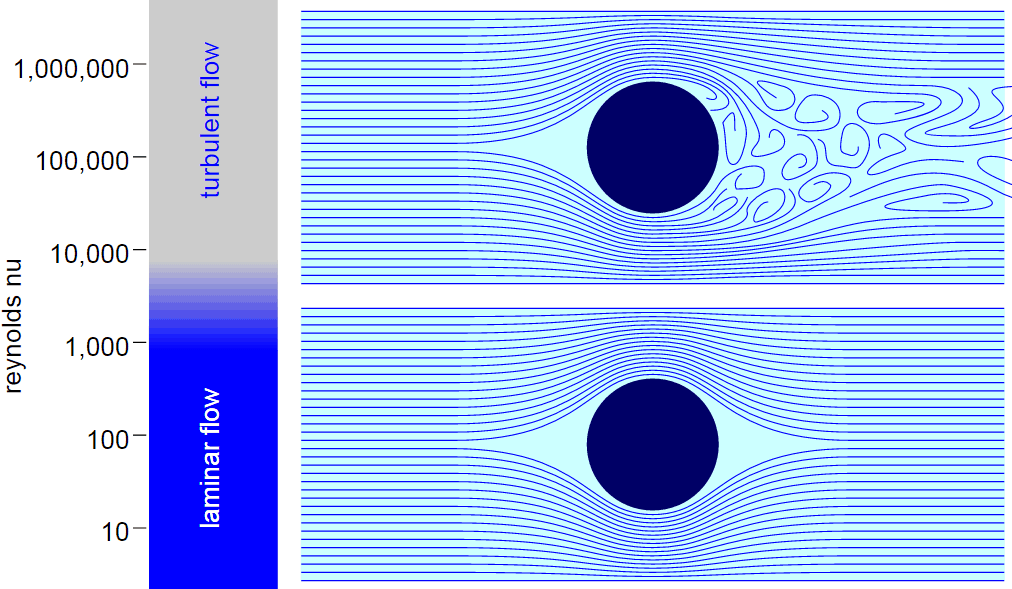
Fig 1 – Flow rates in laminar and turbulent regimes
Flow is considered laminar when the Reynolds number is less than 2000 and it is turbulent at Reynolds numbers greater than 4000. Between Reynolds numbers of 2000 and 4000 transitional flow occurs, in this state the flow is unstable due to the onset of turbulence so transitional flows are generally not used in industry or experiments as they are hard to predict or analyse. [3] Also for this reason it is important that the Reynolds numbers are kept track of so it can be distinguished what regime the flow is in at any particular point.
Laminar and turbulent are two very distinguishable regimes which is why for this experiment the flow rate was always within one of the two regimes so that the differences between them could be separately analysed.
3.2 Assumptions
Before starting the investigation, several assumptions were required to be made, they were as follows:
Air was considered to be an ideal fluid and thus incompressible and therefore density remains constant
The pipes were completely smooth
Dimensions of the pipes stay the same throughout the experiment, i.e. the volume and diameter
The pipes were perfectly level
Fluid temperature remained constant throughout the experiment at 20°C
3.3 Theoretical Data and Darcy-Weisbach Derivation
The accuracy of the Darcy-Weisbach equation in this experiment was determined by comparing the theoretical values that the equation gave against the actual experimental values of pressure drop. In both laminar and turbulent regimes, a friction factor had to be calculated for each flow rate used.
The Hagen-Poiseuille equation [4] is defined as:

1
The Darcy-Weisbach equation[5] is defined as:

2
By equating these forms of the Darcy-Weisbach and the Hagen-Poiseuille Equation to each other and eliminating pressure change, φ (phi), can be made the subject of the equation and then the friction factor can be determined as:

3
This representation of the friction factor can only be used in laminar flow however, as in laminar flow the roughness of the fluid is irrelevant. [6] In turbulent flow this equation would not hold true and so a different approach must be taken. By assuming the pipes are smooth the Reynolds numbers at their respective flow rates can be used to read off a moody chart by using the smooth pipe lines. Any friction factor obtained whether it be in laminar flow or turbulent flow can then be put in to the Darcy-Weisbach equation to calculate and estimate pressure drops at various Reynolds numbers and flow rats.
Darcy Weisbach is the equation that is under scrutiny in this experiment and the to derive the equation one possible approach is to consider a force balance on a section of a fluid in a pipe as seen by the diagram of a circular pipe below.


Fig 2 – Forces acting on a section of a pipe containing a fluid
In this experiment a constant flow rate is assumed throughout the pipe and therefore acceleration is 0 so the forces are in equilibrium and a force balance by using the equation Force=Pressure multiplied by Cross Sectional Area is done as follows:

4
The equation can then be rearranged into the form:

5
Both sides can then be integrated with the limits shown:

6
 Hence:
7
The dimensionless friction coefficient is defined as:

8
[7]
The friction coefficient equation can be rearranged in terms of the shear stress (Tao) and substituted into the equation and the radius can be substituted for half the diameter, the equation that follows is now a form of the Darcy-Weisbach equation:

9
- Method
Before using the apparatus and carrying out the experiment it was important to know what flow rates to use to achieve the maximum Reynolds number in laminar and the minimum Reynolds number , this is to ensure that the flow that is being used is always within the laminar or turbulent regimes.
The following equations were used to find these Reynolds numbers:


The dynamic viscosity and kinematic viscosity of air at 20℃ were known as well as the diameters of the pipes and so Reynolds numbers could be calculated, providing a guideline for suitable flow rates to use in the experiment. A table of the flow rates and the Reynolds numbers that were used are shown below for each pipe. [8]
|
Air Flowrate Pipe 1 (L/min) |
Reynolds Number Pipe 1 |
Air Flowrate (L/min) Pipe 2 |
Reynolds Number Pipe 1 |
Air Flowrate Pipe 3 (L/min) |
Reynolds Number Pipe 3 |
|
1 |
202.020202 |
1 |
202.020202 |
1 |
353.3568905 |
|
2 |
404.040404 |
2 |
404.040404 |
2 |
706.7137809 |
|
4 |
808.0808081 |
4 |
808.0808081 |
3 |
1060.070671 |
|
6 |
1212.121212 |
6 |
1212.121212 |
4 |
1413.427562 |
|
8 |
1616.161616 |
8 |
1616.161616 |
5 |
1766.784452 |
|
9 |
1818.181818 |
9 |
1818.181818 |
5.5 |
1943.462898 |
|
20 |
4040.40404 |
20 |
4040.40404 |
11.5 |
4063.60424 |
|
23 |
4646.464646 |
23 |
4646.464646 |
12 |
4240.282686 |
|
26 |
5252.525253 |
26 |
5252.525253 |
14 |
4946.996466 |
|
29 |
5858.585859 |
29 |
5858.585859 |
16 |
5653.710247 |
|
32 |
6464.646465 |
32 |
6464.646465 |
18 |
6360.424028 |
|
35 |
7070.707071 |
35 |
7070.707071 |
20 |
7067.137809 |
The experiment was carried out with two rotameters connected to a pipe system with 3 pipes parallel to each other with connection points between the ends of each pipe. One of the rotameters had a capacity of 10Lmin-1 with intervals of 1Lmin-1, the other rotameter had a capacity of 100Lmin-1 and had intervals of 10Lmin-1. A manometer was used between those connection points to measure the pressure drop in each pipe. A specification of the pipes are shown in the table below followed by a diagram of the apparatus.
|
Pipe |
Connection Points |
Inner Diameter (mm) |
Length (m) |
|
1 |
P1, P2 |
7 |
1 |
|
2 |
P3 , P4 |
7 |
1 |
|
3 |
P 5, P6 |
4 |
1 |

 Connection Points


Air Supply


 Rotameters
 Manometer
Fig 3 – Set up of the apparatus in the laboratory
By achieving the set up above the rotameters were adjusted to achieve the desired flow rates. For which ever pipe the flow rate was being recorded for , the manometer was connected between the two connection points shown in the table and the diagram, and for each flow rate the reading from the manometer was recorded after the manometer settled and this was done for various flow rates within the laminar and turbulent regime for each of the 3 pipes.
- Results
Overall the relationship between pressure drop and flow rate was seen to be linear in laminar and quadratic in turbulent, the theoretical values were much closer to the experimental values in laminar flow compared to turbulent and pipe 1 and 3 had overall much closer theoretical and experimental values than pipe 2 overall which deviated significantly from the theoretical. Pipe 1 and 2 are also shown on the same graph as the theoretical pressure drops were the same due to the pipes having the same diameter.

Fig 4 – Experimental and theoretical pressure drops of pipe 1 and 2 against the flow rate
1
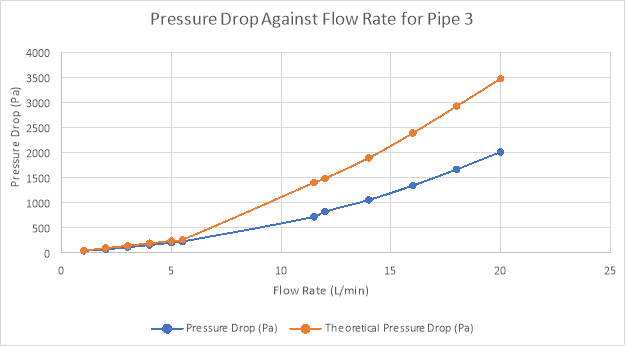
Fig 5 – Theoretical and experimental pressure drop of pipe 3 against flow rate
- Analysis of Results
There are many differences between the pressure drops of the pipes and also differences between the experimental and theoretical pressure drops in the graphs of each individual pipe and this comes down to a number of factors, some of which are very likely to do with the assumptions made prior to starting this investigation
Pipe 3 had a much higher theoretical and experimental pressure drop than both pipe 1 and pipe 2. This is most likely to do with pipe 3 having the smallest diameter as all other factors about this pipes regarding the assumptions were kept the same, this shows that the pressure drop is inversely proportional to the diameter and this was actually predicted by the Darcy-Weisbach equation and so the experimental results provide evidence for the validity of the equation for its relationship between pressure and diameter.
The clearest observation in these results is that the deviations between experimental and theoretical pressure drops were substantially greater in pipe 2 than any other pipe. Pipe 2 can be compared to pipe 1 to find out why since everything about these pipes were kept the same, this must mean that one or more of the assumptions were invalid. The one that was most likely invalid was assuming that all the pipes were smooth as there can be nothing else that would have caused the significant difference in pressure drops between the two pipes according to the Darcy Weisbach equation. The length and diameter were kept the same, even if the fluid was compressible although it was assumed to be incompressible, this would have affected both pipes the same way and the velocity was dependant on the dynamic viscosity, Reynolds number, density and diameter which was again kept all the same so velocity between the two pipes would have been the same. Friction factor therefore must be causing the differences and so pipe 2 must have been rougher than pipe 1 and pipe 3 to cause such a deviation from the theoretical data so the assumptions all pipes were smooth was wrong.
A non dimensional comparison can also be seen in the graphs below for each pipe with Reynolds number plotted against experimental friction factor to directly compare the pipes.
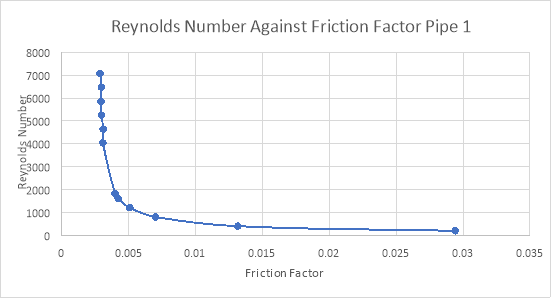
Fig 6 – Reynolds number against friction factor of pipe 1
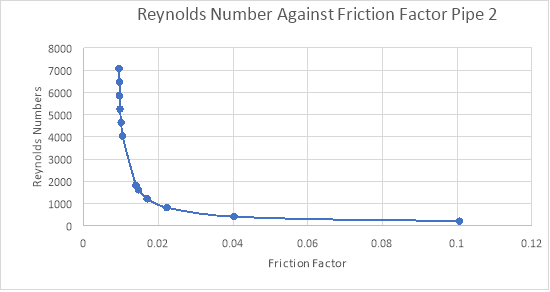
Fig 7 – Reynolds number against friction factor of pipe 2
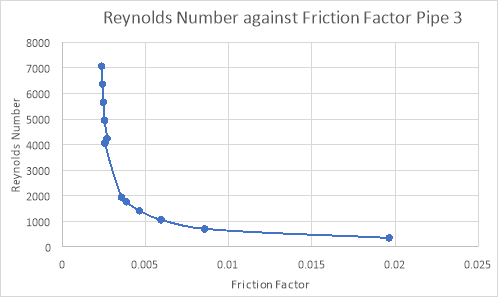
Fig 8 – Reynolds number against friction factor of pipe 3
From these graphs it can clearly be seen that at the same Reynolds numbers, pipe 2 has a much greater friction factor than the other pipes which provides further evidence that pipe 2 has a much greater roughness which is why all the experimental data has deviated so much in pipe 2 since it was assumed to be smooth. Pipe 1 and 3 have similar friction factors at the same Reynolds numbers and with relatively low friction factors which provides evidence that they were relatively smooth and so conformed to the assumptions of the experiment more accordingly.
As mentioned before, flow rate in laminar flow had a linear relationship with pressure drop, it was directly proportional whilst pressure drop in turbulent was proportional to the squared flow rate. This was also predicted by the Darcy-Weisbach equation but indirectly perhaps. Flow rate is proportional to the velocity as shown by the equations listed in the method section. Velocity squared will therefore be proportional to the flow rate squared and since in the Darcy-Weisbach, pressure drop is proportional to the velocity squared, it is also proportional to the flow rate squared. This does not occur in laminar flow however due to the velocities being too small for there to be a noticeable square relationship but as flow rate and velocity increases the relationship becomes more prominent which is why it can be seen in turbulent regimes.
Air was also assumed to be incompressible and this is unlikely as air is in the gas state. There was likely to be compression and with compression changes of density occur so density most likely did not stay the same like it was assumed and this may have had an impact on the results and it may have caused the experimental pressure drops to be lower than the theoretical in pipes 1 and 3
Another reason why the theoretical pressure drops were greater than the experimental in pipes 1 and 3 may be because there were leaks in the pipes , these leaks would have meant that the experimental velocity was lower than expected, leading to a lower experimental pressure drop. Human error could have also played a role in this as the rotameters did not have a high resolution with intervals of 1Lmin-1 and 10Lmin-1 so it is possible the flow rates had measurement inaccuracies which may have contributed to these results.
- Conclusion
In conclusion the Darcy-Weisbach equation was accurate in predicting the trends and relationships of all the parameters that were being changed in this investigation which has provided evidence for its use particularly in industry. The parameters that affect pressure drop were also thoroughly investigated and analysed to give more of an understanding to how pressure drop occurs and the main factors. Although some of the assumptions were most likely invalid, even the discovery of this gave an insight to the factors that affect pressure drop the most as the analysis of the results show that roughness is a very significant factor that governs pressure drop. The differences that did occur in experimental and theoretical data were also sufficiently explained with the errors that could have occurred and also the assumptions that were most likely affecting the experimental data and causing the deviance from theoretical. Although the trends were predicted effectively, more research could be done on how accurate Darcy-Weisbach is in predicting the exact pressure drop turbulent as it was unclear exactly how much the assumptions and errors affected the results, so future experiments with different parameters could be carried out in order to further prove the validity and accuracy of this equation, particularly in turbulent flow.
- References
1) Ron Marshall, William Scales, Gary Shafer, Paul Shaw, Paul Sheaffer, Rick Stasyshan, et al. Improving Compressed Air System Performance: A Sourcebook for Industry v3, 2016.
2) White Frank M., Fluid Mechanics, McGraw-Hill Education, 7th edition, February, 2010, ISBN: 978-0077422417
3) U.S. Department of Energy, Thermodynamics, Heat Transfer, and Fluid Flow. DOE Fundamentals Handbook, Volume 1, 2 and 3. June 1992
4) Sutera, Salvatore P.; Skalak, Richard “The History of Poiseuille’s Law”. Annual Review of Fluid Mechanics. (1993) 25: 1–19.
5) Brown, G. O. ”The History of the Darcy-Weisbach Equation for Pipe Flow Resistance” (2003)
6) Engineering ToolBox, Friction Coefficient with Laminar Flow (2008)
7) Churchill, S.W. “Friction factor equation spans all fluid-flow regimes”. Chemical engineering. 84 .(1977).
8) University of Birmingham, School of Chemical Engineering (2018)
Cite This Work
To export a reference to this article please select a referencing stye below:
Related Services
View all


DMCA / Removal Request
If you are the original writer of this essay and no longer wish to have your work published on UKEssays.com then please click the following link to email our support team:
Request essay removal