Charpy Impact Testing
| ✅ Paper Type: Free Essay | ✅ Subject: Engineering |
| ✅ Wordcount: 995 words | ✅ Published: 23 Sep 2019 |
Charpy Impact Testing
Introduction
Charpy impact testing is designed to measure the energy absorbed by a force placed on different materials that allow us to measure the material’s resistance to failure. The amount of energy a material can absorb or “impact energy” allows us to determine the ductile to brittle transition temperature (DBTT) as well as the ductility of the material itself. Usually, the more ductile a material, the more energy it will absorb due to its tendency to resist fracturing. We used the Charpy test because it is not only cost effective, but it is straightforward and simple to use. The test determines impact energy buy staging a swinging pendulum at a certain height then releasing it to strike a sample thus measuring the energy absorbed by comparing the height the pendulum rises after impact to the height from which it was dropped. Our pendulum had a scale that gave the resultant energy on a scale of 150kJ. We tested various materials with different compositions in various thermal conditions to see the effect of temperature on ductility and brittleness.
Results
|
Table 1: Estimated DBTT (°C) |
|
|
Material |
DBTT |
|
1018 Normalized |
-30 |
|
1045 Normalized |
No Transition |
|
1095 Normalized |
-30 |
|
1045 Cold-Finished |
175 |
|
304 Stainless Steel |
No Transition |
|
6061 Aluminum |
No Transition |
|
PVC |
No Transition |
Table 1 DBTT for Materials

Table 2 Summary of Temperature, Impact Energy, and Fracture Results
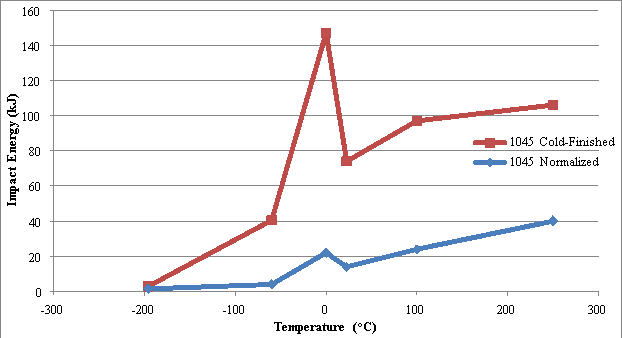
Figure 1: Impact energy for 1045 N and 1045 CF vs Temperature
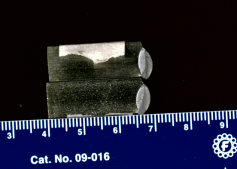
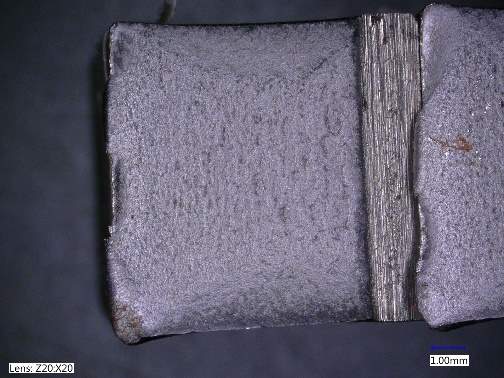
Image 1 1045 CW at 250°C with Camera Image 2 1045 CW at 250°C with 20x Keyence
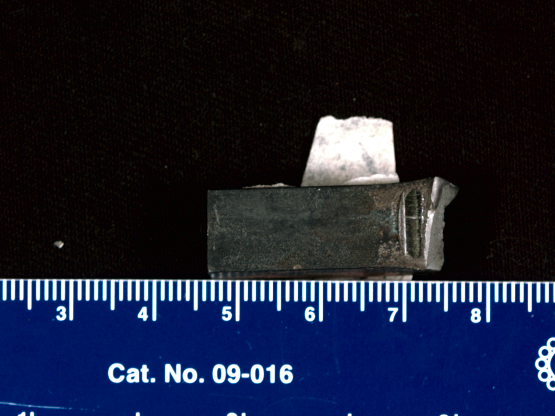
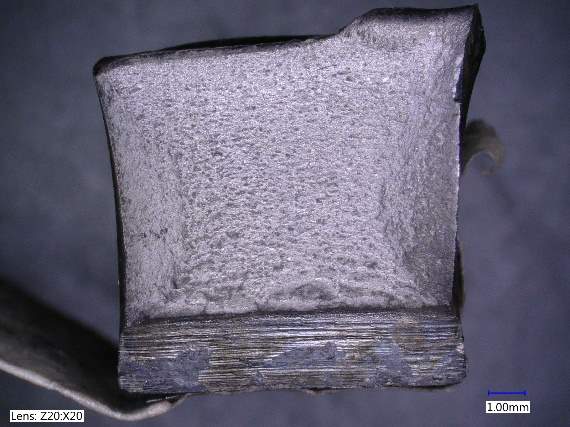
Image 3 1045 Normalized at 250°C with Camera Image 4 1045 Normalized at 250°C with 20x Keyence
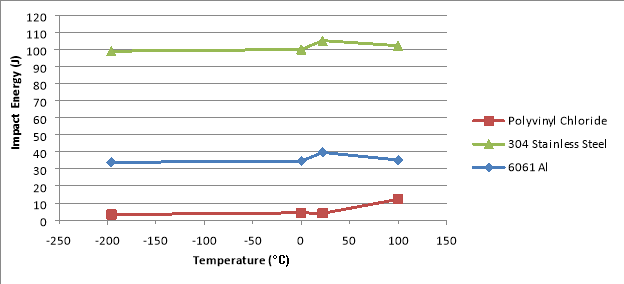
Figure 2: Impact energy for PVC, 6061 Al, and 304 SS vs Temperature
Discussion
Figure 1 above shows the difference in impact energy of two 1045 normalized steel versus 1045 cold worked steel at different temperatures. We can clearly see that the 1045 normalized had higher impact strength than the 1045 coldworked. From images 1 and 2 we see that the fracture surface of 1045 CW at 250°C is more ductile than that of the 1045 N. When we look at the raw data; however, we see that the normalized was able to absorb more energy showing that the normalization of the material increased its strength. From Images 1 and 3 we can see that another result of that normalization was an increase in brittleness.
DBTT is the temperature that allows us to calculate where the material changes from brittle to ductile failure [1]. Before DBTT, the 1095 normalized sample was ductile until it reached -60°C as we can see in Table 2. The reading for 1095 at 250 °C is very low at only 2kJ, and does not follow the trend for impact energy for this material, so I believe this to be an error when loading the sample into the impact machine. When comparing the 1045 to the 1018 sample, we can see that while 1018 had higher strength and did not fail from 22°C to 100°C while 1045; however, did even though they are both composed of plain carbon. We did not have a sample for 1018 at 250°C so there is a discrepancy in the data trend at that point. The 1045 cold worked steel became ductile at a much larger temperature than the 1018, and when we look at the composition of 1045 and 1018 we see that it has a larger carbon content. This shows that larger the carbon content, the more brittle the sample [2] When comparing the other plain carbon samples, we see a trend of the impact energy decreasing as percent carbon decreased.
Figure 2 shows the effect of temperature on the impact energy PVC, 6061 Al, and 304 SS. When viewing these results, we have to keep in mind that PVC could not be tested at 250°C or 100°C due to its low melting temperature. From this graph we can clearly see that 304 stainless steel had the best impact strength. From Table 2, the results for impact energy and the viewed fracture surface for each material at its tested temperature clearly show that 304 stainless steel absorbed the majority of the impact energy at all temperatures.
When looking at Figure 2, we see the different impact energies of polyvinyl chloride (PVC), 6061 aluminum alloy aluminum alloy, and 304 stainless steel. The PVC was very brittle especially when tested below room temperature where the sample shattered verses having a smooth brittle failure like the metals. It also has the lowest impact energy than any other material. This explains why we use steel alloys and not PVC in heavy industrial applications. PVC’s strength is very low and it would likely fail if excessive force or weight were to be applied. The 304 stainless steel had the highest impact energy of all other tested materials its composition shows that it less than 0.12% carbon and the rest is mostly chromium, a highly ductile metal. The inclusion of chromium as well as the low percent carbon explains why the stainless steel’s ductility is so high, and why it absorbed the majority of the energy of the force applied by the pendulum.
Conclusion
The Charpy test has allowed us not only to see the impact energy of various materials, but it has explained how composition, temperature, normalization, and cold working affect the strength and ductility of a material. As carbon content increases, we have observed that impact energy increases. The addition of more ductile metals into carbon-based steel alloys for an extremely ductile material which can absorb large amount of energy. With temperature, we saw that with most materials an increase in temperature increased impact energy and ductility, while a decrease led to a sharp decline of impact energy and a large decrease in ductility resulting in brittle failure.
References
- Askeland, Donald R., Pradeep P. Fulay, and Wendelin Wright. The Science and Engineering of Materials. 7th ed. Cengage Learning, 2016. Print.
- Gannon, Robert. “What Really Sank the Titanic?” Popular Science 246, no. 2 (February 1995): pp 49-55.
- Standard Test Methods for Notched Bar Impact Testing of Metallic Materials, E 23-07, 2007 Annual Book of ASTM Standards, American Society for Testing and Materials.
- William F. Smith, Structure and Properties of Engineering Alloys, Second Edition, McGraw-Hill, 1993.
Cite This Work
To export a reference to this article please select a referencing stye below:
Related Services
View all


DMCA / Removal Request
If you are the original writer of this essay and no longer wish to have your work published on UKEssays.com then please click the following link to email our support team:
Request essay removal