Belt Drive Laboratory Exercise
| ✅ Paper Type: Free Essay | ✅ Subject: Engineering |
| ✅ Wordcount: 1513 words | ✅ Published: 30 Aug 2017 |
An investigation into the relationship between tensions in a slipping pulley and comparison of experimental and theoretical results
The transmission of power across machines and systems in industry is vitally important and belt drives can provide this in a cheap but efficient form. In this experiment, a flat belt was attached around a pulley at four separate contact angles and the tensions both before and after the pulley were recorded as the mass was changed to investigate the belt tension ratio and efficiency of the pulley, and how this compared to theoretical results. The experimental and predicted results were found to be very similar, confirming the expectation that an increase in contact angle would cause an increase in belt tension ratio. Also, a peak efficiency of 67.95% was measured which was significantly lower than the average modern day efficiency of 95%.
2. List of Symbols
|
Symbol |
Meaning |
|
µ |
coefficient of friction between belt and pulley |
|
α |
half vee belt angle |
|
β |
angle of contact between belt and pulley |
|
T1 |
tension after pulley |
|
T2 |
tension before pulley |
|
mm |
millimetres |
|
N |
newtons |
|
V |
volts |
|
A |
amps |
|
g |
grams |
|
ω |
rotational speed |
|
rpm |
revs per minute |
|
η |
efficiency |
|
POUT |
output power |
|
PIN |
input power |
|
T |
torque |
|
Nm |
newton metres |
Belt drives are a cost effective, easy to use devices designed for power transmission between machines or shafts. The origins of traction devices can be traced back as far as the Babylonians and Assyrians with flat belts, made of leather, becoming the main source of power transmission in factories during the industrial revolution. Although flat belts are still used today, the introduction of vee belts by John Gates in 1917 revolutionised short distance power transmission, being able to generate more power than a flat belt for a pulley of certain diameter. Modern belt drives are able to transmit power at an efficiency of 90-98%, averaging 95% [1].
Vee belts provided the opportunity for continuously variable transmission with their ability to work on pulleys of variable diameters, a useful advantage over other forms of transmission. However, the main disadvantage is the slip between belt and pulley which can limit the efficiency of the drive; the factors contributing to this are the belt profile, the friction and the amount of torque. This report investigates the relationship between the tensions in a stationary flat belt pulley and subsequently the torque and efficiency, comparing the experimental results with expected values calculated using the theory outlined below.
Given the coefficient of friction µ, vee belt angle 2α and angle of contact β (rad), the relationship between higher tension  and lower tension
  in a slipping pulley, known as the belt tension ratio, is given by the following equation:
 [2] (equation 1)
Given for a flat belt α = 90° and knowing sin (90°) = 1, this equation can be rewritten:
 (equation 2)
It is this theoretical equation which the experimental results will be compared against in order to analyse the relationship between the belt tension ratio and coefficient of friction.
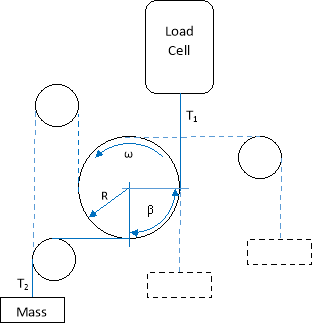

Belt drive system set up as shown above in figure 1, with the central pulley of radius 50mm and a load cell measuring with an uncertainty of ±0.005N.
DC electric motor to provide initial rotational movement of the central pulley, measuring voltage (V) with an uncertainty of ±0.05V and current (I) with an uncertainty of ±0.005A.
Masses, 100g each, to vary the load applied at the free end of the string
Hand held optical tachometer capable of measuring rotational speed (ω) of the pulley with an accuracy of ±0.5rpm.
The free end of the string was placed accordingly to ensure the angle of contact, β, between the belt and pulley was π/2. The motor supply voltage was set to 10V and it was made sure that the pulley was rotating in the correct direction by checking T2 > T1. The spring balance was zeroed before the minimum load, 100g, was placed on the free end of the string and a measurement for T1 recorded off the spring balance. 100g masses were then added individually until a maximum mass was applied and the value on the spring balance after the addition of each mass was recorded. These masses were then removed, the angle of contact changed, and the experiment then repeated for angles of π, 3π/2 and 2π. The maximum mass was achieved when the motor was close to stalling but the voltage value still read 10V.
When performing the experiment at the 3π/2 angle of contact, values for current and pulley rotational speed were also measured after the addition of each 100g mass. The current (I) was measured by the digital multimeter while the rotational speed of the pulley (ω) was measured using the hand held optical tachometer.
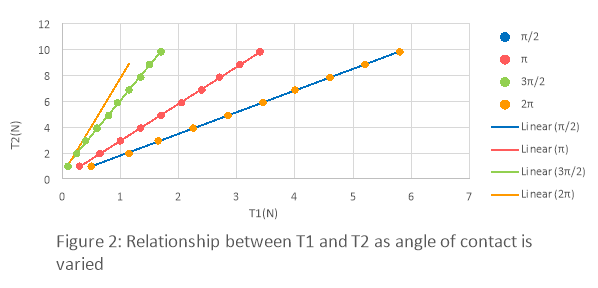
The tension after the pulley (T1) and the mass added to the free end of the string were recorded and collected in a table, which can be found in Appendix A. The values for the mass were converted from kg to N to give the corresponding tensions (T2). A graph of T2 against T1 (figure 2) was then drawn for all four angles of contact β.
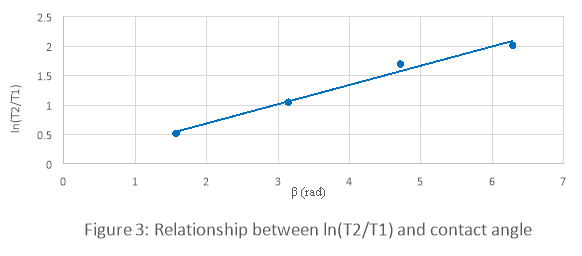
This experimental value was calculated from figure 3 to be 0.3269. Using this value and equation 1 for all four angles, a theoretical plot of the belt tension ratio was able to be produced and compared with the experimental results achieved at the four points, shown through figure 4.
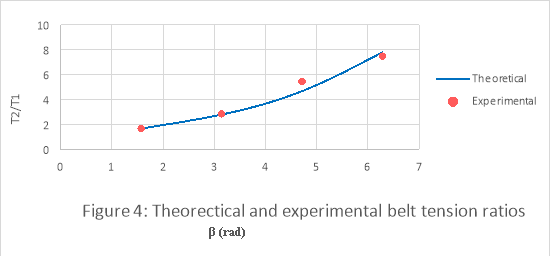
It was expected that as the angle of contact increased, the value of T1 would decrease and therefore the value of the belt tension ratio would increase. It can clearly be seen from the experimental data points produced in figure 4 that the results from this experiment were as expected.
Also from figure 4, an analysis of the experimental data points and the theoretical line of best fit shows a clear correlation between the two calculations, confirming the theory discussed during section 3 of the report. The slight differences found between these two forms of data, particularly at β=3π/2 where the largest error is found, can be accredited to systematic errors due to the measurements from the load cell.
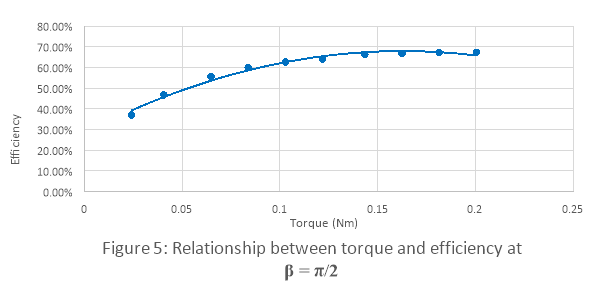
Observing figure 6, the motor efficiency shows a generally increasing trend though the curve begins to flatten out as T2 reaches 9.810N. This shows the relationship between torque and efficiency not to be linear but instead parabolic, demonstrating the idea of a peak efficiency at each contact angle. By differentiating the equation of the line of best fit we can calculate that the maximum efficiency is achieved at a torque of 1.627 Nm with this efficiency being 67.95%. This efficiency is significantly smaller than the modern day average of 95% stated in the introduction; this difference in values can be attributed to various factors affecting the calculations. Firstly, it was assumed that the motor driving the pulley was 100% efficient; in reality this would not be the case as there would be energy lost internally through friction, cooling systems and core losses. Secondly, this experiment was conducted using a constantly slipping flat belt as opposed to a more commonly used form of transmission such as a vee belt, where higher efficiencies would be anticipated.
To conclude, the experiment outlined in this report was useful in demonstrating the relationship between tensions in a slipping pulley, successfully validating the theory from section 3 that belt tension ratio is related to angle of contact; as β tends towards 2π, the belt tension ratio tends towards a maximum due to an increased area of contact and consequently larger friction.
In the experiment, a maximum efficiency of 67.95% was calculated at a torque of 1.627 Nm. The graph of efficiency against torque analysed in section 5 demonstrates a need to find the optimum torque of a system in order to achieve maximum efficiency from it.
The findings from this experiment are statistically insignificant as the nature of the pulley does not correspond to common industry types. However, the experiment was useful in showing the basic relationships between angles of contact, belt tension ratio and efficiency found in belt drives and the effect slipping can have on the output of these systems.
|
Ï€/2 |
Ï€ |
3Ï€/2 |
2Ï€ |
||||
|
Weight (kg) |
T2 (N) |
T1 (N) |
Current (A) |
Speed (revs/min) |
T1(N) |
T1(N) |
T1 (N) |
|
1.0 |
9.810 |
5.80 |
3.8 |
1218 |
3.40 |
1.70 |
– |
|
0.9 |
8.829 |
5.20 |
3.5 |
1239 |
3.05 |
1.50 |
1.15 |
|
0.8 |
7.848 |
4.60 |
3.2 |
1256 |
2.70 |
1.35 |
1.00 |
|
0.7 |
6.867 |
4.00 |
2.9 |
1280 |
2.40 |
1.15 |
0.90 |
|
0.6 |
5.886 |
3.45 |
2.6 |
1308 |
2.05 |
0.95 |
0.75 |
|
0.5 |
4.905 |
2.85 |
2.3 |
1340 |
1.70 |
0.80 |
0.60 |
|
0.4 |
3.924 |
2.25 |
2.0 |
1370 |
1.35 |
0.60 |
0.45 |
|
0.3 |
2.943 |
1.65 |
1.7 |
1399 |
1.00 |
0.40 |
0.35 |
|
0.2 |
1.962 |
1.15 |
1.3 |
1429 |
0.65 |
0.25 |
0.25 |
|
0.1 |
0.981 |
0.5 |
1.0 |
1470 |
0.30 |
0.10 |
0.10 |
|
[1] |
Carlisle Power Transmission products, Inc., “Energy loss and belt efficiency,” [Online]. Available: http://www.clark-transmission.com/images/pdf/carlisle/energy_loss_and_belt_efficiency.pdf. [Accessed 9 February 2016]. |
|
[2] |
J. Darling, “ME 10010 Solid mechanics 2 – Belt Drive Labratory Exercise,” University of Bath, 2016. |
|
[3] |
University of Geulph, Department of Physics, “What is torque?,” [Online]. Available: https://www.physics.uoguelph.ca/tutorials/torque/Q.torque.intro.html. [Accessed 16 February 2016]. |
|
[1] |
PIX Transmissions Limited, “Belts – Brief history and types,” [Online]. Available: http://www.pixtrans.com/blog/belts%E2%80%93brief-history-and-types.html. [Accessed 9 February 2016]. |
|
[2] |
Groschopp, “Efficiency and losses in electric motors,” 24 March 2015. [Online]. Available: http://www.groschopp.com/efficiency-and-losses-in-electric-motors/. [Accessed 10 February 2016]. |
|
[3] |
Habatec, “Introduction to the power transmission flat belt drive,” 2011. [Online]. Available: http://www.habatec.net/HNet/HabaTEC.nsf/vwWebContent/FF5800BDAD1854E0C12571CA0028442B?OpenDocument. [Accessed 10 Feb 2016]. |
|
[4] |
IHS Engineering360, “Flat belt pulleys,” [Online]. Available: http://www.globalspec.com/learnmore/motion_controls/power_transmission/flat_belt_pulleys. [Accessed 15 February 2016]. |
|
[5] |
J. Darling, “ME 10010 Solid mechanics 2 – Belt Drive Labratory Exercise,” University of Bath, 2016. |
|
[6] |
V. R. Chennu, “Belt drives – types, advantages, disadvantages,” 31 October 2015. [Online]. Available: http://me-mechanicalengineering.com/belt-drives-types-advantages-disadvantages/. [Accessed 15 February 2016]. |
Cite This Work
To export a reference to this article please select a referencing stye below:
Related Services
View all


DMCA / Removal Request
If you are the original writer of this essay and no longer wish to have your work published on UKEssays.com then please click the following link to email our support team:
Request essay removal