Automated Diabetic Retinopathy Detection System
| ✅ Paper Type: Free Essay | ✅ Subject: Engineering |
| ✅ Wordcount: 4042 words | ✅ Published: 30 Aug 2017 |
ABSTRACT
DETECTION OF EXUDATES USING GUI
Automated diabetic retinopathy detection system is an essential requirement due to developing diabetic retinopathy patients around the globe. The primary intention of the research is to detect exudates in digital fundus image for diabetic retinopathy. In this particular study, we provide an efficient method for identifying and classifying the exudates as soft exudates and hard exudates. Apart from these, this study compares three methods namely Contrast Limited Adaptive Histogram Equalization, Histogram Equalization and Mahalanobis Distance for enhancing a digital fundus image to detect and choose the best one to classify exudates in Retinal images by adopting graphical user interface with the help of MATLAB. From the findings of the study, in the image enhancement application of blood vessels, Mahalanobis distance is recognized as the best algorithm. It was evident from the analysis that the monitoring and detecting exudates in the fundus of the eye are essential for diabetic patients. Moreover, it shows that hard and soft exudates are a primary tool of diabetic retinopathy that can be quantified automatically. In addition to these, it appears that drawbacks must be resolved to predict an appropriate detection method for exudates in digital fundus images. From the findings, it was evident that suitable algorithm has to be selected and verified on several images which provide likely and excellent outcomes.
LIST OF TABLES
- Comparison of Histogram Equalization (HE),
Contrast Limited Adaptive Histogram Equalization (CLAHE)
and Mahalanobis Distance(MD)……14
LIST OF FIGURE
- Image before enhancement
- Histogram before enhancement
- Image after histogram equalization
- Histogram after HE
- Image after CLAHE
- Histogram after CLAHE
- Image after Mahalanobis distance enhancement
- Histogram after Mahalanobis distance enhancement
- Flow chart of the method
- CIELab color space
- Input image
- K-means clustered image
- Morphological image
- Dilated image
- Eroded image
- Optic disc detection
- Exudates image
- Â Hard and soft exudates
- Input DFI
- Â Enhancement methods of DFI
- Step-1 of exudate detection
- Step-2 by giving input image
- Step-3 enhancing input image
- Step-4 exudates image of abnormal eye
- Normal eye output displaying no exudates
LIST OF ABBREVIATIONS
AHE Adaptive Histogram Equalization
CIE Commission Internationale de l’Eclairage
CLAHE Contrast Limited Adaptive Histogram Equalization
CMYK Cyan, Magenta, Yellow, Key
DRD iabetic Retinopathy
DFI Digital Fundus Image
HE Histogram Equalization
MD Mahalanobis Distance
MM Mathematical Morphology
RGB Red, Green, Blue
RRGS Recursive Region Growing Segmentation
Chapter 1
Introduction
Research Background:
Diabetic retinopathy is a common disease nowadays that can prevail in anyone having type 1 or type-2 diabetes. The opportunity of being influenced by this disease relies on the time duration of a person having diabetes. Long-term diabetes leads to greater blood sugar level that causes harm by changing the flow of blood in retinal blood vessels. It is similar that in the previous stage DR shows no symptoms and hence without facing medical investigation it is not feasible to predict the existence of the disease. Exudative retinopathy is a condition referred by the occurrence of yellow or white mass that exists due to leakage of proteins and fats along with water from vessels of blood in the retina. It is important to predict the exudates occurrence in fundus oculi because the collection of these exudates may lead to complete loss of vision (Manpreetkaur, 2015). Walter et al. (2001) has mentioned that the disease of DR evolved exudates in eye fundus. The physicians regard exudates as one of the primary indicators of DR severity. Exudates are yellow spot resided in fundus. This disease of diabetes causes leakage of fluid from vessels of blood. For a long time, uncontrolled diabetes may evolve as exudates in eye fundus. The exudates initiate to develop in little number and size. If the diabetes is not monitored or controlled for a long time the number and size of exudates will grow. The exudates growth in eye fundus may cause blindness. Tasman and Jaeger (2001) have stated that exudates seem as bright deposits of yellow-white on the retina due to lipid leakage from abnormal vessels. Their size and shape differ with various stages of retinopathy. These lesions are related to many diseases of retinal vascular involving DME (diabetic macular edema), DR (diabetic retinopathy), retinal venous obstruction, hypertensive retinopathy, radiation retinopathy and retinal arterial microaneurysms, capillary hemangioma of retina and disease of the coat. Welfera et al. (2010) have stated that exudation is a hazardous case because it can lead to a loss of vision when existing in the central macular area. Thus such lesions must be predicted, and appropriate medical intervention must be acquired to avoid damages to visual acuity of the patient. Automatic exudates detection in DR patients’ retinas could enhance early prediction of DR and could support doctors track the treatment progress over time.
Thus it can be inferred that exudates detection by computer could provide a precise and rapid diagnosis to specialist examination and support the clinician to acquire timely decision to take proper treatment.
Problem Statement:
Diabetes is a rapidly developing common disease among people globally which causes various organs dysfunction. Diabetic retinopathy is the primary blindness cause in adults. Sometimes, due to long-term diabetes, the retinal blood vessels are harmed, this eye disease is known as diabetic retinopathy. It is essential to automatically predict the lesions of diabetic retinopathy at an early stage to hinder further loss of vision. Exudates are significant diabetic retinopathy symptoms. Exudates are bright lesions that are an important sign of this disease. It is the major signs of DR a major vision loss cause in diabetic patients.
Primary concern of the research
- Aim:
The primary goal of the study is to analyze an automated way for exudates in eyes.
- Objectives:
- To examine the causes of exudates in diabetic retinopathy patients.
- To analyze the types of exudates used in digital fund images.
- To evaluate the different enhancement methods used to predict the exudates in fundus images.
- To determine the drawbacks of enhancement methods of exudates in digital fundus images.
- To propose a promising algorithm to detect the exudates in digital fundus images.
Limitations of the study:
- This study is limited to diabetic retinopathy patients.
- This study is restricted to exudates detection only.
- This study evaluates an automated way for exudates in eyes.
The structure of the thesis
This argument is made up of the following five chapters:
- Chapter 1: This is the introduction section that gives the necessary research background andconcepts related to the research.
- Chapter 2: This chapter is the review of literature that analyzes several existing worksrelated to finding an automated way for exudates in eyes.
- Chapter 3: This chapter describes the design of the system that explains in detailabout the enhancement methods applied in digital fundus image for detection of diabetic retinopathy.
- Chapter 4: This chapter discusses the implementation plan of digital fundus images and compares different researches done by authors and depicts the results of the proposed system.
- Chapter 5: This is the conclusion section that gives the outcome of the research byanswering the research questions and recommendations for future improvement.
In addition to that, this thesis has bibliography containing the sources used in collecting secondary data in the study and an appendix that has tools like questionnaires are utilized in the gathering primary data for the research.
Chapter-2
Introduction:
This chapter provides an overview on the detection of exudates in digital fundus image for diabetic retinopathy. This chapter discusses in detail about the digital fundus image. In addition to these, this chapter discusses in detail about the classification of exudates in retinal images. Apart from these, this study provides the comparison of Histogram equalization (HE), contrast limited adaptive histogram equalization (CLAHE) and Mahalanobis distance (MD) methods to enhance the digital fundus image for detection.
Literature on Digital fundus images
The benefits of digital imaging are rate of access to information (images), quick and accurate duplication, chronicling and transmission, and prompt access to the outcomes. The imaging technique can be rehashed if the nature of the underlying result is deficient. Despite the fact that film-based images can be digitized (to register macular color thickness conveyance from two different wavelength-based pictures or to evaluate the status of the optic nerve), quick access to the images is unrealistic, as it is important to build up the film first. This deferral keeps the picture from checking the outcomes and in this manner redressing any issue in the procurement procedure, which can be efficiently accomplished in digital imaging at no extra cost. The digitization of fundus photos was tended to by (Cideciyan et al., 1991) who proposed a nonlinear rebuilding model fusing four parts: the eye, the fundus camera, the film and the scanner. Scholl et al. (2004) observed digitized images to be valuable for evaluating age-connected maculopathy and age-connected macular degeneration.
Comparison
Table 1: Comparison of Histogram Equalization (HE), Contrast Limited Adaptive Histogram Equalization (CLAHE) and Mahalanobis Distance (MD)
|
Histogram equalization |
Contrast limited adaptive histogram equalization |
Mahalanobis distance |
|
This technique is based on the specification of the histogram. |
CLAHE is considered as the necessary preprocessing step, and it has the tendency to generate the images for extracting the features of a pixel in the classification process. |
This method has carried out by identifying the pixels of the background images only by leaving the foreground images. |
|
HE is relatively straightforward technique and an invertible operator. Indiscrimination is one of the biggest disadvantages of this method. |
CLAHE is also denoted as the automatic and efficient method to detect the exudates effectively. |
The selective enhancement of MD has created the fewer artifacts for further processing than HE and CLAHE. |
|
HE has used the neighborhood-based approach on the pixels, and it has the tendency to operate based on the modification of histogram to obtain the new images efficiently. |
The technique of CLAHE has the capability to provide the green channel image enhancement with high quality. |
This method can produce the similar curve to the Gaussian-shaped curve ideally. |
|
HE has uniformly distributed the output histogram by using the cumulated histogram like the mapping function. |
CLAHE has limited the process of amplification by clipping the histogram at the predefined value. |
MD algorithm has given better histogram result when compared to HE and CLAHE |
Research gap:
This study examines about the detection of exudates in digital fundus image for diabetic retinopathy. The research gap predicted in this study is that there are many studies on the detection of exudates in digital fundus image for diabetic retinopathy. But no studies have clearly determined the successful approaches towards the detection of diabetic retinopathy in fundus images. Detection and classification of diabetic retinopathy pathologies in fundus images have been investigated by Agurto (2012). He studied the effects of image compression and degradation on an automatic diabetic retinopathy screening algorithm. In addition to these, the Agurto et al. (2012) investigated the detection of hard exudates and red lesions in the macula using the multi-scale approach. Walter et al. (2002) carried out an investigation to contribute the image processing to the diagnosis of diabetic retinopathy. Authors also focused on automatic detection of diabetic retinopathy from eye fundus images (Manpreetkaur, 2015). There are also studies that are focused on coarse-to-fine strategy for automatically identifying exudates in color eye fundus images.
Chapter-3
Research Design
Introduction:
This part examines the design of the study to determine an automated way for finding exudates in eyes. This study compares three methods namely CLAHE (Contrast Limited Adaptive Histogram Equalization), Histogram Equalization (HE) and Mahalanobis Distance (MD) for enhancing a digital fundus image to detect and choose the best one to classify exudates in Retinal images by adopting graphical user interface in MATLAB.
Research design:
The reason of the study is to detect exudates in digital fundus image for diabetic retinopathy. In this particular study, we provide an efficient method for identifying and classifying the exudates as soft exudates and hard exudates. The retinal image seen in the CIELab space of the color is pre-processed for eliminating noise. Further, a network of blood vessels is removed for facilitating detection and removing the optic disc. At the same time, optic disc is removed using the technique of Hough transform. Candidate exudates are identified using the method of k-means clustering. At last, exudates are categorized as the soft and hard one by their threshold and edge energy. Developed method has yielded better outcomes.
Histogram Equalization:
Histogram equalization is a technique for adjusting image intensities to enhance contrast. HE is an operation that is based on histogram specification or modification to obtain new pictures. The objective of this contrast enhancement technique is to get a new enhanced image that has a uniform histogram that only plots the frequency at each gray-level from 0 (black) to 255 (white). Each histogram represents the frequency of occurrence of all gray-level in the image.
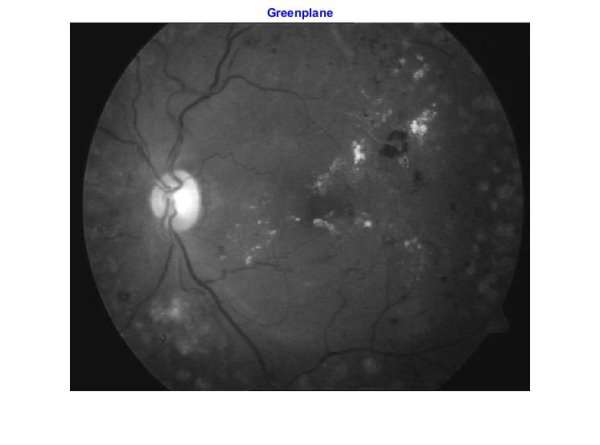
Figure 1: Image before enhancement
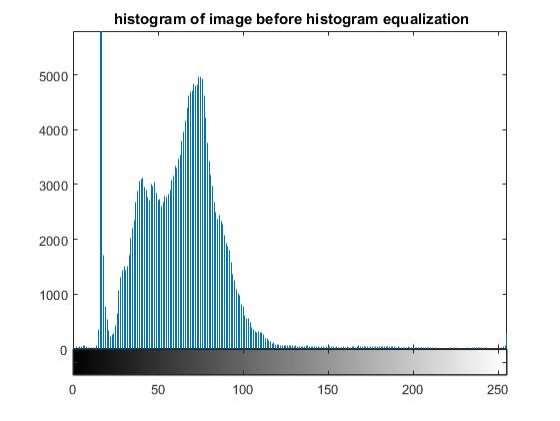
Figure 2: Histogram before equalization
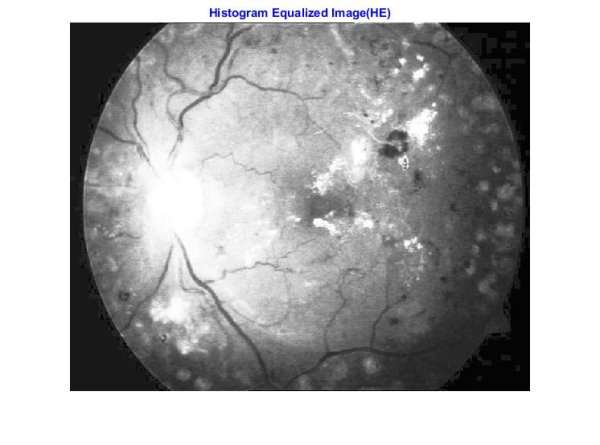
Figure 3: Image after histogram equalization
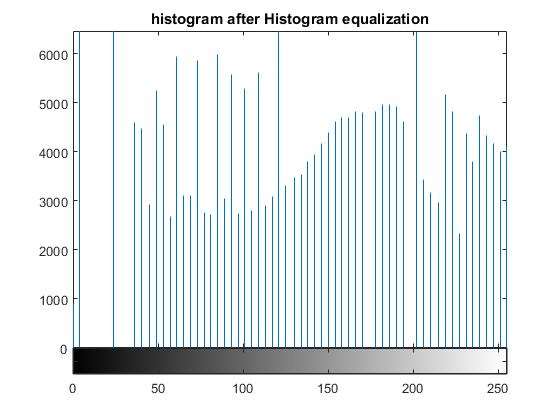
Figure 4: Histogram after histogram equalization
Contrast Limited Adaptive Histogram Equalization:
CLAHE is considered as a locally adaptive method for contrast enhancement. CLAHE is an enhanced version of adaptive HE (AHE) method. The technique AHE has a realistic restriction that homogenous part in the image leads to over-amplification of noise due to thin series of pixels are plotted to a whole range of visualization. In the meantime, it was noticed that contrast limited AHE (CLAHE) was designed for preventing this noise over-amplification in homogenous regions. CLAHE restricts the sound amplification in the image in such a way that image looks like very real.
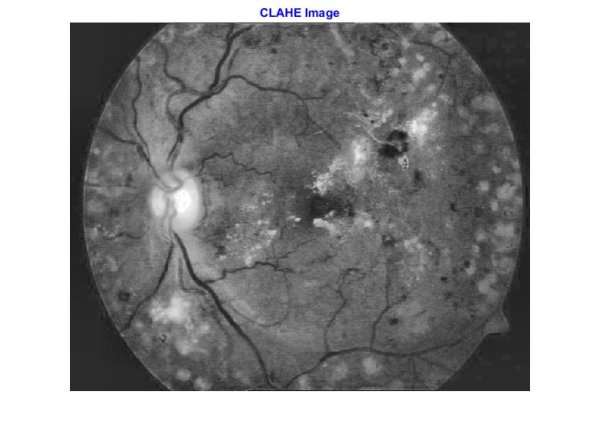
Figure 5: Image after CLAHE
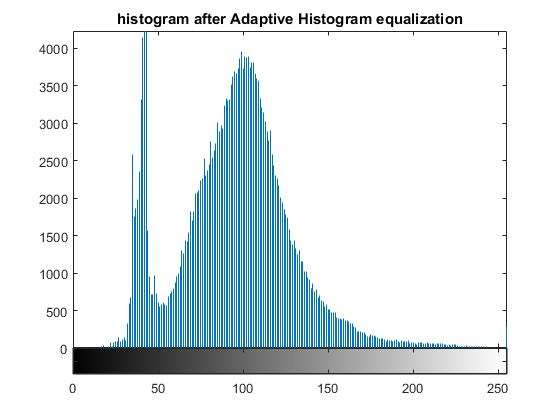
Figure 6: Histogram after CLAHE
Mahalanobis Distance:
Image enhancement using the Mahalanobis distance method is performed by identifying the background image pixels and eliminating them, leaving only the foreground image. It is based on the assumption that in image neighborhood N, the background pixels has significantly different intensity value than those of the foreground pixels. For each pixel (x, y) in the picture, the mean µn (x, y) and the standard deviation σn (x, y) of the statistical distribution of intensities in N are estimated. The sample means; µn is used as the estimator for µn (x, y) and the e sample standard deviation; σ n is the estimator for σn (x, y). If the intensity of pixel (x, y) is close to the mean intensity in N, it is considered to belong to the background set β. As defined mathematically in Eq. 1, the expression implies that pixel (x, y) belongs to β if the stated condition is satisfied.
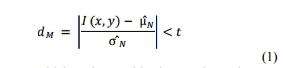
Those images would later be combined to evaluate the MD image, which can be segmented using the threshold t to identify the background pixels.
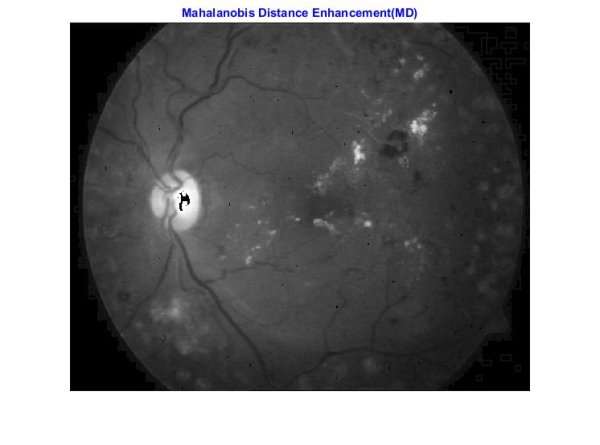
Figure 7: Image after MD enhancement
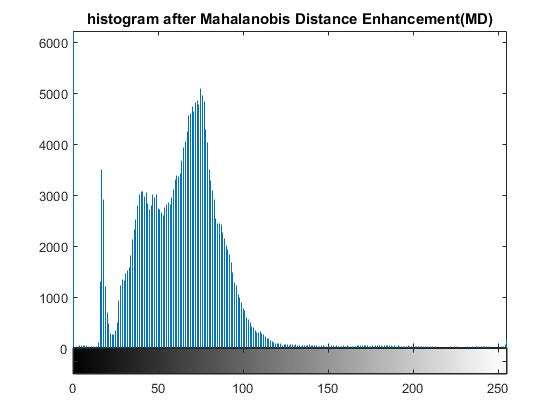
Figure 8: Histogram after MD enhancement
Summary:
This research compares three methods namely CLAHE, HE, MD to enhance a digital fundus image to detect and choose the best one to classify exudates in Retinal images by adopting graphical user interface in MATLAB. It was evident from the above findings that candidate exudates are identified using the technique of Mahalanobis Distance enhancement.
Chapter 4
Implementation Plan, Discussion, and Results
Introduction:
This chapter presents the implementation plan of detection of exudates in digital fundus images by proposed technique. The results of proposed method are also shown.
Implementation Plan:
The proposed system is implemented using the digital fundus images. DFIs (digital fundus images) are essential in finding the pathological fact that would lead to different diseases. However, digital fundus images have many illumination and contrast issues which make enhancement an important factor. Subsequently, digital fundus images must be developed to permit for good visualization to satisfy ophthalmologists to undertake their diagnosis. The below figure shows the implementation plan of detection of exudates in digital fundus images:
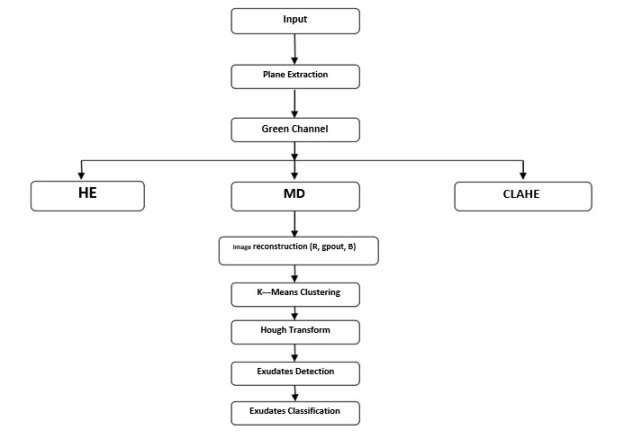
Figure 9: Flow chart of the method
4.3 Conversion from RGB color space to CIELab color space
A Lab color space is a color-opponent space with dimension L* for lightness and a* and b* for the color-opponent dimensions, based on nonlinearly compressed CIE XYZ color space coordinates.
The CIELab color scale is an approximately uniform color range. In a standard color scale, the differences between the points plotted in the color space correspond to the visual difference between the colors plotted. The CIELab color space is organized in a cube form. The L* runs from top to bottom. The maximum for L* is 100, which represents a perfect reflecting diffuser. The minimum for L* is zero, which represents black. The a* and b* axes have no specific numerical limits. Positive a* is red, Negative a* is green. Positive b* is yellow, Negative b* is blue.
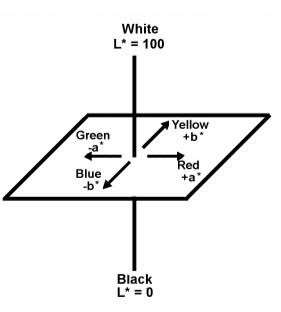
Figure 10: CIELab color space
It is perceptual uniform color space. Perceptual uniformity means how two colors differ from seeing when human observe that two colors. Hence uniform color spaces were defined in such way that all the colors are arranged by the perceptual difference of the colors.
The L component closely matches human perception of lightness, and by having it as an independent quantity to control, it can be used to make accurate color corrections without affecting the a* and b* color twins. RGB or CMYK color spaces are designed to model the output of physical devices rather than human visual perception. This color model is used in this work to identify even a small intensity variation.
K-means Clustering
K-means clustering is a method of vector quantization, originally from signal processing, that is accessible for cluster analysis in data mining. K-means clustering aims to partition n observations into k clusters in which each observation belongs to the cluster with the nearest mean, serving as a prototype of the cluster. This results in a partitioning of the data space into Voronoi cells. K-Means algorithm is chosen because of its simplicity. In this work, k-means clustering is used to partition the data into groups for identifying exudates locations.
K-means Usage in our project:
Because of the computational simplicity of the k-means algorithm over other clustering algorithms, we decided to use the k-mean clustering in the proposed work. The k-mean clustering algorithm is a particular case of the generalized hard clustering algorithms. It is applied when point representatives are used, and the squared Euclidean Distance is adopted to measure the dissimilarities between vectors and cluster representatives. The k-means algorithm is given below.
The steps involved in K-Means algorithm are:
- Select an initial partition with k clusters
- Generate a new partition by assigning each pattern to its closest cluster center.
- Compute new cluster centers.
- Continue to do steps 2 and 3 until centroids do not change.
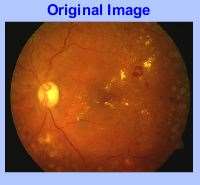
Figure 11: Input image
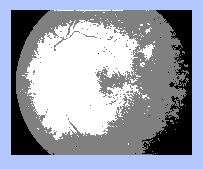
Figure 12: k-means clustered image
Blood vessel detection
To facilitate exudates extraction from the pre-processed image, blood vessel network is detected and then eliminated from the picture using Morphological operations. Morphological operations can readily be used in medical image analysis as it supports powerful tools to extract pathologies. The morphological operations employed in the proposed work are given below.
An important part of applying morphological operations is to decide on the shape and size of structuring element. In the proposed work, a ball-shaped structuring element of size 8, was found to be optimal for eliminating the blood vessel network from the retinal images of local database
Morphological Image Processing:
Mathematical morphology (MM) is a theory and technique for the analysis and treatment of geometrical structures, based on set theory, lattice theory, topology, and random functions. MM is most commonly applied to digital images, but it can be employed as well on graphs, surface meshes, solids, and many other spatial structures.
Topological and geometrical continuous-space concepts such as size, shape, convexity, connectivity, and geodesic distance, were introduced by MM on both continuous and discrete spaces. MM is also the foundation of morphological image processing, which consists of a set of operators that transform images according to the above characterizations.
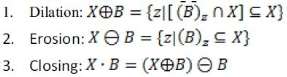
The basic morphological operators are erosion, dilation, opening, and closing.
Dilation:
Dilation is one of the two first operators in the area of mathematical morphology, the other being erosion. The primary effect of the operator on a binary image is to gradually enlarge the boundaries of regions of foreground pixels (i.e. white pixels, typically). Thus areas of foreground pixels grow while holes within those regions become smaller. The dilation operator takes two pieces of data as inputs. The first is the image which is to be dilated. The second is a (usually small) set of coordinate points known as a structuring element (also referred to as a kernel). It is this structuring element that determines the precise effect of the dilation on the input image.
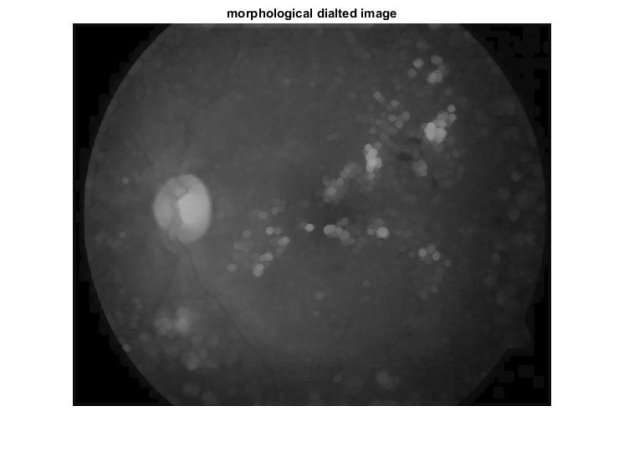
Figure 13: Dilated image
Erosion:
Erosion is one of the two first operators in the area of mathematical morphology, the other being dilation. The main effect of the operator on a binary image is to erode away the boundaries of regions of foreground pixels (i.e. white pixels, typically). Thus areas of foreground pixels shrink in size, and holes within those areas become larger. The erosion operator takes two pieces of data as inputs. The first is the image which is to be eroded. The second is a (usually small) set of coordinate points known as a structuring element (also referred to as a kernel). It is this structuring element that determines the precise effect of the erosion of the input image.

Figure 14: Eroded image
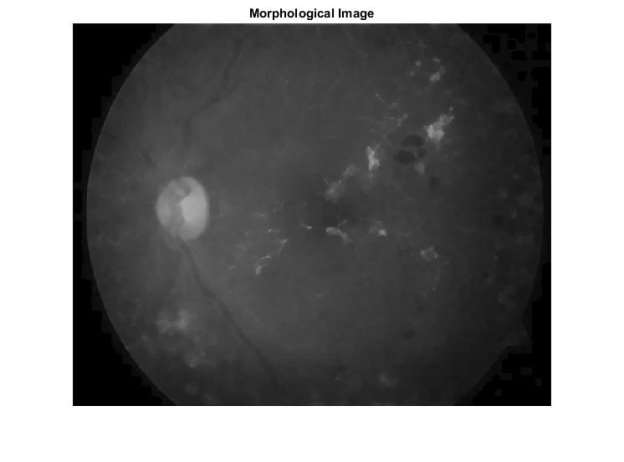
Figure 15: Morphological image
Hough Transform
The Hough transform is a feature extraction technique used in image analysis, computer vision, and digital image processing. The purpose of the method is to find imperfect instances of objects within a particular class of shapes by a voting procedure. This voting process is carried out in a parameter space, from which object candidates are obtained as local maxima in a so-called accumulator space that is explicitly constructed by the algorithm for computing the Hough transform.
In this project work, circular Hough transform is used to detect optic disk in a retinal image. Elimination of optic disk is necessary for detection of exudates. If the optic disk is not eliminated from a picture, there is a chance of identifying optic disk as exudates, which leads to the false result.
Circular Hough Transform Algorithm works is presented below.
Step1: Convert color retinal image into grayscale
Step2: Create a 3D Hough array (accumulator) with the first two dimensions representing thecoordinates of the circle origin, and the third dimension represents the radii.
Step3: Perform edge detection using the Canny edge detector. For each edge pixel, increment thecorresponding elements in the Hough array.
Step4: Collect candidate circles, and then delete similar circles.
Step5: Circle the object.
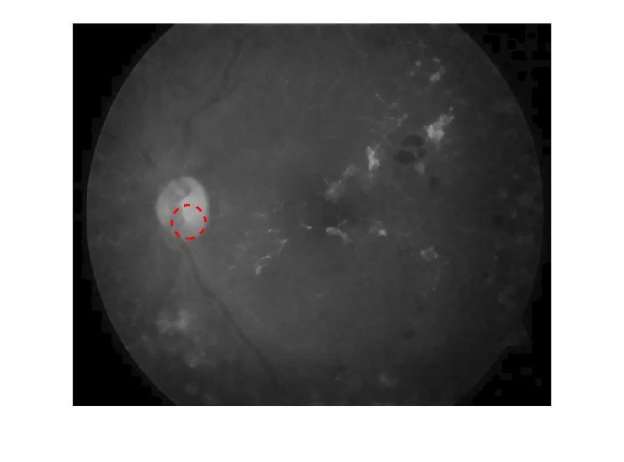
Figure 16: Optic disc detection
Classifying Hard and Soft exudates
The final step is to classify the exudates as hard and soft based on the threshold value and edge energy. Edge power calculation is required to extract the exudates with sharp edges which are a characteristic feature of hard exudates. We preferred canny operator over Kirsch operator for edge energy detection. The hard exudates are extracted by combining this edge energy and a
Threshold value. To obtain the soft exudates subtract the hard exudates image from the picture that contains both types of exudates. Hard exudates and soft exudates are classified by using reference sum value of white pixels in exudates image.
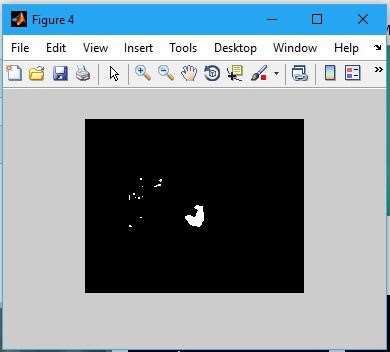
Figure 17: Exudates image
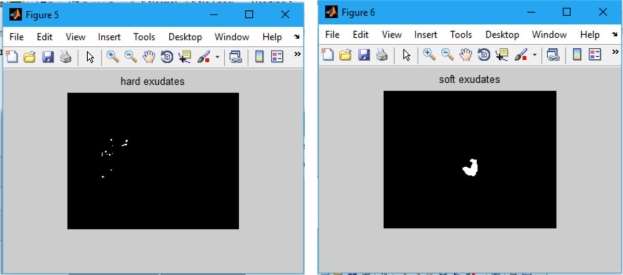
Figure 18: Hard and soft exudates
Chapter 5
Results and Conclusion
Introduction:
This section presents the results and conclusion of the research by answering research questions and suggestions for future studies.
Results:
From the proposed system the results acquired are that the exudates are predicted, then it is categorized as hard, and soft exudates and the severity level is estimated. The first figure shows the input as an original image:
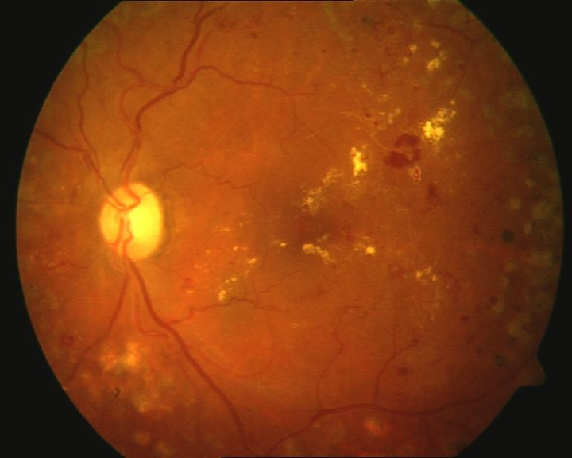
Figure 19: Input image
Source: Author
In the next figure the enhancement methods are applied to digital fundus images for detection of diabetic retinopathy:
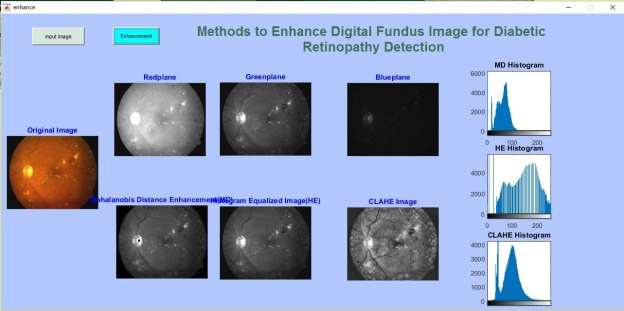
Figure20: Enhancement methods of DFI
Next, the exudates are detected which is depicted in the below set of figures:
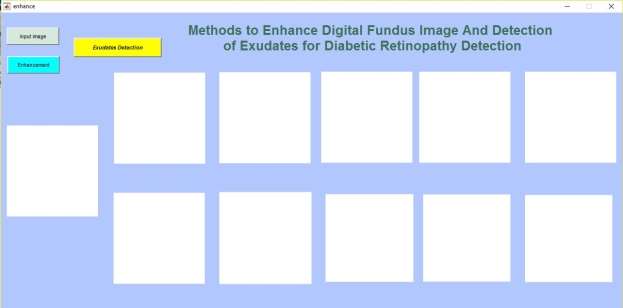
Figure 21: Step-1 of exudate detection
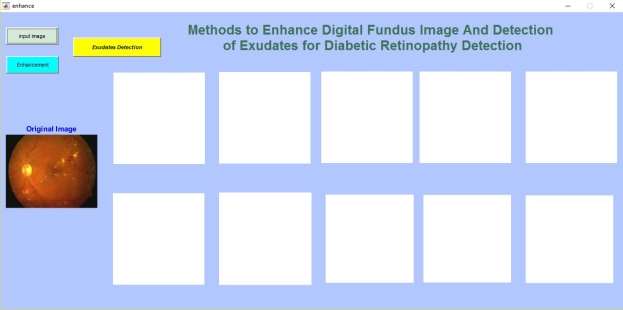
Figure 22: Step-2 giving input image
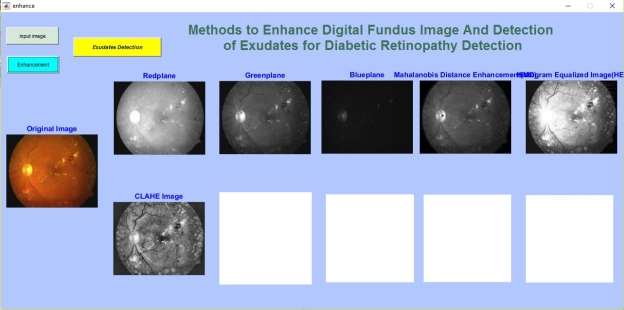
Figure 23: Step-3 enhancing the input image
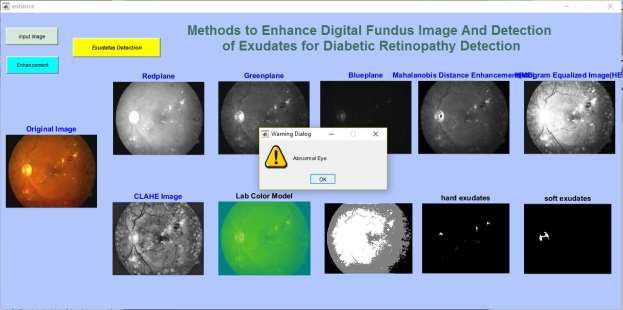
Figure 24: exudate image of abnormal eye
Repeating the same procedure for normal eye and is shown in the following figure:
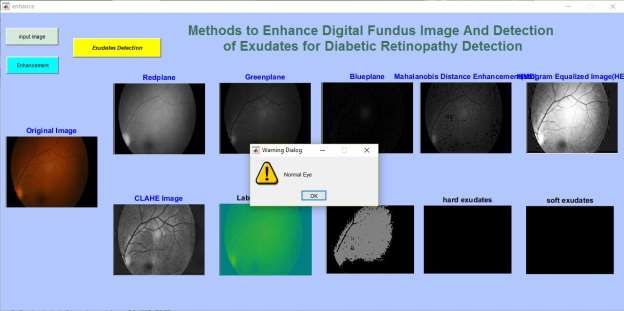
Figure 25: Normal eye output displaying no exudates
The results of the study reveal that Mahalanobis Distance is the best algorithm for the blood vessels image enhancement application. Throughout the experiment, we have found an average of 88% sensitivity and 60% accuracy.
Conclusion
Automated diabetic retinopathy detection has become an important research because of the severity of increase in cause of blindness among the diabetes patients. DR is caused mainly by the alterations in retina’s blood vessels due to increased level of blood glucose. Exudates are one of the major signs of D
Cite This Work
To export a reference to this article please select a referencing stye below:
Related Services
View all


DMCA / Removal Request
If you are the original writer of this essay and no longer wish to have your work published on UKEssays.com then please click the following link to email our support team:
Request essay removal