Using RStudio to Prepare and Clean Data
| ✅ Paper Type: Free Essay | ✅ Subject: Computer Science |
| ✅ Wordcount: 1291 words | ✅ Published: 18 Aug 2017 |
There is now more data available than ever before, the depth and scope is increasing daily. The explosion of the internet and connected devices has increased this and big data is now big business. With the increase in data available to us, so has the need for analysis of this data. Many companies use this data to predict future trends. Also, what has changed is the tools we use to analysis and present this data in a meaningful way.
In the past statistical software was very expensive and often with no graphical capabilities. Enter the R programming language a tool that supports both, first released in 1995 with the first stable build in 2000, now on version 3 which was released in 2013. R is a free open source project with over 7000 add on packages available. Many companies such as Google and Facebook are using R for their data analysis.
In this lab book we will look at cleaning and preparing data so it can analysed. We will use R Studio which is an IDE (Integrated development environment) for the R programming language. R Studio is available as an open source or commercial version, it has two editions R Studio desktop and R Studio Server and runs on Windows, macOS and Linux operating systems.
The dataset we have is from the UK government, and is based on MOT outlets in England, Scotland, and Wales, it contains data such as name, address, post codes, telephone numbers and categories of vehicles tested. On quick analysis of the dataset there are a lot of blank fields, extra white spaces, typo’s in the telephone column as well as second telephone numbers separated by the “/” symbol.
Using R Studio we will attempt to tidy and clean the dataset. In this lab book we will explain the various commands and techniques used to prepare the data for analytical analysis.
- Make a copy of the data to work with:
Method: Here we make a copy of the original dataset x2016motsitelist and call it MotList, this is good practice as you will not contaminate the original dataset.
Test:
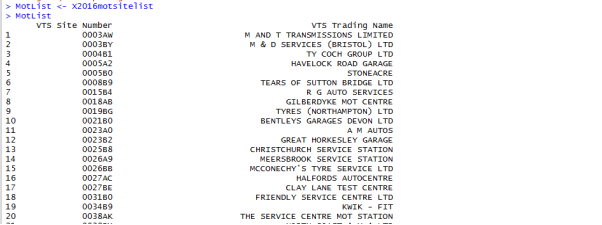
Result: From the above screen shot you can see we have renamed our dataset to MotList, by using the name of the dataset in R studio it lists the dataset in a screen dump on the console.
- Get the Stucture of Our Data Frame
Method: by using the str() command in the console we get the structure of our data.
Test:
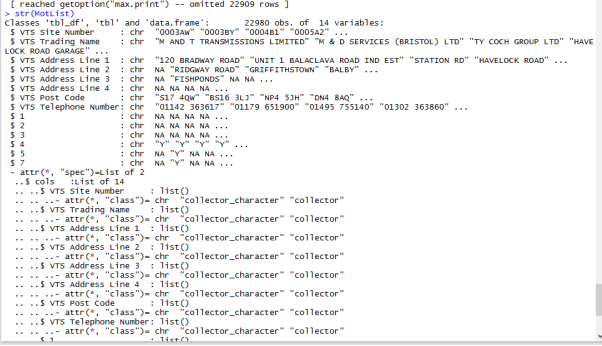
Result: by using the structure command str() we can see that our dataset has 22,980 objects and 14 different variables. The next lines which contain $ indicate column headings and display some of the components included in these columns. This command just provides a list with components and names.
- View the data
Method: Using the Head command to view the data.
Test:
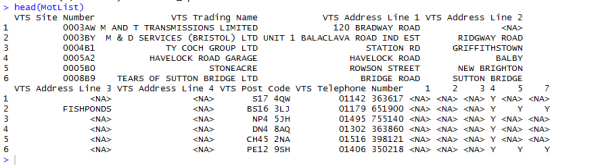
Result: using this command the first 6 records are displayed in the console window.
- ID names of columns
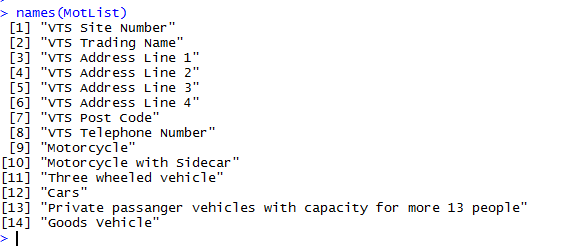
Method: We use the Names command to display column names.
Test:
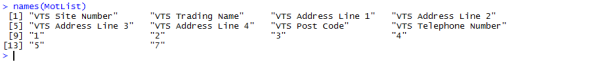
Result: this displays the names of our columns in the console window.
- Summary of what is contained in the columns
Method: we use the Summary command to get an overview of the data in our columns.
Test:
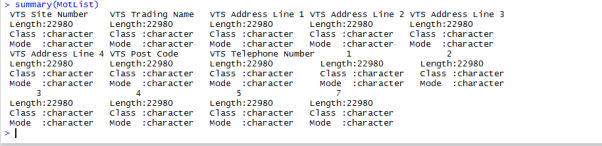
Result: the summary command gives us an overview for every vector in the data frame, tells us in our case that the length is 22980 rows, that all vectors are character classes.
- Missing values
Method: we will use the is.na command, combination of is.na with the any command and lastly the sum command to check for missing values in the data.
Test:
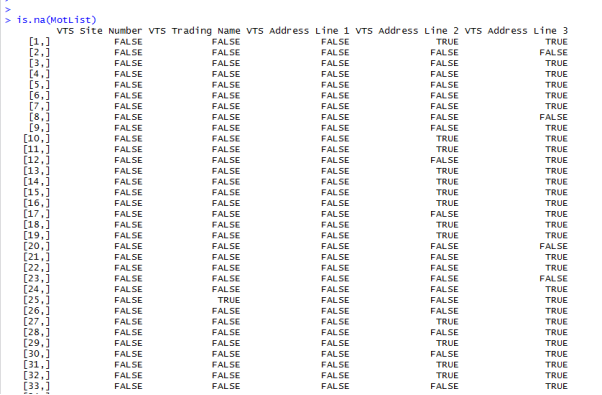
Result: the result of the is.na command returns a Boolean true or false result on the data set to tell us if a missing value is present or not.
Test:
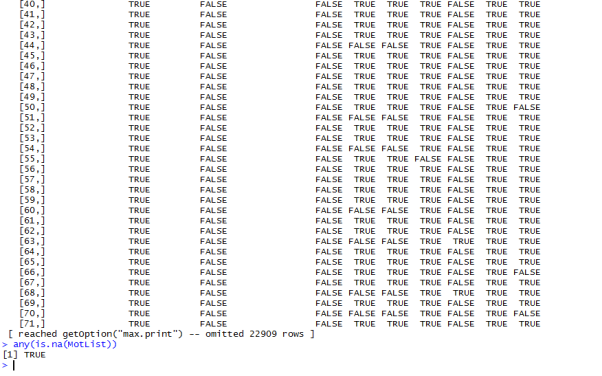
Result: with the use of the any command we find that there is indeed missing data in the dataset.
Test:
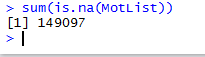
Result: with the use of the sum command we get the number of missing records, which is 149097 in this case.
- Rename columns in our data set.
Method: we use the colnames command to change the columns in our data set that are numbered 1,2,3,4,5 and 7.
Test:
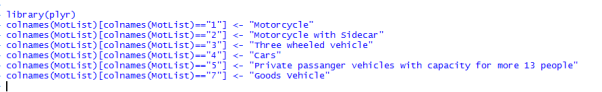
Result: with the use of the above commands we change the name of the columns using the name to identify which column to apply the name change to. We use the names(MotList) to verify the result.
Test:
- Remove NA from the different categories of vehicle that are Mot tested
Method: we create another copy of our dataset and call it MotListMod, on this dataset we will change the NA values in the columns that we renamed earlier so that the different categories of vehicles tested will have complete values and no missing data. We do this by giving the dataset name and then the $ column name, we then use the which command and is.na to change the value to the desired result.
Test:
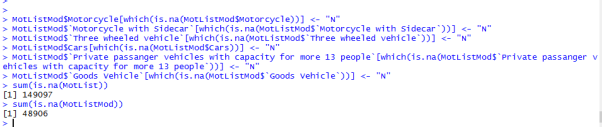
Result: As can be seen from the screen shot above, we have changed the NA values in the six columns of our dataset, our dataset now tells us if a Mot test centre carries out tests on the different vehicle categories Y or N, were as before it only told us the if the centre did Y with a blank field for N. Again, we run the sum is.na command on both datasets we have, now the MotListMod dataset has far less Na’s in the dataset.
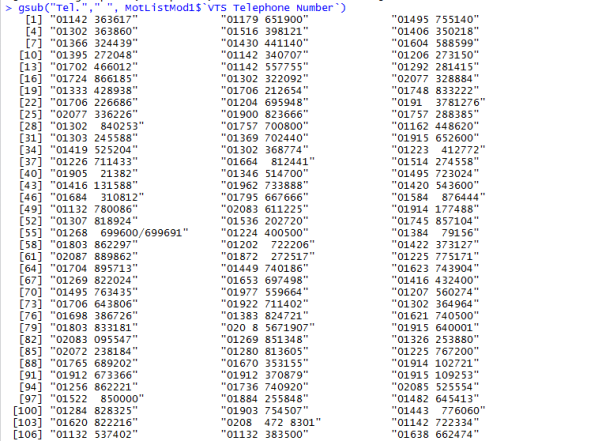
- Remove and tidy up VTS Telephone column.
Method: Firstly, using the GSUB command we removed instances of “Tel.” and “TEL.” from our column, secondly, we separate the column in two sections number 1 and 2 with the SEPARATE command as some of the test centres have two telephone numbers separated by “/” in the dataset, thirdly we tidy up the white space.
Test:
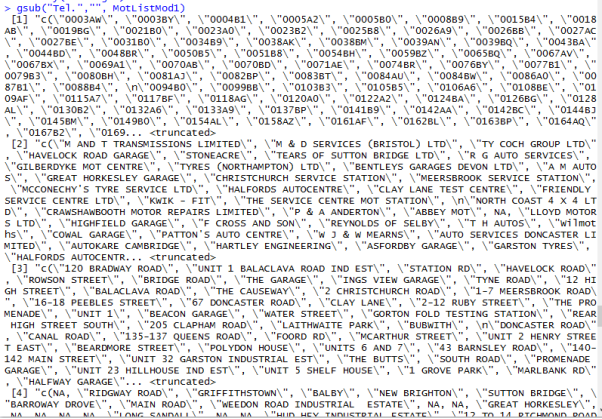
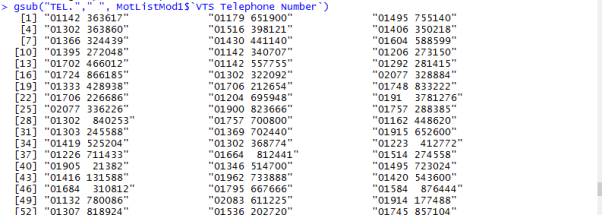
Using GSUB wrongly above didn’t produce the desired outcome, but in the two screens below we get the desired outcome.
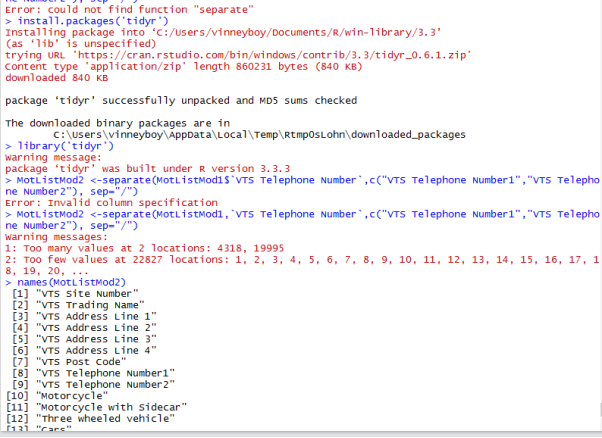
The above screen shows were the VTS Telephone column is split into different sections.
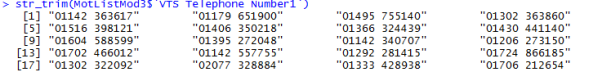
Trimming white space from the front of the telephone numbers.
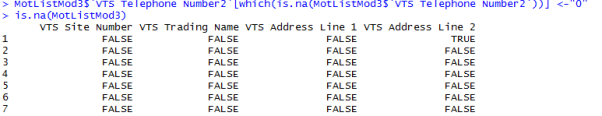
Removing the NA’s from the VTS Telephone number2
Result: By using GSUB and identifying the column we wanted to target, we replaced the instances of “Tel.” and “TEL.” in our dataset with ” ” whitespace, we then proceeded to split the column into two different sections, when we did this it created a lot of NA’s in the second column because not every test centre has two telephone numbers, so to counter act this we replace the NA’s with the value 0. We then tidy up the white space at the start of the two columns.
- Write to CSV file in R studio
Method:Â We will write the MotListMod3 dataset to a CSV file with the WRITE.CSV command.
Test:

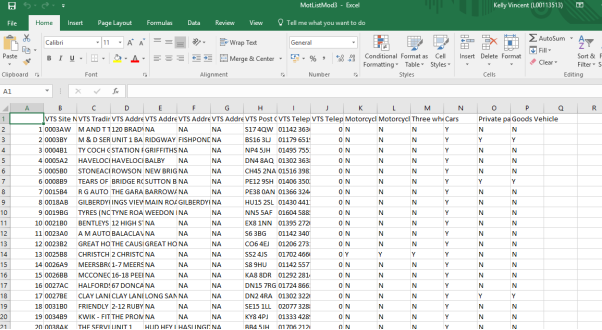
Result: The above command writes the dataset to a csv file and can be viewed or shared with others, see above screen shot of the file in excel.
- Outliers and plot function.
Method: using the HIST command we produce a histogram of the cars column, the columns class had to be changed to a factor form to make the function work, also we used the Table command to count the number of “Y” and “N” in this column.
Test:
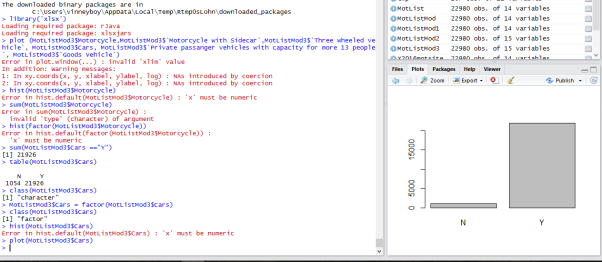
In the screen shot above you can see a histogram of the cars column.
Result: No outliers are present as our columns only have a “Y” or “N” present in the different type of vehicles tested columns. Also, our data was of class character, this had to be converted to a factor form so as we could use the histogram function on the column cars. We used the table command on the column to display a numeric result for N = 1054 and Y=21926.
Cite This Work
To export a reference to this article please select a referencing stye below:
Related Services
View all


DMCA / Removal Request
If you are the original writer of this essay and no longer wish to have your work published on UKEssays.com then please click the following link to email our support team:
Request essay removal