Support Vector Machine Based Model
| ✅ Paper Type: Free Essay | ✅ Subject: Computer Science |
| ✅ Wordcount: 2336 words | ✅ Published: 27 Sep 2017 |
Support Vector Machine based model for Host Overload Detection in Clouds
Abstract. Recently increased demand in computational power resulted in establishing large-scale data centers. The developments in virtualization tech-nology have resulted in increased resources utilization across data centers, but energy efficient resource utilization becomes a challenge. It has been predicted that by 2015 data center facilities costs would contribute about 75%, whereas IT would contribute the remaining 25% to the overall operating cost of the data center. The Server consolidation concept has been evolved for improving the energy efficiency of the data centers. The paper focuses on support vector machine based novel approach to predict the overload and underload pattern of the servers for better data center reconfiguration.
Keywords: Support vector machine, energy efficiency.
1 Introduction
Virtualization plays an important role in cloud computing, since it permits appropriate degree of customization, security, isolation, and manageability that are fundamental for delivering IT services on demand. One of its striking features is the ability to utilize compute power more proficiently. Particularly, virtualization provides an opportunity to consolidate multiple virtual machine (VM) instances on fewer hosts depending on the host utilization, enabling many of computers to be turned-off, and thereby resulting in substantial energy savings.
In fact, commercial products such as the VMware vSphere Distributed Resource Scheduler (DRS), Microsoft System Center Virtual Machine Manager (VMM), and Citirix XenServer offer VM consolidation as their chief functionality[1]. But with the rapid growth in computing demand, the number of datacenters grows with the need which leads to more number of servers active at a time. The high active servers’ ratio leads to more energy emission and production of Carbon dioxide (CO2). According to data centers’ study, the data centers are not utilized up to their maximum utilization level which leads to more active servers, everyone utilized to less than their total capacity. With this in mind, it is worthwhile to attempt to minimize energy consumption through any means available. Various research agencies and universities have contributed into the research and design of heat dissipation and control in the data center. Virtualization is a technology that contributes to the maximum utilization of the servers by virtual machine (VM) consolidation and VM Migration.
The decision of reallocation of virtual machine for VM consolidation depends on the host utilization behavior. The VMs from the under-utilized and over-utilized hosts are relocated to other hosts by packing the VMs on minimum number of hosts. The hosts having no virtual machine are shifted to the passive mode so that the total energy consumption can be reduced. Statistical methods played a great role in predicting the behavior of the host in dynamic manner. The author [3] has proposed various statistical methods for host overload and underload behavior of the hosts in his thesis. These algorithms take input as the previous or current utilization of the hosts and predict the future based on the previous or current state of the system. He has proposed Local Regression, Median Absolute Deviation, Robust Local Regression and Markov Chain model for predicting the overloaded hosts [3]. All statistical models cannot be applied to all the environments. The choice of the statistical methods depends on the input data, because every statistical model is based on some assumptions. Markov chain model assumes that the data will be stationary but complex and dynamic environment like cloud, experience highly variable non-stationary workload. The author [3] in his thesis modified his model by using multisize sliding window workload estimation method so that it can be suitable for the cloud environment.
In this paper we have proposed a prediction based model i.e. Support Vector Machine (SVM) to predict the host utilization to forecast the host overload and underload behavior of the host. The rest of the paper is organized as follows. Section 2 explains the basic concepts and modeling approaches of the Support Vector Machine. In section 3, the literature review related to Support Vector Machine is presented. In section 4 the model is applied to time series forecasting and its performance is compared with those of other forecasting models. Section 5 contains the concluding remarks.
2 Support Vector Machine
Support vector machine is a novel technique based on neural network invented by Vapnik and his co-workers at AT & T Bell Laboratories in 1995. The objective of SVM is to find a generalized decision rule through selecting some particular subset of training data, called support vectors. Training SVMs is equivalent to solving a linearly constrained quadratic programming problem. The quadratic equation is solved such that the solution of SVM is globally optimal and the quality & complexity of the solution does not directly depend on the input space. Another key advantage of SVM is that SVMs tend to be resistant to over-fitting, even in cases where the number of attributes is greater than the number of observations. According to Vapnik there are three main problems in machine learning, e.g. Density Estimation Classification and Regression. In every case the main goal is to learn a function (or hypothesis) from the training data using a learning machine and then conclude general results based on this knowledge. Time series is a series of data points S t  R usually ordered in time. Time series analysis comprises the methods for analyzing the time series data in order to extract meaningful statistics and other characteristics of the data. Time series forecasting models predicts future values based on the previously observed values. The main focus of this paper is to predict the overload and underload behavior of the hosts in cloud data centers based on the previous load pattern of the hosts in the datacenter.
The time series prediction is affected by various factors like data is linearly separable or follows non-linear patterns, the learning is supervised learning or unsupervised learning and on support vector kernels. In Euclidean geometry linear separability is a geometric property of a pair of sets of points. The points are linearly separable or not are decided by visualizing the points in two dimensions plane by taking one set of points as being colored green and the other set of points as red. These two sets are linearly separable if there exists at least one line in the plane with all of the green points on one side of the line and all the red points on the other side. Usually in practical problems the data points are mapped to the high dimensional plane and the optimal separating hyper plane is constructed with the help of some special functions known as support vector Kernels in this new feature space. This method also resolves the problem where the training points are not separable by a linear decision boundary. Because by using an appropriate transformation the training data points can be made linearly separable in the feature space.
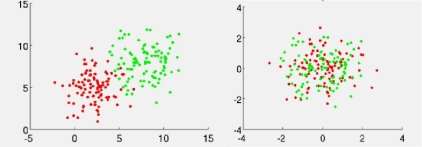
Figure1 (a) Linearly separable data1(b) non-linear patterns of data
In supervisory learning, the training data is composed of input as well as the output vector (also called supervisory signals) whereas in un-supervisory learning the training data is composed of only input vectors. Supervisory learning produces better results because the output vector is already known and the predicted values by the SVM are compared with the output to learn better for the next step. In un-supervisory learning the output data points are not known and the training depends on the probability to drive better results out of it. SVM comes in the supervisory learning category and the kernel function makes the technique applicable for the linear as well as non-linear approximation.
3 Related Works
In various practical domains time series modeling and forecasting has essential importance. A lot of research works is going on in this subject during several years. Many models have been proposed in literature for improving the accuracy and efficiency of time series modeling and forecasting. The author [1] has compared various time series prediction methods widely used these days. This paper investigated the application of SVM in financial forecasting. The autoregressive integrated moving average model(ARIMA), ANN, and SVM models were fitted to Al-Quds Index of the Palestinian Stock Exchange Market time series data and two-month future points were forecast. The results of applying SVM methods and the accuracy of forecasting were assessed and compared to those of the ARIMA and ANN methods through the minimum root-mean-square error of the natural logarithms of the data. Results proved that svm is better method of modeling and outperformed ARIMA and ANN.
The author of [2] explains the time series concept and the various methods of predicting the future values based on ARIMA model, Seasonal ARIMA model, ANN model, time lagged ANN, seasonal ANN, SVM for regression, SVM for forecasting etc. they have also explained the forecast performance measure MFE (Mean Forecast Error), MAE (Mean Absolute error), MAPE (Mean absolute percentage error), MPE (Mean percentage error), MSE (Means squared error) etc. In paper [5], a model based on least squares support vector machine is proposed to forecast the daily peak loads of electricity in a month. In [5] the time series prediction was first used to forecast electricity load .In paper [4] the author has improved the method presented in [5] to derive more accurate results. The author has proposed dynamic least square support vector machine (DLS-SVM) to track the dynamics of nonlinear time-varying systems. The dynamic least square method works dynamically by replacing the first vector by the new input vector to obtain more accurate result..
The author in paper [9] has proposed the modified version on svm for time series forecasting. The algorithm performs the forecasting in phases. In the first phase, self-organizing map (SOM) is used to partition the whole input space into several disjointed regions. A tree-structured architecture is adopted in the partition to avoid the problem of predetermining the number of partitioned regions. Then, in the second phase, multiple SVMs, also called SVM experts, are constructed by finding the most appropriate kernel function and the optimal free parameters of SVMs.
4 Support Vector Machine Regression Formulations for Forecasting Host Overload Detection
Host overload and underload detection is based on current utilization patterns of the host. The host utilization is a univariate time series. In univariate time series the future values are entirely based on past observations. The goal of the SVM regression is to find a function that presents the most  deviation from the target values so the maximum allowed error is
 . The future values are predicted by splitting the time series
  data into training inputs and the training outputs. Given training data sets of N points
 ,
,  with input data
  and output data
  . Assume a non-linear function
  as given below:
 (1)
(1)
w = weight vector, b=bias and  is a non-linear mapping to a higher dimensional space. The optimization problem can be defined as:


 :
:  (2)
(2)
 is a user defined maximum error allowed. The above equation (2) can be rewrite as:
:  (3)
(3)
To solve the above equation slack variables needs to be introduced to handle the infeasible optimization problem. After introducing the slack variables the above equations takes the form as given below:

:  (4)
(4)
The slack variables  defines the size of the upper and the lower deviation as shown in the figure 2(a).
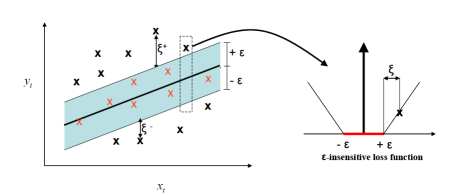
Figure 2 (a) The Accurate points inside  Tube 2(b) Slope decided by C
For simplicity and for avoiding the case of infinite dimensionality of the weight vector w the optimization operation are performed in the dual space[4] the Lagrangian for the problem(a) is given by [2]
 (3)
(3)
Here , where
  are the Lagrange multiples. Applying the conditions of the optimality, one can compute the partial derivatives of L with respect to
  equate them to zero and finally eliminating w and
  obtain the following linear system of equations
 (4)
(4)
Here ,
,  and
and  with
with  is the kernel matrix. The LS-SVM decision function is thus given by [4]
 (5)
(5)
The dynamic least square support vector machine is modified so that it is best suitable for the real world problems. The key feature of DLS-SVM is that it can track the dynamics of the non-linear time varying system by deleting one existing data point whenever a new observation is added, thus maintaining the constant window size.
4 Experiments
We have used CloudSim for retrieving the utilization of the host based on the workload defined in the PlanetLab folder in CloudSim. It contains the daily virtual machine requirement and the utilization of the host is calculated based on the daily requirement of the virtual machines. After retrieving the utilization of the hosts LSSVMLabv1 toolbox is used for support vector regression and the results are compared with [10] and [5]. The comparison is based on MAPE (mean absolute percentage error) and Maximal error (ME). The chart shows that DLS-SVM produce better forecast for the load pattern of the hosts in the data centers.
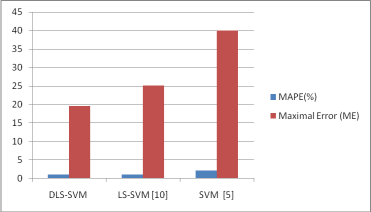
Figure2: Comparison of errors
References
- Okasha, M. K.,Using Support Vector Machines in Financial Time Series Forecasting.International Journal of Statistics and Applications 2014, 4(1): 28-392.
- Adhikari, R., & Agrawal, R. K. (2013). An Introductory Study on Time Series Modeling and Forecasting.arXiv preprint arXiv:1302.6613.
- Beloglazov, Anton. “Energy-efficient management of virtual machines in data centers for cloud computing.” (2013).
- Niu, D. X., Li, W., Cheng, L. M., & Gu, X. H. (2008, July). Mid-term load forecasting based on dynamic least squares SVMs. InMachine Learning and Cybernetics, 2008 International Conference on(Vol. 2, pp. 800-804). IEEE.
- Bo-Jeun Chen, Ming-Wei Chang, and Chih-Jen LIN, “Load forecasting using support vector machines: A study on EUNITE competition 2001”, IEEE Trans. Power Syst., vol. 19, no. 4, pp. 1821-1830, Nov. 2004.
- Fan, Y., Li, P., & Song, Z. (2006, June). Dynamic least squares support vector machine. InIntelligent Control and Automation, 2006. WCICA 2006. The Sixth World Congress on(Vol. 1, pp. 4886-4889). IEEE.
- Kim, K. J. (2003). Financial time series forecasting using support vector machines.Neurocomputing,55(1), 307-319.
- Gui, B., Wei, X., Shen, Q., Qi, J., & Guo, L. (2014, November). Financial Time Series Forecasting Using Support Vector Machine. InComputational Intelligence and Security (CIS), 2014 Tenth International Conference on(pp. 39-43). IEEE.
- Cao, L. (2003). Support vector machines experts for time series forecasting.Neurocomputing,51, 321-339.
- Haishan Wu, Xiaoling Chang. “Power load forecasting with least square support vector machines and Chaos Theory”, Proceedings of the 6th World Congress on Intelligent Control and Automation, Dalian, China, June 21-23, 2006.
- Rüping, S. (2001).SVM kernels for time series analysis(No. 2001, 43). Technical Report, SFB 475: Komplexitätsreduktion in Multivariaten Datenstrukturen, Universität Dortmund.
Cite This Work
To export a reference to this article please select a referencing stye below:
Related Services
View all


DMCA / Removal Request
If you are the original writer of this essay and no longer wish to have your work published on UKEssays.com then please click the following link to email our support team:
Request essay removal