Quality & Performance of Streaming Video(s) over Networks
| ✅ Paper Type: Free Essay | ✅ Subject: Computer Science |
| ✅ Wordcount: 2089 words | ✅ Published: 18 Aug 2017 |
- ABSTRACT
Video-based sharing services have gained a rapid fluctuation in user’s over recent years with the help of the ever-growing internet availability, reaching even the most rural of areas, gaining an increasing share in the multimedia market. Online streaming videos should fulfil strict quality of service constraints. Internet streaming relies upon packet transmission; there are varying influences such as delays, packet loss, transmission errors, data loss and bandwidth restrictions that all influence the quality and playability of a video. This causes serious problems for the end user as the producers of videos rely on the end-users. Therefore, the results of this paper can help user’s determine whether they can view videos in a high quality whilst preserving smooth video transmission. With the use of detailed diagrams, we can see how the network reacts to buffering, low network speeds and congestion in-order to keep sending video data.
Keywords: YouTube, streaming, video, video streaming, network measurement, QoS, TCP, RTSP
- INTRODUCTION
During the last 10 years there’s been a significate growth of the internet video streaming websites such as YouTube (USA), Vimeo (USA), Twitch (USA), Daily Motion (France), Vevo (USA) have grown exponentially in popularity and by viewing the growth of the internet and more and more gadgets connecting to the internet [6], they will keep growing. YouTube alone have over one billion users [4], which in return equates to billions of video requests every day. Global Consumer Internet Video for 2016 is 29,046PB (petabyte), the year 2017 is estimated at 38,297 with a steady yearly increase of 14,000PB[7]. This therefore causes a strain on the internet service providers (ISPs) to increase bandwidth in order to provide stronger/wider and faster broadband connectivity to accommodate such growth. This in comparison to File sharing such as peer-to-peer which includes the likes of BitTorrent which in 2016 was calculated at 5,938PB and has declined to 5,858PB in 2017 with a slight variance there-on-after. In North America alone, YouTube accounts of 17.9% of bandwidth whereas the likes of BitTorrent only account for 2.7% [8]. The most important part of accumulating a vast growth of user’s and popularity is the fact that YouTube is free, from viewing videos, upload your own videos, streaming live or following your favourite channels. It can all be done by signing up to a free account, this ensures that the website can be viewed by a wider audience rather than those of that can legally pay and older, there is a small compromise to pay in the form of adverts randomly placed in-between or at the beginning of videos. Coupled with the fact that YouTube has now offered to pay YouTubers real currency for the popularity of their own videos ensures an even higher number of users. They have recently launched a premium service called YouTube Red, which is their premium service to those willing to pay $10 a month; the benefits include Google Play Music subscription, ad-free videos and premium content not available to free users [9]. YouTube does not have many competitors that can match its popularity but there are some in the likes of Vimeo who have over 100 million visitors per month [10] and a more artistic community where promotional and corporate videos are prohibited, they have four tiers of accounts; Free, Plus, PRO or business each varying is ways from their counterparts. However, a very important difference between the two in the way videos are played. Vimeo uses a constant rate factor (CRF) of 20 whereas YouTube incorporates variable bitrate mode, which allows for lower overall bitrates while maintaining quality. YouTube allows 60fps, 4K & 3D, Vimeo does not, and this is a reason why Vimeo is not as large as YouTube. YouTube has a leading edge compared to others in the respect that where others have strictly controlled content, normally professionally produced, YouTube does not; videos can be uploaded by anyone whom has access to the internet. Internet Connection has high unpredictability rates in the regards of latency and speed reliability, which all depends on location and ISP’s with traffic times, network infrastructure and work load. Videos viewed via the internet is more problematic compared to say, television, thus, YouTube infrastructure manages playback using various methods.
- BODY
Transmission from client to server
YouTube uses Real-Time Streaming Protocol (RTSP) is an application-level protocol, which controls delivery of data with real-time properties; it enables controlled, on-demand delivery of real-time data, such as audio and video [11]. The server starts by sending small RTP (Real-Time Transport Protocol) packets, the data in a bitrate chosen, is sent to the client where their buffer is loaded only slightly before playback occurs. This ensures that not too much bandwidth is used in case the user decides not to continue playing the video, as user’s don’t have a static internet connection, if the user or YouTube’s servers recognise inconsistencies in the connection e.g. packet loss, an altered bitrate can be used instead e.g. the server sends the video but in a reduced encoding rate. When it comes to video playback, smooth transmission is key, without it users grow tired of continual pausing, dropped frames etc. and leave, this cannot do. Therefore, the use of TCP ensures pre-fetching and buffering to ensure smooth playback. As bandwidth is something of an issue when loading videos constantly whilst ensuring smooth continuous playback, TCP guarantees reliable transmission for a no-loss of frames. It also has probing bandwidth and congestion control which will attempt to use all available bandwidth for fetching content as soon as possible. However as YouTube has introduced live streaming in 2015 which opts for UDP (User Datagram Protocol), an application layer protocol, UDP is used because minimum pre-fetching can be done where buffering and pausing is somewhat of a nuisance and should be reduced at all cost as everything is live. It is conjoined with RTSP, another application layer protocol which helps with video streaming. A major drawback of using UDP is that firewalls from ISP or companies are not in favour of allowing the protocol, which cause video traffic and throttling problems. However, with the advantage of lower overhead, the compensation of a few dropped packet will suffice.
In order to deliver videos the use of Content Delivery Networks (CDN), it works by using a globally distributed network of proxy servers, whose job it is to serve content to end-users (the users who are watching the videos) at high performance, where, when a user clicks on a video it is served from the nearest Data Centre from their geolocation. YouTube, before the buyout from Google used LimeLight Networks (LLNW), afterwards Google built their own CDN. Most CDN servers are configured to support web services, therefore streaming over HTTP goes hand in hand, and most firewalls are configured to allow HTTP traffic. The usage of DASH (Dynamic Adaptive Streaming) over HTTP is common practice where the video is split into chunks of various resolutions thus, the player can easily switch into another resolution when the internet bandwidth changes which equates to smooth playback.
Video Playback & Quality
As of January 2015, YouTube migrated to HTML5 for its default web player. YouTube first checks to see if the clients’ browser supports both, HTML5, H.264 codec &or WebM VP8. Many browsers support an in-built flash player, which removes the need for installation of Adobe Flash Player, which has seen a decline in usage, with the amount of resources it requires and security flaws [14]. In addition, as devices such as Apple do not have support for flash there is a large market excluded.
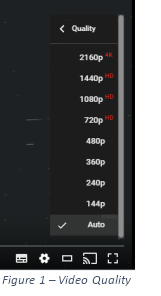 The use of HTML5’s Adaptive Bitrate (ABR) is key [Figure 1]; it allows the player to switch resolutions based on user’s network quality. This has reduced buffering by more than 50% globally and as much as 80% on heavily congested networks [15]. YouTube switched from progressive downloads to adaptive bitrate streaming to allow for switching of quality without the need to re-buffer and start from the beginning.
YouTube is constantly analysing connection speeds between the client and server, when it detects the bandwidth is deteriorating, a lower bitrate video stream is selected, in order to create a seamless playback experience for the end-user the buffer stream is loaded a few seconds ahead of your current position.
From the user’s perspective, the key trait of a network is Quality of Service (QoS) of the content they are streaming. Whilst using HTTP, video transmission is reliable, HTTP reassures the user that there is no packet loss or video disturbance.
Experiments
Buffering over various internet speeds
With the use of Wireshark, various experiments were done to see how packets are send from YouTube to client whilst watching a video under different network conditions and playback quality. To extract only YouTube video packet data, the filter “tcp.port eq 443” was used, all graphs were set to a tick interval of 1 second with a pixel per tick of 10 and the units used in the graph are packets/Tick with a scale of 10000, all data is coming from Wi-Fi only.
Buffering Time over Wi-Fi connectivity (No Throttling) using a forced 720p video
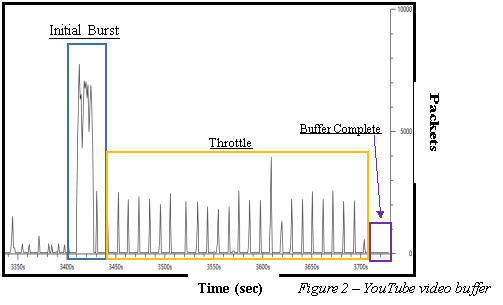
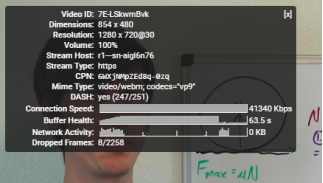
Figure 2, displayed above shows a YouTube clip, which spans a total of 8:36 minutes. The graph depicts a burst of data that’s sent initially on load. After the few second burst, the data rate reduces considerably. YouTube server initially sends the video as soon as possible for the initial buffering before significantly reducing the sending rate. Once the video has buffered fully, the rate of packet sending drops to near zero.
 Buffering Time over 3G connectivity (1.5mb/s, 750kb/s) using a forced 720p video
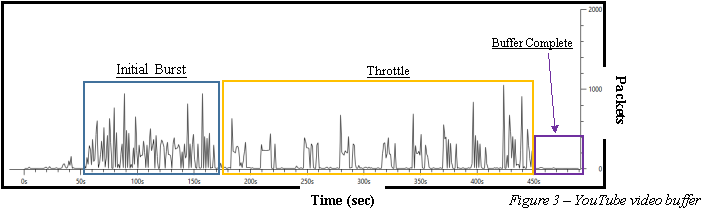
Figure 3 depicts how a YouTube video is loaded whilst on a 3G connection; the clip used is the same as Figure 2, for comparative reasons. The burst seen in the graph spans for a greater period than on a faster connection. The video instantly plays but YouTubes server loads data for longer before finally reducing the frequency of data being sent. The player buffer’s for a quarter length from the current position of the playing position before finally stopping for a brief moment to allow catch-up, which can be depicted on the graph where the throttle rate drops to <1.
This is mainly due to QoE, which is based on human perception, where the user doesn’t care for statistics such as packet loss etc. but rather in the quality of their video, they want to be able to view the video as soon as possible and at the best quality that is available.

Buffering Time over GPRS connectivity (50kb/s, 20kb/s) and the effects of having a reduced bandwidth
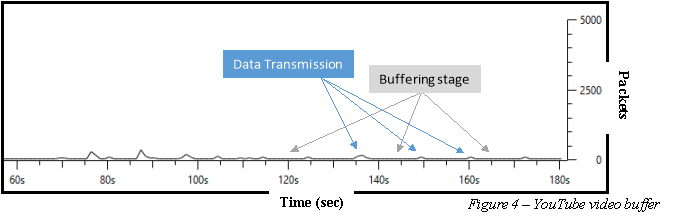
Figure 4 depicts the packets that are received whilst on a GPRS connection, reduction in the transmission rate in-turn has resulted in bandwidth significantly reduced, the impact almost certainly forces re-buffering to occur, which reduces the QoE for the user. This results in a longer queuing delay at network nodes and increases server-to-user delays, as the graph shows, the amount of data stored by the inbuilt player’s buffer is diminutive, as the initial burst did not store enough on load, the video is constantly buffering and playing leading to an endless need to re-buffer to continue. This can be seen at seconds; 120, 145 & 165, with seconds; 135, 150, 160 being the periods in which data is being transmitted, which consequently don’t last long as periods of re-buffering flow directly afterwards.
Video delivery over various video quality
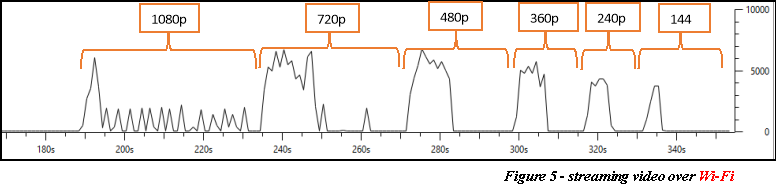


Figure 5 shows how a single video is re-loaded and buffered from the user’s current position. Each time a quality change is introduced, the video stops for a brief moment and the buffer pool is restocked with the new video quality data. The higher the quality of video, the more data is introduced initially to ensure that the video starts immediately, as the graph depicts, the lower the quality, the less of an initial burst is needed, as the size of the video is equitably reduced too, YouTube therefore can send all the data for the video quickly. As the video quality is higher, the size of the video being transmitted will also be higher.
|
Network Speed |
Download |
Upload |
|
Regular 3G |
750 kb/s |
250kb/s |
|
Good 3G |
1.5 Mb/s |
750 Kb/s |
|
Regular 4G |
4 Mb/s |
3.0 Mb/s |
Compare this to a mobile phone when outside using data connection for example, 3G & 4G connection, as there are many more collisions and obstructions whilst outside compared to a consistent Wi-Fi signal, the results are very different. With the location of the user a key aspect of reliable data transmission and how close the user is to the radio tower.
|
Quality |
Duration |
|
1080p |
0 – 100s |
|
720p |
101s – 200s |
|
480p |
210s – 300s |
|
360p |
301s – 400s |
|
240p |
401s – 500s |
|
144p |
501s – 600s |
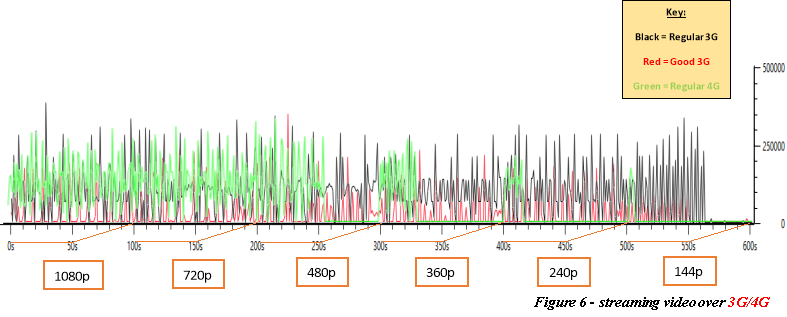
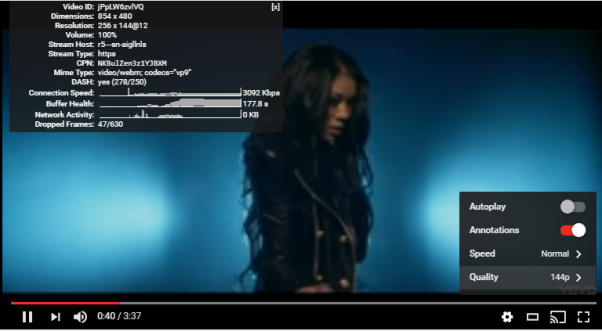
By using network-measuring tools, figure 6 depicts the measurements taken for a single video to load over various qualities via regular 3G, good 3G and regular 4G connection. The results vary compared to Wi-Fi where the transmission is reliable, there are fluctuations in the transmission and the amount of data being sent, whereas Wi-Fi could send a considerable amount in the initial burst of the loading, 3G and 4G do not. Starting with regular 3g, 1080p, 720 and 480p quality video’s spend a considerable amount buffering. There was not an initial burst of data that YouTubes servers transmitted, as network speeds were low, the first few seconds where spent buffering and then the video played, the video soon after paused, as buffering had to recommence to gather more data. The results show that in the initial stages of buffering with 4G connection, the amount of packets being sent are high, this is to ensure the user is able to view the video as soon as possible without interference, as the bandwidth is high, a large amount of packets can be sent, this ensures no pausing. YouTube servers’ application layer is not greedy where it feeds the TCP stack at a rate given by the private throttling algorithm. The TCP layer manages the buffering, when the transmission rate at TCP layer is reduced, the data that cannot be transmitted begins to be stored in the buffer, which can be seen in the 144p portion from 510 seconds onwards. However, when the buffer is occupied, the TCP layer is blocked from sending more data. This can also be shown via YouTube’s stats for nerds feature [Figure 7], where when the video is done buffering to the max size of the video file, the network activity drops to a dead 0. With the more limited bandwidth of 3G connectivity, the video has to buffer for longer as with the capped transmission rate, not as much video data can be sent with more frequent throttling.

Conclusion
Overall, it is clear that the higher the quality, the more bandwidth is needed in-order to view the content with no interference. Limiting bandwidth had effects on the overall quality where YouTube would automatically decrease or increase the quality accordingly. Looking at the graphs produced, choosing to view content at a high quality on speeds of, for example, 3G will result in a in-viewable experience where the end-user will have to wait considerable amounts of time to even view small portions of content.
The results of viewing video show that YouTubes progressive download algorithm starts by transferring an initial burst of data at the end user’s maximum available bandwidth and then uses a sophisticated throttling algorithm to implement a data rate that is more suited. This is key in making sure the user gets to view the video as soon as possible without tirelessly needed to pause and wait for the buffer pool to fill again.
QoE is an important factor that YouTube have taken into consideration to ensure that even if the user has a limited bandwidth, by using DASH, they are always able to view the video even if it is at the lowest quality available.
For smooth transmission of high quality video, bandwidth should be atleast >=3mbps. Where enjoyable watching on medium quality should start at least 1Mbps.
References
- Yabe, M., Yokota, S. and Nakajima, T. (2006). A Quality Evaluation of High-Speed Video Streaming on Congested IP Networks. IEEEXplore, [online] p.1. Available at: http://ieeexplore.ieee.org/document/1593437/ [Accessed 13 Mar. 2017].
- Tech-faq.com. (2017). How Television Broadcasting Works. [online] Available at: http://www.tech-faq.com/how-television-broadcasting-works.html [Accessed 13 Mar. 2017].
- Thetoptens.com. (2017). Top 10 Best Alternatives To YouTube – TheTopTens®. [online] Available at: https://www.thetoptens.com/best-alternatives-youtube/ [Accessed 13 Mar. 2017].
- MakeUseOf. (2017). 21 Amazingly Interesting YouTube Facts in 2016. [online] Available at: http://www.makeuseof.com/tag/21-amazingly-interesting-youtube-facts-2016/ [Accessed 14 Mar. 2017].
- Youtube.com. (2017). Statistics – YouTube. [online] Available at: https://www.youtube.com/yt/press/en-GB/statistics.html [Accessed 19 Mar. 2017].
- Provider, S. and Papers, W. (2017). The Zettabyte Era – Trends and Analysis – Cisco. [online] Cisco. Available at: http://www.cisco.com/c/en/us/solutions/collateral/service-provider/visual-networking-index-vni/vni-hyperconnectivity-wp.html [Accessed 19 Mar. 2017].
- Provider, S. and Papers, W. (2017). White paper: Cisco VNI Forecast and Methodology, 2015-2020. [online] Cisco. Available at: http://www.cisco.com/c/en/us/solutions/collateral/service-provider/visual-networking-index-vni/complete-white-paper-c11-481360.html [Accessed 20 Mar. 2017].
- Rosoff, M. (2017). Netflix and YouTube are America’s biggest bandwidth hogs. [online] Business Insider. Available at: http://uk.businessinsider.com/which-services-use-the-most-bandwidth-2015-12?r=US&IR=T [Accessed 20 Mar. 2017].
- Edwards, L. (2017). YouTube Red is now live: What is it and is it worth paying for? – Pocket-lint. [online] Pocket-lint.com. Available at: http://www.pocket-lint.com/news/135686-youtube-red-is-now-live-what-is-it-and-is-it-worth-paying-for [Accessed 20 Mar. 2017].
- DaCast. (2017). Youtube Competitors: Top 5 Alternatives for Video Hosting – DaCast. [online] Available at: https://www.dacast.com/blog/youtube-competitors-top-5-alternatives-video-hosting/ [Accessed 20 Mar. 2017].
- The Internet Society (1998), (1998). Real Time Streaming Protocol (RTSP). [online] Network Working Group, p.1. Available at: https://www.ietf.org/rfc/rfc2326.txt [Accessed 21 Mar. 2017].
- Chotaliya, C. (2016). Which streaming protocol does Youtube use?. [online] quora. Available at: https://www.quora.com/Which-streaming-protocol-does-Youtube-use [Accessed 21 Mar. 2017].
- Support.google.com. (2017). Recommended upload encoding settings – YouTube Help. [online] Available at: https://support.google.com/youtube/answer/1722171?hl=en-GB [Accessed 21 Mar. 2017].
- Blueberry Consultants Custom Software. (2016). Why Nobody Uses Flash Anymore. [online] Available at: https://www.bbconsult.co.uk/blog/why-nobody-uses-flash-anymore [Accessed 21 Mar. 2017].
- The Verge. (2015). YouTube drops Flash for HTML5 video as default. [online] Available at: http://www.theverge.com/2015/1/27/7926001/youtube-drops-flash-for-html5-video-default [Accessed 21 Mar. 2017].
- Figure 1 – Video Used: https://www.youtube.com/watch?v=Nq2Kum-eG8g
- Szigeti, T. and Hattingh, C. (2017). QoS Requirements of Video > Quality of Service Design Overview. [online] Ciscopress.com. Available at: http://www.ciscopress.com/articles/article.asp?p=357102&seqNum=2 [Accessed 30 Mar. 2017].
Cite This Work
To export a reference to this article please select a referencing stye below:
Related Services
View all


DMCA / Removal Request
If you are the original writer of this essay and no longer wish to have your work published on UKEssays.com then please click the following link to email our support team:
Request essay removal