Mosquito Species Detection using Smart Phone
| ✅ Paper Type: Free Essay | ✅ Subject: Computer Science |
| ✅ Wordcount: 3524 words | ✅ Published: 18 Aug 2017 |
Abstract-According to WHO(World Health Organization) re-ports, among all disease transmitting insects mosquito is the most hazardous insect. In 2015 alone, 214 million cases of malaria were registered worldwide. Zika virus is another deadly disease transmitted from mosquitoes. According to CDC report, in 2016 62,500 suspected case of Zika were reported to the Puerto Rico Department of Health (PRDH) out of which 29,345 cases were found positive. There are 3500 different species of mosquitoes present in the world out of which 175 types is found in United States. But only few of them are responsible for these above mentioned fatal disease. Therefore classification between hazardous and regular mosquitoes are very important. For regular person with no expertise in this field would be almost impossible to identify the difference. Even for the mosquito-expert, identifying different species is a very tedious and time consuming job. Hence in this paper, we have tried to classify 7 different species of dead mosquitoes with total 60 samples collected from Hillsborough County Mosquito and Aquatic Weed Control Unit,Tampa Florida by capturing image from smart phone cameras. With our approach we want to enable non-expert population to early identify the risk and act pro-actively. We pre-processed the image for removing noise and applied random forest classification algorithm to distinguish different species. Achieved good precision,recall,F1 measure and aggregate 83:3% accuracy. We are also planning to develop a smart-phone application which will leverage this learning model and help in empowering population to identify mosquito species without any knowledge in this field.
INTRODUCTION
Of all animals, mosquitoes are amongst the most deadly in spreading diseases. Mosquito borne diseases like Malaria, Dengue, West Nile Fever, and most recently Zika Fever have extracted devastatic tolls on humanity [1]. Combating the spread of mosquitoes is an important health-care agenda across the globe, and several organizations across the globe serve this purpose. For instance, one such organization is the American Mosquito Control Association (AMCA) is spread over 50 countries and conducts numerous programs to educate citizens of the dangers posed by mosquitoes and how to control them. According to CDC report, there are about 3500 different species of mosquitoes in the world, out of which about 175 different species are found in the USA.
Among programs designed to combat mosquitoes spread, identification of the type and number of species in any par-ticular area is very important. Across the world, numerous mosquito control organizations have dedicated personnel that lay traps to catch mosquitoes in specific areas, and dedicated personnel visually look at each captured sample (via a mag-nifying glass) to identify the type of mosquito. It takes upto a minute to identify each sample, and with more samples, the time taken to identify each sample can take hours, and naturally significant manual effort.
Contributions of this Paper: In this paper, we aim to de-sign a system that combines images from smart-phone cameras with machine learning algorithms for automatic detection of the type of mosquito species from their images. Towards this extent, our specific contributions are:
a). Building a database of mosquito images: We visited the Hillsborough County Mosquito and Aquatic Weed Control in Tampa in Fall 2016 to collect numerous samples of mosquitoes that were captured in traps set up the county personnel. Subsequently, the personnel helped us visually identify the type of each sample. As a result, we collected 60 samples, that belonged to seven different species.Table I presents our database. Subsequently, each sample was imaged via a Sam-sung Galaxy S5 phone via multiple angles (at the same indoor light conditions) for a total of 200 images. This served as our database for subsequent classification.
b). Designing Pre-processing Techniques: Generally, images are vulnerable to the different type of noises due to different environment condition and user expertise. Therefore, images need to be pre-processed for any noise removal and also for smoothening. In the process of noise removal, we need to make sure that edges and boundary of images are preserved otherwise images will lose the key information. We used median filter as it works very effectively when edges need to be preserved. This filter is widely used in image processing technique [2].
c). Designing Random Forest Based Classifiers: Random Forest is an ensembled supervised machine learning algorithm. It is a collection of decision trees, where each trees has been grown using subset of training dataset selected randomly. In most of the cases, it has shown significant improvement in accuracy as compare to other classification algorithm. Apart from that, it works very well on outliers and noise. It handles larger dataset efficiently and quickly without over-fitting the model as only a subset of training set is selected for each split.[3] [4]
We conducted an extensive performance evaluation for our proposed techniques.We evaluated our experiment on 60 image samples of seven different species. 10-fold cross validation technique has been used and achieved 83:3% accuracy using RGB features.
The rest of the paper is organized as follows. In section II, related works are discussed. Followed by section III where experimental set up and data collection process are described. Section IV contains the detail about preprocessing of image data, extracting and selecting features, building the learning model using classification method and different metrics lever-aged for showing the results. We talked about experimental evaluation and validation in detail in section V. Finally, dis-cussion and conclusion sections are VI and VII respectively.
RELATED WORK
There are many studies which are dedicated to leverage the use of smart phone camera for image recognition. In this section we have emphasized few of the related and important works done.
A. Related Work on Image Recognition
In [5] system was developed for determining the effec-tiveness of soil treatment on plant stress using smart-phone cameras.In this paper, 34 images of plant leaves are captured using smart phone in two soils that is biosolids and unamended tailings. Then each images was preprocessed using mean, me-dian filter followed by segmentation into pixels.They extracted RGB,R,G,B,HSV and YCbCr features from the segmented pixels. Random Forest which is a supervised classification algorithm was designed to detect the stress of leaves and achieved 91.24% accuracy.
A [6] survey has been done on Pixel-Based skin color detection techniques. They have applied various color spaces like RGB, Normalized RGB, HSV and YCrCb for recognizing skin. RGB is the most widely used color spaces for processing and storing digital images.
Wen et.al [7] has proposed image-based automated insect iden-tification and classification method. In this paper eight insect species have been selected for experiment. These insects were frozen to retreive a non damaging kill of the insect and then they were placed on a white balance panel under the reflectance light base of a Nikon stereoscopic zoom microscope SMZ1000 (Nikon, Tokyo) with Plan Apochromat 0.5 objective. Images of these were taken by a DS-Fi1 color digital camera which was placed on the microscope. Features which had been taken in these are color, texture, invariants, contour and geometric. In color features, HSV color space features were considered. T Many classification algorithm i.e. minimum least square linear classifier (MLSLC), normal densities based linear classifier (NDLC), K nearest neighbor classifier (KNNC), nearest mean classifier (NMC), and decision tree (DT) were used for testing and training the model. Among these NDLC classification algorithm outperforms other classifier.
1) Comparing our Work w.r.t. Related Work: Our work is focused on capturing mosquitoes images from smart phone camera and using the captured image for training and testing the learning model. In [7], authors have identified insect species but it needs lab set up with microscope and high resolution digital camera which is not available in house generally. We have extracted RGB features for classification which is most widely used color spaces [6].
EXPERIMENTAL SETUP AND DATA
COLLECTION
In this section, we have discussed data collection process our experiment.
A. Data Collection
We collected dead mosquito species samples from Hillsbor-ough County Mosquito and Aquatic Weed Control Unit,Tampa
Table I: Mosquito Species and Number of Samples
|
Specie Name |
Number of Samples |
|
Cx Nigrip |
10 |
|
An Quadrim |
6 |
|
Ma Titillans |
7 |
|
Ps Columpi |
10 |
|
An Crucians |
10 |
|
Ps Ferox |
7 |
|
Cq Perturbans |
10 |
Table II: Camera Specification
|
Camera Specification |
Value |
|
Sensor Resolution |
16 MP |
|
Focus Adjustment |
automatic |
|
Special Effect |
HDR |
|
Camera Light Source |
Daylight |
Florida. We carefully identified seven species, mentioned in Table I for our study.
Since, dead mosquito physical properties like color, del-icateness etc changes as time passes. So, images of dead mosquitoes were taken in a single day to make sure envi-ronmental conditional are same while taking these images. A Samsung Galaxy S5 smartphone was used for capturing images in regular day light. Each sample image was taken based on the knowledge aware fusion described on the mosquito and aquatic control weed control unit web site. A total of 60 images were captured for our study, having following camera configuration, mentioned in Table II.
OUR APPROACH
We have implemented two steps in our approach. First, pre processing of image has been done for noise removal and feature selection using filter like median,mean. Second, building a learning model using a classification algorithm based on random forest.
Here our main aim is to build a learning model for identi-fying each mosquitoes species.
The challenge here we faced is the image size. Images which were captured from smart phone is of 2988 X 5322 pixels. We reduced their size to 256 X 256 pixels to decrease its data dimensionality. To remove the noise from each sample we applied median filter technique.This has been elaborated in the next subsection.
Since, our images were already in dark color.It is mandatory to keep background and foreground in contrast for building the model reasonably well. So, we did not use any segmentation technique as it converts the background into black.
Here,we are using Random Forest, a supervised learning algorithm and used 10-fold cross validation technique for learning and testing. The process flow of our algorithm is described in Figure 2. For proceeding further, we need labeled image data for training the model. All images were tagged manually under the guidance of mosquito experts.
Noise Removal
Generally, digital images are susceptible to different type of noise. It can occur by several ways like capture, transmission etc. Accuracy of the result are affected badly by the same. There are many filters used to remove and reduce noise from image.
- Sharpening Filter: It refers as a enhancing technique which highlights edges and line details in the image. In this procedure, original image is passed through high pass filter which extracts its high frequency components and then the scaled output of high pass filter is added to original image which results in sharpened image. [8]
- Mean Filter: This filtering technique refers to replacing each pixel value in an image with the mean of pixel values of its neighbors which falls in the sliding window of n*n size. This technique removes noise more effectively if large window size is considered.This is also called average filter. [8]
- Median Filter: It is a nonlinear filtering technique. The approach behind this filtering technique is to replace each pixel value in the window of n * n size pixel by the median of all pixel values in that particular window.It is very used in digital image processing and it preserves edges while removing noise. We have used this filtering technique with 3*3 pixels window size for removing the noise from our digital images. The output with median filter and without this is shown in Figure 1. [2]
Feature Selection
Feature extraction and selection is very critical part of any supervised learning algorithm. Extraction is about reducing the data dimensionality as the size of data grows and its dimension increases and becomes very difficult to handle it manually . And then the need of automation comes into the picture.
Feature Selection is a process of selecting those features which are most relevant for our problem and eliminating unnecessary, irrelevant and redundant features of data that do not contribute to the accuracy of learning model.
In our proposed model, we are identifying different species of mosquitoes. Each species have contrastive color. As we can see in Figure 3, each mosquitoes have similar shapes but differ-ent body and wings color.So,the correct color channels or the combination of channel is important to take into consideration for the features.
Few of the color channels are RGB, HSV etc. RGB has Red, Green and Blue channels. In RGB, each component supports a range of intensity levels from 0 to 255 (integer valued)[9] .
Here, we extracted RGB feature from the mosquito image data. Then for feature selection, we applied Information-Gain attribute selection algorithm which is a good measure for deciding the relevance of an attribute. This feature selection technique generally helps in achieving high accuracy and using this we got 1000 features which serve as an input vector x into Random Forest Classification Algorithm for species detection. We calculated its precision, recall and F1-measure which is mentioned in Table III
Table III: Combination of color channels accuracy comparison
|
Combination |
Precision |
Recall |
F1-measure |
|
RGB |
0.845 |
0.833 |
0.834 |
C. Classification Method
Random Forest Algorithm: Random Forests(RF) is an ensemble supervised machine learning algorithm. It consists of a set of decision trees; h(x,i) i = 1, 2,, where x is a feature vector extracted from the smartphone image data and i consists of K integers which are independent identically distributed random vectors. Each decision tree predicts a class independently. A voting is performed on the results from each decision tree and finally the class which gets majority vote will be the final predicted class. The same has been explained in Figure 4 . Given a dataset set that contains N feature vectors, each consisting of M features, the RF algorithm builds the trained model using following steps:
- N samples are selected at random with replacement from the data set, for training the model of a particular tree.
- K features are randomly selected from the set of available features, where K M.
- Among the values for each of the K features drawn, choose the best split according to the Information gain
IG(T; a) of the attribute. Information gain is measure of decrease in entropy which is caused by splitting the samples on an attribute. T denote a set of training sample
for a single tree. ((x),y) = (x1, x2,.., xk,y) where (x) consist is a single sample and y is its class label. The
information gain for an attribute a is as follow:
The information gain for an attribute a is as follows:
|
IG (T; a) = H (T ) v val(a) |
j(x T jTa |
= v) |
j |
:H (x T jxa = v) |
||
|
X |
x |
|||||
|
j j |
(1) |
|||||
Here, xa vals(a) is the value of the ath attribute of example x. The randomization is present in two ways:
- Random selection of data for bootstrap samples as it is done in bagging
- Random selection of input features for creating individual base decision trees.
- Each tree will grow to its maximum size until the stopping criterion has not been fulfilled and there will be no tree pruning. Once the forest has been ensembled, testing data sample will be labeled mosquito species class based on a majority vote among all classes from all decision trees in the forest.
|
Once the |
forest has |
been |
ensembled, |
testing |
|
|
data sample |
is labeled with |
one of |
the |
classes |
|
|
(species1; species2::::species7) |
by |
taking |
the |
majority |
|
vote: i.e., it is labeled with the class which has been selected by maximum number of trees. In the RF approach, given a feature sample x to be classified, the conditional probabilities for each class are computed by taking the average of the conditional probabilities given by the trees constructing
4
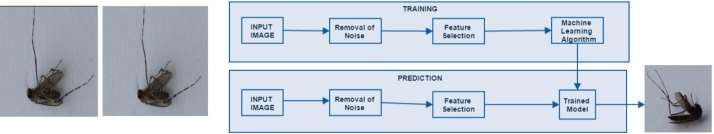
Figure 1: a) Original Image b) Image
after applying sharpening median filterFigure 2: Process description of our experiment
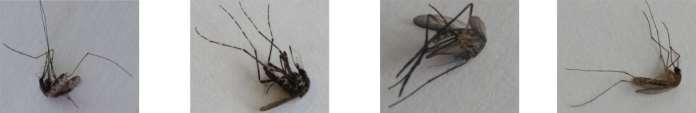
a). Cruciansb). Columpic). Feroxd). Nigrip
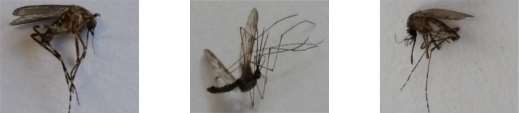
e). Peturbansf). Quadrimg). Titillans
Figure 3: Mosquito Color Images
the ensemble. These conditional probabilities are computed as follows. Given a decision tree T, and an input feature sample x to be classified, let us denote by v(x) the leaf node where x falls when it is classified by T. The probability P (mjx; T ) that the sample x belongs to the class m, where m 2 fspecies1; species2; :::; species7g (for 7 species of interest to this paper), is estimated by the following equation:
|
P (mjx; T ) = |
nm |
(2) |
|
n |

where nm is the number of training samples falling into v(x) after learning and n is the total number of training samples assigned to v(x) by the training procedure. Given a forest consisting of L trees and an unknown feature sample x to be classified, the probability estimate P (mjx) that x belongs to the species m is computed as follows:
|
1 |
L |
(3) |
|||||||
|
P (mjx) = |
P (mjx; Ti) |
||||||||
|
L |
|||||||||
|
=1 |
|||||||||
|
Xi |
|||||||||
|
P (m |
x; T ) |
||||||||
|
by |
where th |
j |
i |
is |
the conditional probability |
provided |
|||
|
the i |
tree |
and |
is |
computed according to Eq.(1). As |
|||||
|
a |
consequence, |
for |
the |
sample x to be classified, |
the RF |
||||
algorithm gives as output the vector:
- = fP (species1jx) ; P (species2jx) : : : : : : P (species7jx)g
The class(species) with the highest probability in the set(4)is
chosen as classified class for the ith tree. The final class of our RF algorithm is the one which gets the majority vote among all activities from all decision trees in the forest [11]. The work flow of the RF algorithm with pre-processing, training and testing phase is formally shown in Algorithm 1.[3] [12]
D. Metrics
The results of Mosquito-Species detection are shown in terms of precision, recall, F1-measure and Confusion Matrix. Each metric is a function of the of the true positives (T P ), false positives (F P ) and false negatives (F N). The precision is the ratio of correctly classified classes to the total number of classes predicted as positive:
|
P recision = |
T P |
(5) |
|
T P + F P |
 Recall is the ratio of total number of classes predicted as positive to the total number of positive classes:
|
Recall = |
T P |
(6) |
|
T P + F N |

5
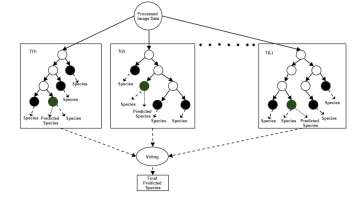
Figure 4: Work flow of the Random Forest Algorithm
The F1-measure is the weighted average of precision and recall:
P recisionRecall
F1 = 2 P recision + Recall (7) The Confusion Matrix (CM) is a table that allows the visu-alization used to describe the performance of a classification model. Each column of the matrix represents the instances in a predicted class while each row represents the instance in an
 actual class (or vice-versa) [13].
Precision indicates the number of samples classified as a particular species actually belonged to that species. Recall gives us the number of species which are correctly classified. The F1-measure denotes the classification model’s accuracy.It is calculated as the harmonic mean of precision and recall. Confusion matrix makes the system easy to see how much predicted model is getting confused between different species. For example if a species is predicted correctly only 80% of the time, then this matrix will show how the algorithm confused its prediction with the other (wrongly classified) species the remaining 20% of the time.
- RESULTS
Overview of Evaluation Methods: In this paper, we evaluated the performance of our system using 10-fold cross validation that are standard for our problem scope.
Cross-validation is a model validation technique for assess-ing how the results of a classification model will generalize to an independent dataset
10-fold cross-validation divides the dataset into 10 subsets, and evaluates them 10 times. Each time, one of the 10 subsets is used as the test set and the other 9 subsets are put together to form a training set. Then, the average error across all 10 trials is computed for final result. It limits problems like over-fitting in the classification model.
Results and Interpretations: We used RGB feature men-tioned earlier to train our classification model. To evaluate its accuracy we used 10-fold cross validation technique and calculated precision, recall and F1 measure of each species independently. The evaluation measures of RGB feature are shown in IV have also shown it graphically in Figure 5. Confusion Matrix of the same is shown in Figure 6.
Algorithm 1: RF-based Algorithm for Mosquito-Species detection

Training Image dataset = Id; Testing Image dataset= Ited;
RGB Features extracted from Training Image dataset =
F tRGB;
RGB Features extracted from Testing Image dataset =
F teRGB;
Classified Species from Images= M S;
Probability that feature F belongs to Species M S =
P (M SjF );
No. of trees in Random Forest = 121;
Step 1 Pre-Processing:
- Median filters are applied to remove accidental spikes from Id and Ited.
- Features F tRGB and F teRGB are extracted from processed data Id and Ited obtained from (1).
Step 2 Training:
Input: Training data set F tRGB
Output: Random Forest model to classify different species of mosquitoes.
- Select a bootstrap sample of size N from the training data.
- Grow a decision tree T using following steps.
- Select K features at random from the set of M features.
- Choose the best feature/split-point among the K.
- Split the node into two daughter nodes.
- Grow the tree to its maximum size that is 6 and let the tree unpruned
Step 3 Prediction:
Input: Testing data set Ited
Output: Final Mosquito Species prediction M Ss.
- Select the same attributes used for training the model from testing feature set F teRGB.
- Predict the species from the model using features selected in the above step.
6
Table IV: RGB Features accuracy of each species indepen-dently
|
Species |
Precision |
Recall |
F1-measure |
|
An Crucians |
0.889 |
0.8 |
0.842 |
|
An Quadrim |
0.571 |
0.667 |
0.615 |
|
Cd Peturbans |
0.727 |
0.8 |
0.762 |
|
Cx Nigrip |
0.889 |
0.8 |
0.842 |
|
Ma Titillans |
Cite This Work
To export a reference to this article please select a referencing stye below:
Related Services
View all


DMCA / Removal Request
If you are the original writer of this essay and no longer wish to have your work published on UKEssays.com then please click the following link to email our support team:
Request essay removal