Monitoring and Analysing Anomaly Activities in a Network Using Packetbeat
| ✅ Paper Type: Free Essay | ✅ Subject: Computer Science |
| ✅ Wordcount: 2815 words | ✅ Published: 23 Sep 2019 |
Monitoring and Analysing anomaly activities in a network using Packetbeat
Abstract:
The primary intention of any organization is to provide security for their information because they are sensitive to different types of threats that might cause damage to providing services to their customers which will lead to disaster. This paper will draw more attention to protecting the client’s systems from various network attacks by monitoring and analyzing the network traffic. Packet analysis can help us to identify the malicious network traffic, which is going to harm the entire systems connected to that network so that we can have some knowledge from the information extracted by analyzing network packets that will help us to get aware of the vulnerabilities and to resolve them before we become victims. Once we install the Packetbeat in our client’s system it will collect and send all the network data in that organization, which can be used to analyze them in order to find out the abnormal network traffic. Using ELK at server side, we can store, monitor and analyze the network data for identifying malicious network packets that are going to infect our client’s systems. This process can be helpful in small-scale SIEM services.
Keywords: Threats, Vulnerabilities, Malicious network traffic, Packet analysis, Packetbeat, ELK Stack.
- Introduction:
Today almost all the companies and organizations are depended on the Internet for accessing all the services as part of their business. As the number of companies with computers accessing internet increases, correspondingly the increase in external threats can be noticed. Mostly the network-based attacks that are occurring by accessing the global internet show a major impact on the business computers over the past several years. Due to the increasing of network-based attacks, it is very critical for companies to store and secure their sensitive data. When a security breach occurs, the companies may lose business and finally become bankrupt because of one successful attack.
In order to prevent the client’s systems from various network attacks by detecting the malicious network traffic passing through the network, Packetbeat is used as a source in packet analysis which can be integrated into elk. Using the packetbeat we can collect all the network packet logs from the client’s system, then perform packet analysis and detect the malicious network packets that are going to harm the systems in an organization. The data collected from the packet beat indicates all the events collected from users in that network. This will be helpful to find out the intrusions happening between the internal network and external network.
- Need for Packet analysis:
- Existing Solution:
Splunk: Splunk is one of the highly preferred tools in this field of monitoring and analyzing the data. It can able to collect, store, search, monitor and analyze the client’s network logs in a dashboard. This is available in both open source and commercial plans, where the open source is a trial version and limited to 500 MB per day which is insufficient to implement in IT industries [1]. In the commercial edition, we should pay based on the amount of data we want to use. Even though it has many features but as any commercial products customization and scaling up could be considered as one of the biggest barriers.
According to the IDC report [2], we can observe that Splunk occupies the top market share and ranked number one in the worldwide Information Technology Operation Analytics (ITOA) for 2015. Splunk provides a very powerful user interface and the users can also apply their own user interface configuration. Rather than the financial issue in customizing the product, Splunk is more flexible and it can fulfil the need that would be a big demand for any organization.
- Proposed solution:
Beats:
Beats are open source data shippers that we can install as agents in our client’s system to collect the logs and send operational data directly to Elasticsearch or to transfer through Logstash to Elasticsearch [11]. Mainly, there are 5 types of beats that are helpful in collecting the logs.
• Packetbeat: Packetbeat is implemented to collect all the network data from the client’s systems. Using this packetbeat we can monitor and analyse the network packets.
• Winlogbeat: winlogbeat is implemented to collect the windows event logs from the client’s systems. It can deploy only in the Windows operating systems.
• Metricbeat: Metricbeat is implemented to collect various system level metrics for various system and platforms.
• Filebeat: filebeat is implemented to collect the log files. It has different modules for collecting, parsing and visualization of log files.
• Auditbeat: Auditbeat is implemented for auditing user and process activity on the Linux servers. It can be used to identify different security breaches and monitors the integrity of the data.
Each Beat is a separately installable product. Before installing Beats, we need to install and configure the ELK. Packetbeat is very much helpful to work and enhance network security.
Packetbeat:
- Packetbeat produces real-time monitoring of the various metrics on the web, database or any other protocol by monitoring the packets that are passing across the wire.
- Monitoring the data packets with ELK Stack can be useful to identify the harmful network traffic and the network packet behavior, and to identify the packet source & destination and helpful in searching for specific data strings in the packets.
- Packetbeat can able to capture the network traffic between the servers and can be used for monitoring the performance of web applications.
- Packetbeat can be installed on the client system and can be monitored on a dedicated server.
- Packetbeat tracks the network traffic and decodes the protocols finally records the data for the transaction.
- Protocol’s supported by packetbeat includes DNS, HTTP, ICMP, etc.
- Packetbeat Architecture:
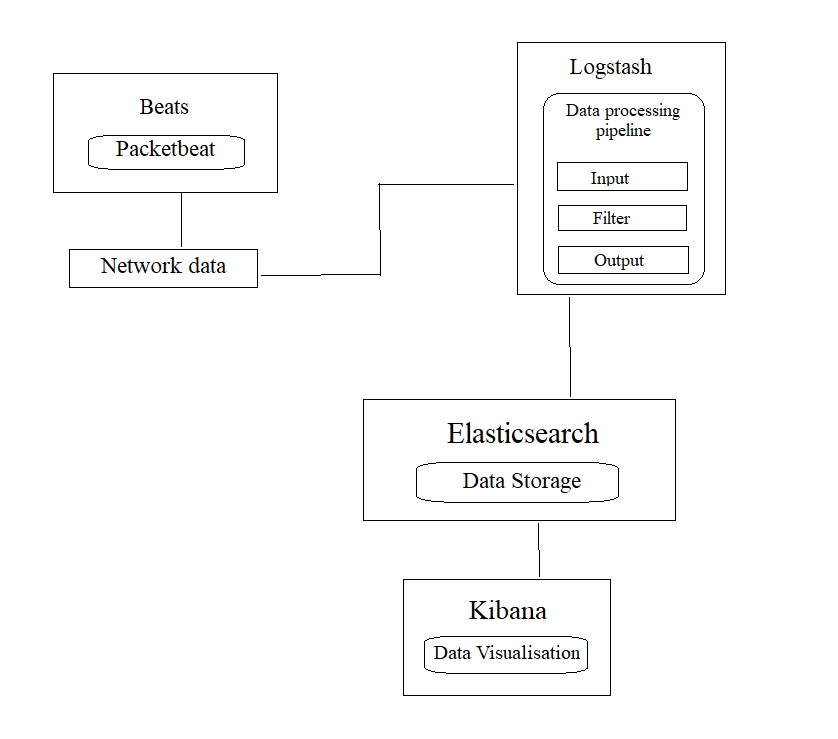
Fig 1. Proposed workflow
The workflow conveys the performance of packetbeat in collecting the network data and helpful for performing packet analysis in ELK. When we deploy packetbeat in the client’s system it will collect all the network data and sends to the Logstash. Logstash is responsible for processing the data. It consists of 3 parts INPUT, FILTER and OUTPUT [1]. The INPUT field describes the source of data i.e. from where it is getting the data. Here source is packetbeat it gets network data from packetbeat. FILTER is responsible for parsing the data and the OUTPUT field describes the output location i.e. to which location it has to forward the data. Here we are forwarding the data to Elasticsearch. Elasticsearch receives the data from Logstash and stores the data. Kibana shows the visual representation of the data present in the Elasticsearch.
- Related work:
The scenario of our implementation is to monitor the network packets and to perform packet analysis using packetbeat in ELK stack. In order to deploy ELK in server-side systems, we need to install the pre-requisites like a web server and java version higher than 7. For my convenience, I installed apache server and Java 8 in my Ubuntu operating system. After that, we have to download the tools Elasticsearch, Logstash and Kibana from the official website of ELK stack [10] as I am using Ubuntu OS, so I have to download the DEB package. After installing Elasticsearch I need to configure it to send data to Kibana. During the configuration of Elasticsearch, we have to specify the destination IP address and default port number of Elasticsearch as 9200 in the Elasticsearch configuration. After configuring the Elasticsearch we can verify whether it is working or not (Fig 2).
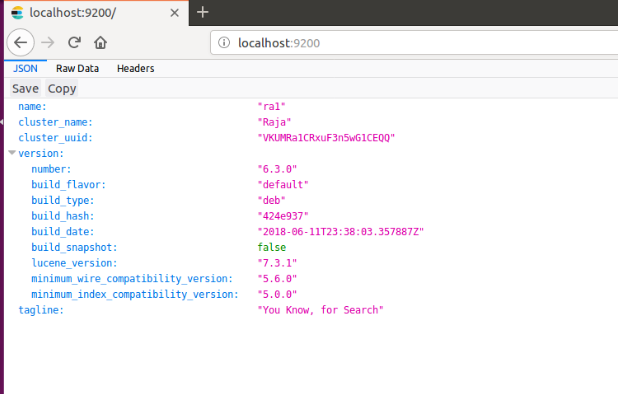
Fig 2. Elasticsearch service status
Kibana should be installed only after the successful installation of the Elasticsearch. After installing the Kibana we can configure it by specifying IP as the loopback IP address that is 0.0.0.0 and default port number of Kibana as 5601 in the Kibana configuration. Similarly, we will install and configure the Logstash. In the configuration file, INPUT section, we set our client IP address (source IP) and default port number 5044 for Logstash. In the OUTPUT section, we have to set the destination IP address of Elasticsearch along with Elasticsearch default port number (Fig 3).
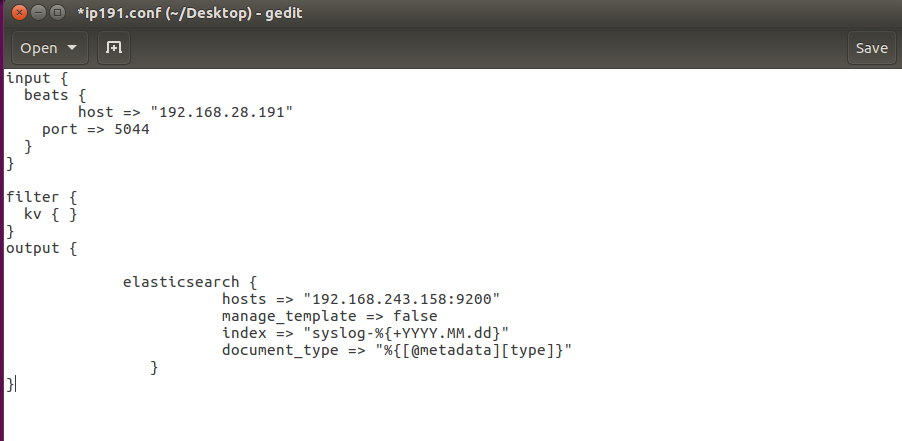
Fig 3. Logstash configuration
Now coming to the client side, we have to deploy packetbeat in our client system it will collect all the data about the network packets passing through the network. In order to install the packetbeat, we have to download the packetbeat file from ELK official website [10] and extract it to program files. Now we should open Windows PowerShell by running it as administrator and install the packetbeat. After the installation of packetbeat, we have to configure it to send data directly to Elasticsearch or to send data through Logstash. Here I am attaching the packetbeat configuration file (Fig 4).
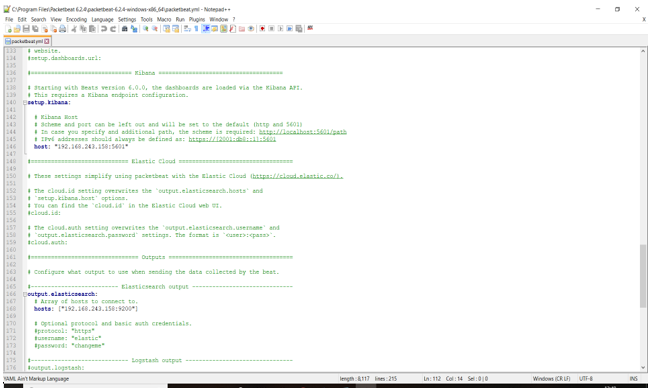
Fig 4. Packetbeat configuration
After configuring the packetbeat in the client system we have to go to Task Manager and then check the status of packetbeat whether it is running or stopped. We have to set it to running state in order to collect the data. After that come to the server side and start the services of Elasticsearch, Logstash and Kibana. In the Kibana, we can visualize the graphical representation of our client’s network traffic (Fig 5). It displays the overview of each and every packet by its source IP in that network along with its timestamp. Based on this we can monitor and analyze the network traffic.
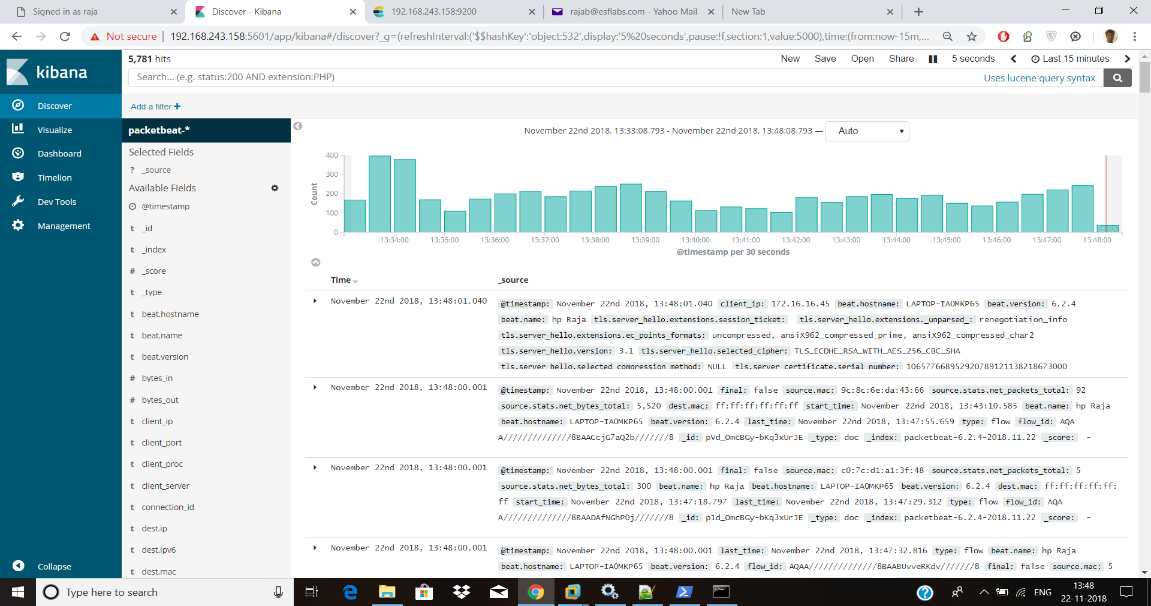
Fig 5. Network data visualization in Kibana.
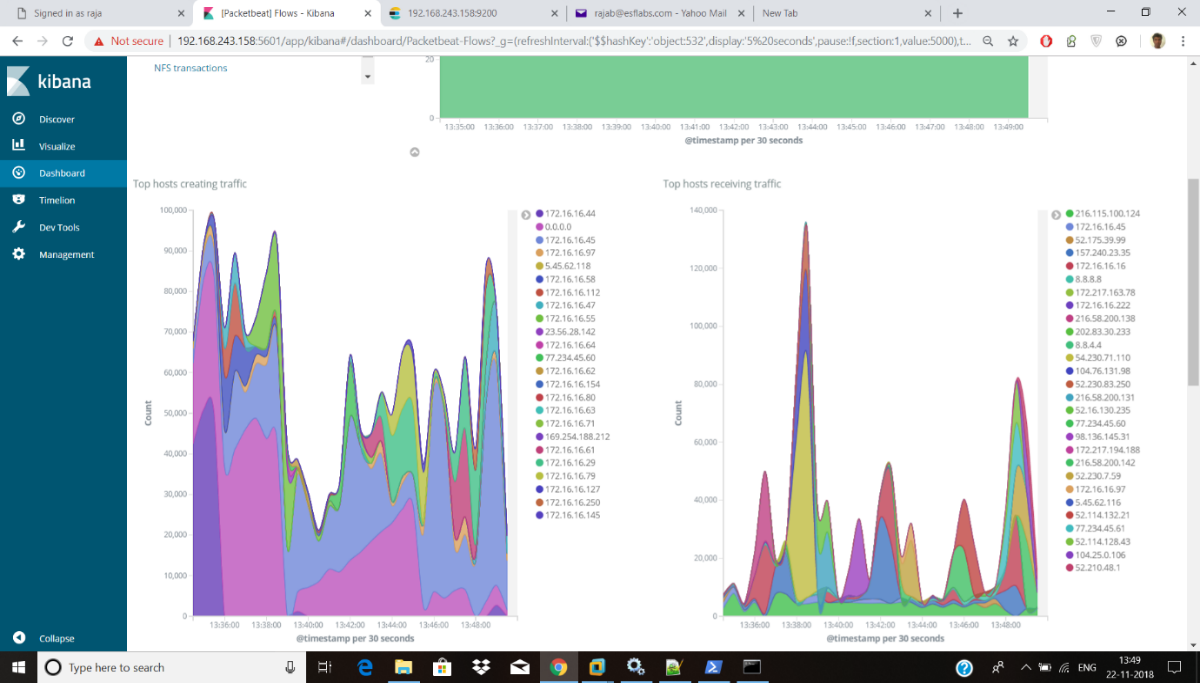
Fig 6. Identifying top communicating hosts
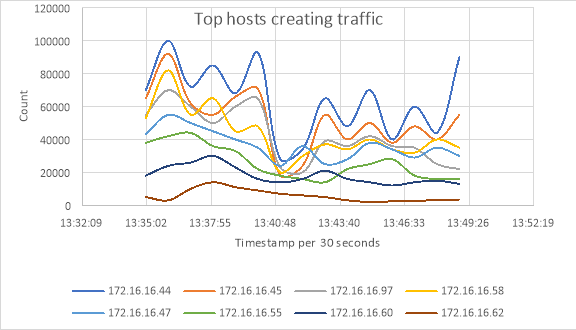
Fig 6a. Top hosts creating traffic
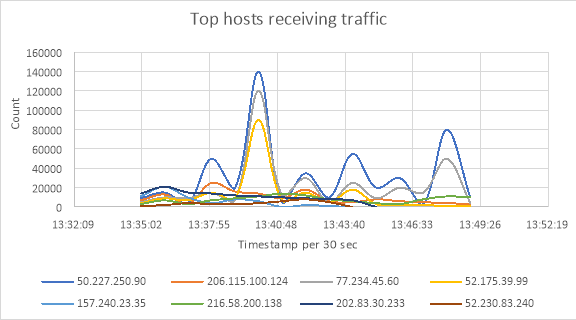
Fig 6b. Top hosts receiving traffic
In the Kibana dashboard, the graph displays the result of all the communicating hosts in that network along with their IP which can be identified by different colors for each host. We can see the top hosts creating traffic along with their IP address in one graph shown in fig 6a and top hosts receiving traffic in another graph shown in fig 6b. Top hosts creating traffic indicates all the communicating hosts in that network and top hosts receiving traffic indicates incoming traffic to that hosts in the network. Based on our analysis in incoming traffic we can identify the malicious traffic in that network by scanning the suspected source IP address in the virus total website [14]. Fig 7 illustrates the virus total report for a suspicious source IP. Based on this report we can detect the malicious activates that are performing on that network.
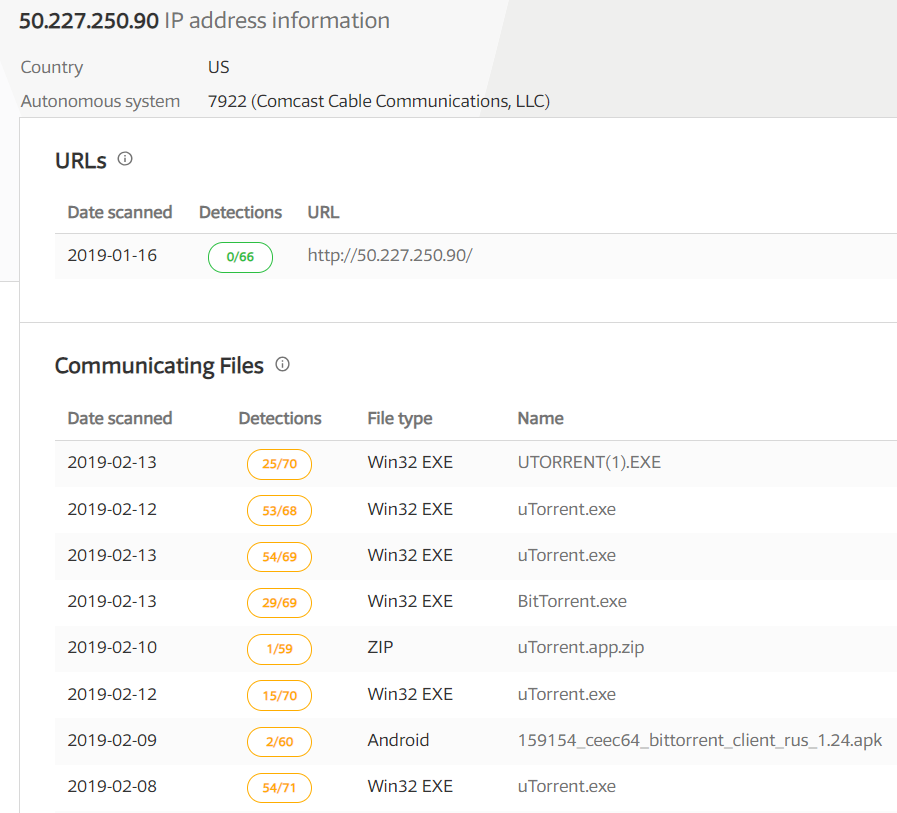
Fig 7. Virus total report for the malicious source in that network.
Conclusion:
Now we successfully collected the client’s network data into our Kibana dashboard. We can visualize and analyze them using elk stack. we can analyze each and every packet and its source and destination in order to find out the malicious attempts on that network by scanning the suspicious source IP in virustotal website. This shows that ELK is more efficient in protecting client’s systems from various network-based attacks. For small-scale industry’s it is better to use ELK stack open source tool rather than the commercial tool. For future work, I am going to do research on Kibana alerting system that will automatically detect the malicious network data and give alerts to the user.
References:
[1] “Network Security Enhancement through Effective Log Analysis Using ELK” by Ibrahim Yahya Mohammed AL-Mahbashi, and Dr M. B. Potdar Bhaskaracharya Institute for Space Applications and Geo-informatics, Gandhinagar, Gujarat, India 382007.
[2] “Performance of ELK Stack and Commercial System in Security Log Analysis” by Sung Jun son, and Youngmi Kowon, Dept. of Radio and Info. Communications Eng,
Chungnam National University, Daejeon, South Korea.
[3] “Real Time Distributed Analysis of MPLS Network Logs for Anomaly Detection” by
Muhammet Macit, Emrullah Delibas, Tevfik Aytekin, Department of Computer Engineering, Bahçesehir University, Besiktas, 34353, ˙Istanbul, Turkey.
[4] “A High Throughput Distributed Log Stream Processing System for Network Security Analysis” by Jingfen Zhao, Peng Zhang, Yong Sun, Institute of Information Engineering, Chinese Academy of Science, National Engineering Laboratory for Information Security Technologies, Beijing, China.
[5] “LogLens: A Real-time Log Analysis System” by Biplob Debnath, Mohiuddin Solaimani, and Muhammad Ali Gulzar, CS Department, The University of Texas at Dallas, USA.
[6] “Analysis of Log Files Intersections for Security Enhancement” by Kazimierz Kowalski, Mohsen Beheshti. Computer Science Department, California State University Dominguez Hills, 1000 Victoria Str., Carson, CA 90747.
[7] “Event Log Analysis with the LogCluster Tool” by Risto Vaarandi, Markus Kont, and
Mauno Pihelgas, TUT Centre for Digital Forensics and Cyber Security, Tallinn University of Technology, Tallinn, Estonia.
[8] “Multidimensional Log Analysis” by Marcin Kubacki, Janusz Sosnowski, Institute of
Computer science, Warsaw University of Technology, Warsaw, Poland.
[9] “Massive Distributed and Parallel Log Analysis for Organizational Security” Xiaokui Shu, John Smiy, Danfeng (Daphne) Yao, and Heshan Lin Department of Computer Science Virginia Tech Blacksburg, Virginia 24060.
[10] https://www.elastic.co/elk-stack
[11] https://logz.io/learn/complete-guide-elk-stack/#beats
[12] https://logz.io/blog/network-log-analysis-packetbeat-elk-stack/
[13] https://www.techopedia.com/definition/25323/packet-analyzer
[14] www.virustotal.com
Cite This Work
To export a reference to this article please select a referencing stye below:
Related Services
View all


DMCA / Removal Request
If you are the original writer of this essay and no longer wish to have your work published on UKEssays.com then please click the following link to email our support team:
Request essay removal