Increasing Visual Comfort with Blue Light in Video
| ✅ Paper Type: Free Essay | ✅ Subject: Computer Science |
| ✅ Wordcount: 3215 words | ✅ Published: 29 Aug 2017 |
Adjusting the blue light of the video to increase the visual comfort belong to the changed of light environment

Abstract: This paper is an approached method adjusting the blue light of the video to reduce the eye strainwhen people watching video on digital devices such as computer display, smartphone screen or tablet in different luminance of the environment’s light. The method is using the light sensor getting the luminance values of the light, then sending these values immediately to our program to process the frame of the video. The video’s frames will be processed based on lighting’s values and given the new video’s frames which are reduced the brightness light. The video with reduced the brightness and blue light will increase the visual comfort to the human eyes when people watch the video in different light environments from brightness to darkness.
Keywords: blue light, eye strain, lighting environment, video, visual comfort.
1. Introduction
In recently years, digital devices are very popular in the world because they are very useful in the human’s life.
The digital display of devices is produced from a variety of technology called light emitting diodes (LED). From this technology, the digital display exposes to blue light that is a primary factor causing the eye strain and visual discomfort. Some electronic device displays such as computer screen, laptop, smartphone device or TV emit a lot of the brightness light contained the blue lights which bring to people the eye symptoms. As we know that, the blue light has a short wavelength in the area of the visible light spectrum. The blue light’s wavelength has a range from 380nm (nanometer) to 500 nm; it is one of the shortest and highest energy wavelengths. The sources of blue light include the sun, computer display, smartphone screen, television, fluorescent and LED lighting. The eye strain is asthenopia in the medical term. When people concentrate their eyes on the digital display overtime, they will get the symptoms of ocular as fatigue, tired eyes, blurred vision, headache, neck pain and dry eyes. In the report of the vision council, there is 44% activity associated with the digital device used for work and 43 % for recreational reading. Besides, nearly 30% of the adults spend more than half of waking hours (> 9 hours) using a digital device. By using the most commonly digital devices as computer, smartphone, tablets, television,…the symptoms of digital eye strain are 32,8%, that is the highest symptom.
When doing the jobs or watching video on the computer more than two hours, people will get stress or some other symptoms. The reason is that some frames of the video have many brightness lights that will expose the blue lights to make people feel uncomfortable. In addition, if the people watch the same movie on day or night with the glare, they will tired eyes, general fatigue, blurring or headaches. As we are known that the brightness video is normal to the eyes at day because the daylight is brightness also, but it is glaring when watching at night or in darkness environment condition.
To filter or adjust the blue light, there are many ways to decrease the brightness light and increase the visual comfort such as using blue light filter applications, changing text and background color on the screen, or using the glasses. These methods have some advantages and disadvantages. In our research, we propose the system to process the color of video’s frame belonging to the luminance value of the light environment. Our method is set up a system to perceive the light environment. Based on the darkness or brightness light, we will process the collected value from sensor directly to the video’s frame and display on the digital display after filtering blue light on the video. From this method, the color and histogram of video’s frame will be rendered immediately when the environment changed. It means that if the video is taken from another environment, it will be processed adjusting the blue light to reduce the eye strain and enhance the visual comfort in the current environment of light when the viewer watching.
2. Related works
In previous researches, there are many research papers talking about the blue light that is affected to the human eyes. From the blue light exposed website, they are talking about what is the visible light and blue light.
Then, they also talk how the important of protection the human’s eyes from the harmful effects of the blue light rays. Besides, this website also presents which symptoms effect to the eyes such as blurry vision, dry and irritated eyes, neck pain and difficulty focusing. They apply the rule 20-20-20: watching every 20 minutes, focus and object about 20 feets and ways for 20 seconds. They also propose some solutions to filter blue light from digital devices. Kuang-Tsu Shih[3] and his coworkers show the solution to reduce harmful blue light and optimize the spectral transmittance and minimize the color distortion in the “blocking harmful blue light while preserving image color appearance”. Yong-Woo Kim[1] and coworkers introduce the method to decrease the visual discomfort by reducing blue light component. They survey perceived symptom before and after watching a movie and measure the eye-blink rates of the participants, saccadic movements and near the point of convergence in his analysis effects of the blue light. Yoon-Suk Kang[2] said that the brighter video gives more discomfort than the darker video after making the comparison on stereoscopic 3D display, auto-stereoscopic 3D monitor and HDM devices.
Additionally, there are some research papers about reading luminance of the light and turn on the light in the darker environment or turned off it in bright. In the tutorials point, they introduce about the histogram of an image and help to know which image is dark or bright from the histogram. From the “histogram equalization” article, Robert Krutsch and David Tenorio[4] said that which histogram covers all the possible values in the grayscale used is a good histogram. It means that the histogram will be a good contrast and details in the image will be observed more easily.
3. Theory Information
3.1. Blue light and visual comfort
Visual comfort is a metric that is used to rate the lighting senses. In the recently years, several people make the research about the visual comfort and the relation from the lighting environment to the visual comfort. According to the International Commission on Illumination (CIE), the standards on lighting environment with many parameters as relevant for visual comfort including color rendering index and correlated color temperature. Therefore, there is some research papers are considered on surfaces brightness and color, light distribution and appearance of light and luminaires. The Unified Glare Rating (UGR) system that is developed by CIE in 1995 to evaluate the visual comfort glare by lighting sources as follow:
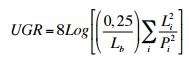
Where: Lb is the background luminance(cd/m2), Li is the luminance (cd/m2), Pi is the position of each luminance. From the CIE, the higher UGR value suggests the higher visual discomfort glare. Besides, the researchers consider that luminance arrangement, LED lights quantity and lighting source surface distribution can be the factor causing discomfort. They said that if the number of LED increases then the glare is decreased. In many case studies research, people recognize that the color affects to the visual comfort in the mood and performance.
As we known, the visible light has a wavelength from 400nm to 700nm (nanometer). It is visible for the human eye and responsible for the sense of the sight. In this range, the longer wavelengths are a red light and the shorter wavelengths are blue light. The blue light has a wavelength spectrum of between approximately 380nm and 500nm. It is one of the shortest and highest energies of wavelength.
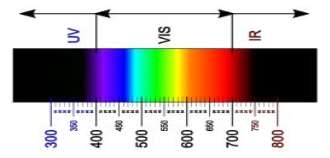
Fig. 1. Light spectrum with visible light (400-700 nm) and blue light (380-500 nm)
Where is the blue light? And, what effect of the blue light to the human life? The blue light actually exists anywhere. It is stored in the light of the sun and traveled through the atmosphere. Furthermore, the blue light is exposed from the digital devices such as PC monitor, smartphone screens, TVs, laptops, tablet displays, fluorescent and LED light. Today, the LED display is very popular. It is used the LED back-light technology to enhance the brightness of the screen and clarity. Unfortunately, the LED has the very height energy of the wavelength or blue light. Because of the development of PC, smartphone,….the digital devices with this technology are used on them. Therefore, people will watch the blue light too much. Besides of some benefits of blue light as boot alertness, help memory and cognitive function and evaluate moods, if people get the blue light emitted from the digital devices, they will get stress and eye strain. There are many kinds of eye strain as blurry vision, dry and irritated eyes, difficulty focusing, headaches, back pain,… They also increase the risk of depression, permanent eye damage or loss vision. There are the research from Harvard said that if people work the night shift and exposure to the blue light to get several types of cancer diabetes, heart disease or increased risk of depression.
3.2. Hardware circuit and Light Dependent Resistor (LDR) sensor
In our research, the hardware used to process and transfer luminance of lighting environment is Arduino circuit board. Arduino is an important circuit board that communicates with the computer and other electric devices via USB port. It also gets output data from electric devices and sends to the computer to process. Arduino is very famous microcontroller board with many categories. Arduino Uno is used in our research based on the ATmega328. The board has 14 digital output pins including 06 digital pins used as PWM output. It has the operating voltage of 5V and limitation of the input voltage from 6V to 20V. Additional, DC current of each I/O pin is 20mA. Flash memory has a capacity 32KB. Arduino read inputs from a sensor, finger on the button, data from USB or a Twitter message, then turn it into an output as activating motors, turning on a LED or publishing something online. There are a lot of projects in many fields and worldwide community of makers using the board to set up their projects. To do something, you can tell what you want to do by sending a set of instructions to the microcontroller on the board. Arduino is changing to adapt to new need and challenges with simple 8-bits boards to products for Internet of Things (IoT), wearable, 3D printing, and embedded environments.
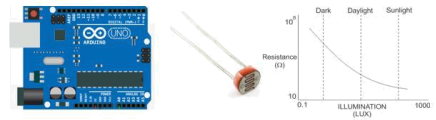
Fig. 2. Arduino board (left),LDR sensor (center) and characteristic of LDR sensor schema (right)
LDR sensor is a light sensitive device. It is made up of semiconductor materials having high resistance. It operates based on the resistance. If its resistance is very high, the LDR is kept in dark and brighter when its resistance decreases. When the light is incident, it takes 8 to 12 ms for the change in resistance to taking place and takes one or more seconds for the resistance to rise back again. LDR has a low cost and simple in structure. People use it as a light sensor. It is used for lamps on street or light intensity meters, etc.
3.3. Making image contrast
A histogram is a graph. It presents the frequency of anything that is provided in the dataset. The graph has two axes: y-axis presents the counting number of frequency and x-axis is the values of things in the dataset. In image processing, the histogram displays frequency of pixel intensity values. While x-axis is the gray of intensities, then y-axis shows the frequency of these intensities. The histogram is very useful in image processing. It can be used in medical to predict something from X-ray picture, adjusting the contrast of an image or using in thresholding, Therefore, equalization histogram is necessary to get the balance in the image. To enhance the contrast, we make the histogram equalization. After equalization, the intensity of the image is better distributed on the histogram. There are some methods to equalize the histogram such as histogram expansion, local area histogram equalization, cumulative histogram equalization, par and odd sectioning.
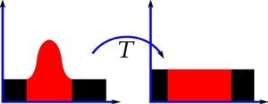
Fig. 3. Histogram equalization
4. Algorithm and results
In the previous section, the blue light is a primary to make the people getting eye strain and visual discomfort when they work on the digital display devices. The eye strain will make people get stress or some other diseases. If people work or watch image/movie long time on the computer or digital devices at the night, the eye strain and discomfort will be increased more and more. This is very dangerous to the human eyes and their mental. With the blue light exposed from the PC monitor, people work on the screen of the computer or the laptop will increase the stress or eye strain. Especially, it will be increased more and more visual discomfort if people watch image or video at the night. At that time, the light of environment is too dark, and the video may have much lights of the blue color. So, reducing the eye strain and increasing visual comfort that synonym to reduce the blue light on each frame of the video is very necessary in this case. The problem is how to reduce it?
From our research, we propose the solution to help people reduce the eye strain when they watch the video in the darkness environment of light. Our solution is a system with two parts including electric devices and image processing program. Our system’s structure is described in the following figure:
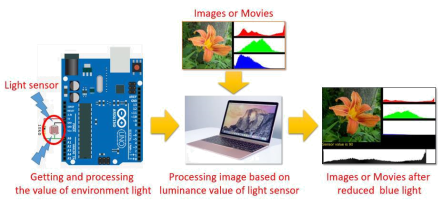
Fig. 4. The structure of reducing blue light and increasing visual comfort system.
In the process, if we have the video that is captured from brightness environments. As we known that, the brighter frames of the video caused more visual discomfort than darker video. So, when we watch the brighter video in the dark lighting environment, we will get more visual discomfort. How to know which is the brighter or darker lighting environment? We use the LDR sensor. LDR sensor with the resistor to get the intensity of the environment and Arduino board collects the values of LDR. On the other hand, we get the information from the input video (video’s frames) via histogram. We process every pixel from the input video (video’s frames) with the value collected by Arduino. In the next, we are mapping the pixel’s color after processed into (255,255,255).
Then, we make the equalization histogram for the image to enhance the contrast. Finally, the new output video (video’s frames) is rendered and reduced blue light in the new environment.
In generally, our algorithm is presented as following:
- Read luminance value of current environment by LDR sensor (E).
- Calculate and send to the program value of (E).
- Read the desired video by sequentially frames.
- Calculate the value of (E) on each pixel of video’s frames.
- Process color of the video’s frames after calculating in the fourth step.
- Equalize histogram to enhance the contrast of the video’s frames.
- Display new rendered video after reduced eyestrain or visual discomfort (increasing visual comfort). The LDR light sensor gets the light’s luminance of the environment and process that value by using Arduino
board. The computer read the video and the lighting’s luminance values sent from the Arduino board based on the lighting’s luminance values, we calculate the histogram and process above video’s frames, then rerender that video suitable to the environment light. The output video is reduced the blue-light and reduces the eye strain of the viewer. Finally, the viewer will watch the video in less visual discomfort in the different lighting environments (from brightness to darkness).
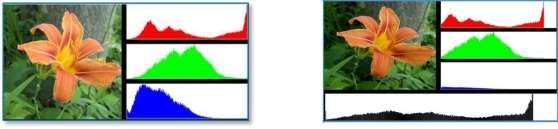
Based on the algorithm and processing video, we try to work on the day and night with the same video. For easy imaging, we choose an image frame of video and process on it with the luminance value from lighting environment. The result has some different images that are different to the original image. The results are depicted as follow:
|
Original image frame |
Result image frame on the day |
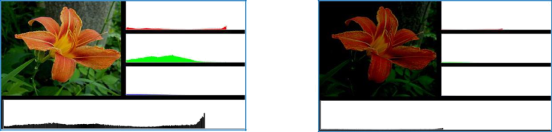
Result image frame at the night in less darknessResult image frame at the night in very darkness
Fig. 5. Output image frame in different values collected from light sensor
For the 3D stereo images, we also process the left and right images belonging to the light values that are collected from the LDR light sensor via Arduino circuit board. In this case, re-rendered the images by calculating a color based on environment light is very important because it is strong effected to the eye. If the blue light is not reduced, the eye strain will be stronger and visual discomfort more increasing when watching 3D stereo movie.
5. Conclusion
Today, the digital devices are very popular. It always exists parallel in the human’s life. Therefore, watching video on the digital display devices in a long time will get stress, eye strain, and visual discomfort. Our paper has proposed the solution to the viewer when they watch the video by using light sensor-LDR. The LDR light sensor perceives the current light environment, the system processes to make an output video belonging to the environment that is reduced eye strain and visual discomfort. Our solution gives the result depending on correspondence environment brightness or darkness.
References
- Yong-Woo Kim and Hang-Bong Kang. (2016). Analysis of blue-light effects in reducing visual discomfort from watching stereoscopic 3D video. Society for Imaging Science and Technology.
- Yoon-Suk Kang and Sungho Cho. (2016). Comparison of visual discomfort when viewing 3D videos with various contrast changes on a stereoscopic 3D display, an autostereoscopic display, and an HMD. Society for ImagingScience and Technology.
- Kuang-Tsu Shih, Jen-Shuo Liu, Frank Shyu, Su-Ling Yeh, and Homer H. Chen. (2016). Blocking Harmful Blue Light while Preserving Image Color Appearance. ACM Trans. Graph, Vol. 35, No. 6, Article 175, 10 pages.
- Takashi Shibata, Joohwan Kim, David M. Hoffman, Martin S. Banks. (2011). The zone of comfort: Predicting visual discomfort with stereo displays. Journal of Vision, 11(8):11, 1-29.
- Gordon Wetzstein, Wolfgang Heidrich1 and David Luebke. (2010). Optical Image Processing Using Light Modulation Displays. Computer Graphics Forum, vol 29, issue 6, pp. 1934-1944.
- Monica Sät. (2010). Colour And Light And The Human Area For Visual Comfort. Colour and Light in Architecture_First International Conference 2010_Proceedings, 285-291.
- Robert Krutsch and David Tenorio. (2011). Histogram Equalization. Technical Report, Microcontroller Solutions Group, Guadalajara, Rev.0.
- Paola Iacomussi , Michela Radis, Giuseppe Rossi, Laura Rossi. (2015). Visual Comfort with LED Lighting. The 6th International Building Physics Conference, IBPC. Energy Procedia 78 ( 2015 ) 729 – 734.
- The Vision Council. (2011). Protect your eyes from Digital devices. Digital eye strain report, unpublished.
- “Effect of blue light technology”, https://en.wikipedia.org/wiki/Effects_of_blue_lights_technology.
- “Eye Strain”, http://www.medicinenet.com/eye_strain/article.htm.
- “Arduino Tutorial”,  https://www.arduino.cc/en/Tutorial/Calibration.
- “Visual comfort probability”, https://en.wikipedia.org/wiki/Visual_comfort_probability
Authors
Viet Tran Hoang is a PhD candidate in Global School of Media, Soongsil University, Seoul,Korea. He had received his B.S degree in Computer Science from Cantho University, Vietnam, in 2000. He hold a M.S degree in Information System Management from HAN University, Netherlands, in 2011. He is currently pursuing his PhD in Computer Graphics at Soongsil University, Seoul, Korea. His research interests include image processing, 3D real-time rendering and 3D stereoscopic rendering.

Cite This Work
To export a reference to this article please select a referencing stye below:
Related Services
View all


DMCA / Removal Request
If you are the original writer of this essay and no longer wish to have your work published on UKEssays.com then please click the following link to email our support team:
Request essay removal