Effect of Using Mobile Phones on Posture for Children
Info: 25610 words (102 pages) Dissertation
Published: 17th Dec 2019
Tagged: PhysiologyMobile Phones
CHILDREN’S POSTURAL RISK WHEN USING MOBILE TECHNOLOGY
Industrial & Manufacturing Engineering & Technology
Abstract
Maintaining the musculoskeletal health of children using mobile information and communication technologies (ICT) at home presents a challenge. The physical environment influences postures during ICT use and can contribute to musculoskeletal complaints. Few studies have assessed postures of children using ICT in home environments. The purpose of the study was to conduct the Rapid Entire Body Assessment (REBA). The final scores which include wrists, forearms, elbows, shoulders, neck, trunk, back, legs and knees upper arm score, lower arm score with recommended action levels are determined using videotaped scenarios of children using two types of mobile ICTs and compared to those of the recommended scores and levels.
Keywords: minimizing risk, mobile technologies, Rapid Entire Body Assessment (REBA).
1. Introduction
Information and communication technologies (ICTs) are an indispensable part of modern day society. Several studies report associations between ICT use in children and adolescents and musculoskeletal discomfort (Be´langer , 2011; Hakala, 2006; Jacobs and Baker, 2002; Straker , 2008;) which are similar to those observed among adult computer users in vocational settings (Gerr , 2004). Given that children are still developing physically, there was reasonable concern regarding the long-term impact of such exposure on their musculoskeletal health (Belanger, 2011). Recent technological advances have inspired a genre of portable, compact and personalized ICT devices, such as laptop computers, touchscreen tablets and smartphones. These mobile devices can be used in a wide range of physical environments while adopting a range of postures (Baker, 2012). In other words, anywhere can be considered an ICT workstation. However, Studies into the postures adopted by school-aged children while using an ICT workstation have predominantly been within school environments (Harris. C, 2000).

Figure 1. Participant using the ICT Laying on the floor
Limited research exists on the postural risks associated with children’s ICT use in the home environment. At home, children are likely to use their mobile ICT devices for unsupervised leisure and social pursuits, have longer durations of use for completing educational tasks than when at school, and adopt a range of postures across different locations in the home (Breen.R, 2007).

Figure 2. Participant Using the TAB on the Sofa
2. Background
Posture was an independent risk factor for MSDs among computer users. The most consistent finding was that locating the device at or below the height of the elbow and resting the arms on the desk surface or chair armrests was associated with reduced risk of neck and shoulder MSDs (Gerr, 2004).
Digital gaming is to be related to LBP (Low Back Pain) and NSP (Neck Shoulder Pain). Playing video games has previously been reported to be a risk factor for LBP among 9-year-olds Hakala (2006).
Digital game playing as in computers, the Internet, television, and console games was a multiform activity of different postures. Although mostly requiring repetitive hand motion in sitting position, the basic mechanism of gaming relies on dynamic action where players change postures freely and the loading of the upper extremities was minimized. On the other hand, LBP was known to be related to prolonged sitting when exposure times in digital gaming and computer use were high (Hakala, 2006).
According Baker the use of computer may be associated with musculoskeletal complaints in a population of middle school aged children (2012). The risk factors associated between musculoskeletal discomfort in children and computer use was very similar to those risk factors being cited in the adult literature.
However, there has been much less research on children and computer use, so there has been less impetus to provide ergonomically correct computer workstations for children at home. This paper tries to emphasize on children developing the risk of MSD due to improper posture.
2.1 Musculoskeletal Disorders (MSDs)
MSDs are a common problem for people across the United States. Musculoskeletal disorders are injuries and disorders that affect the human body’s movement or musculoskeletal system (i.e. muscles, tendons, ligaments, etc.). When the children are exposed to MSD risk factors, they begin to fatigue. When fatigue outruns their body’s recovery system, they develop a musculoskeletal imbalance. Over time, as fatigue continues to outrun recovery and the musculoskeletal imbalance persists, a musculoskeletal disorder develops (Grimes. P, 2004).
Pain, headaches, and muscle fatigue can develop in the neck and upper back region after just 20 minutes of computer use. The longer the duration on one task, more discomfort may result. 60% of students have reported discomfort with laptop use, and 61% have reported discomfort carrying their laptop (Grimes. P, 2004).
2.2 Problem Statement
With increasing numbers of children using mobile ICT devices at home, it is important to assess their impact on children’s posture, so that appropriate guidelines for the healthy use of these mobile technologies can be developed.
2.3 Research objective
The objective of this study was to
- Obtain grand scores and action levels on the REBA, while undertaking postural risk assessments of a child using mobile ICT devices in a home environment.
- Identify the better position for children using mobile ICTs in a home environment.
- Provide suggestions on how to translate ergonomics principles for healthy ICT use among children into practical solutions for people to manage postural risks.
- Methodology
3.1 Ergonomic assessment tool (REBA)
This ergonomic assessment tool (REBA) uses a systematic process to evaluate whole body postural MSD and risks associated with job tasks. A single page worksheet is used to evaluate required or selected body posture, forceful exertions, type of movement or action, repetition, and coupling. The REBA was designed for easy use without need for an advanced degree in ergonomics or expensive equipment, just worksheet and a pen.
Using the REBA worksheet, the evaluator can assign a score for each of the following body regions: wrists, forearms, elbows, shoulders, neck, trunk, back, legs and knees. After the data for each region is collected and scored, tables on the form are then used to compile the risk factor variables (Harris.C, 2000).
The REBA rating scale was reported to have good reliability when used by physiotherapists, and industrial and safety engineers to assess adults; although the exact values of the reliability calculation are not documented. Several researchers have used REBA to assess postures among children in school environments (Bao.S, 2007).
The REBA worksheet is divided into two sections labeled A and B. Section A (right side) covers the neck, trunk and legs. Section B (left side) covers the arm and wrists. This segmenting of the worksheet ensures that any awkward or constrained postures of the neck, trunk or legs which might influence the postures of the arms and wrists are included in the assessment.
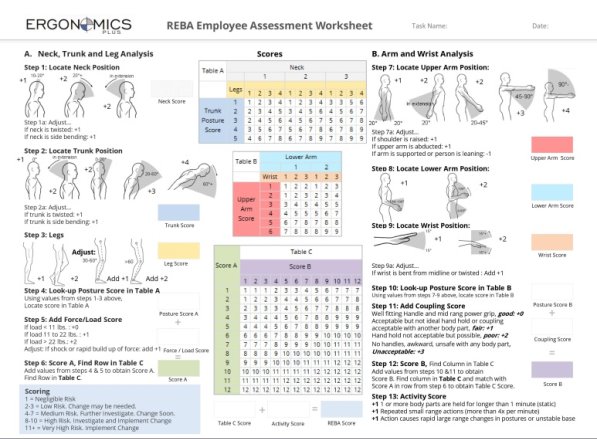
Figure 3. REBA Worksheet with neck, trunk, legs, posture, and load score; score a, upper arm, lower arm, wrist, coupling score, score b, activity score. (2015, November 6). In A Step-by-Step Guide to the REBA Assessment Tool. Retrieved August 12, 2016.
3.1.1 Group A: Table A: Neck, Trunk and Leg Analysis. The evaluator should score Group A (Neck, Trunk and Leg assessment) postures first, and then score Group B (Upper arm, Lower arm, Wrist, Coupling score, Score B, Activity Score) postures for left and right. (Sue Hignett, 2000).
For each region, there was a posture scoring scale and additional adjustments outlined on the worksheet which need to be considered and accounted for in the score.
- Step 1: score will be used for Neck position.
- Step 2: score will be given for the Trunk position.
- Step 3: wrist score will be for Legs.
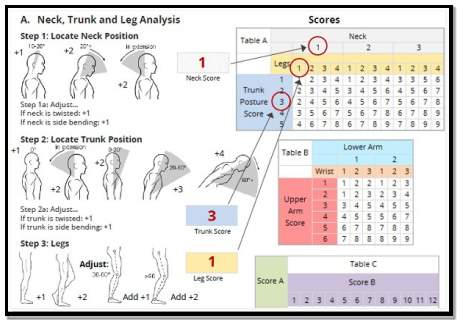
Figure 4. Group A with Neck, Trunk and Leg assessment. (2015, November 6). In A Step-by-Step Guide to the REBA Assessment Tool. Retrieved August 12, 2016, from http://ergo-plus.com/REBA-assessment-tool-guide/
- Step 4: Using values from steps 1-3, locate the score for this step in table A.
- Step 5: Add the force score to this box. In this case, the weight of the component part inserted by the worker was 11.5 lbs.
- Step 6: Add the values in step 4 and 5 to obtain score A. Find row for Score A in Table C and circle value.
3.1.2Group B: Arm and Wrist Analysis.
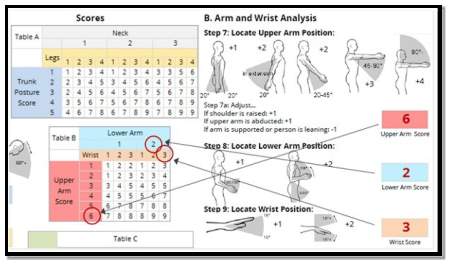
Figure 5. Upper arm, Lower arm and Wrist position assessment, (2015, November 6). In A Step-by-Step Guide to the REBA Assessment Tool. Retrieved August 12, 2016, from http://ergo-plus.com/REBA-assessment-tool-guide/
- Step 7: The right upper arm was raised more than 90 degrees for a score of +4, a total adjustment of +2 was added if the shoulder was raised (+1) and the upper arm was abducted (+1) for a total score.
- Step 8: a +2 score was used due to the arm position outside of the neutral range.
- Step 9: a twisting adjustment of +1 was added to the position score of +2 for a total wrist score of +3.
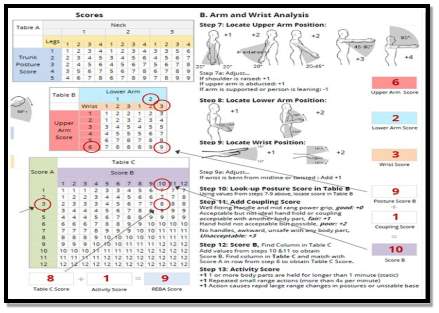
Figure 6. Group B(Arm and Wrist Analysis) with Upper arm, Lower arm, Wrist, Coupling score, Score B, Activity Score. (2015, November 6). In A Step-by-Step Guide to the REBA Assessment Tool. Retrieved August 12, 2016, from http://ergo-plus.com/REBA-assessment-tool-guide/
- Step 10: Using values from steps 7-9, locate the posture score for this step in table B.
- Step 11: Add the coupling score. In this case, the coupling was considered fair (+1).
- Step 12: First, add the values in step 10 and 11 to obtain score B. Next, find column in Table C and match with Score A in row from step 6 to obtain Table C Score.
- Step 13: The Activity Score was +1 due to job requiring small range actions (more than 4x per minute). The Final REBA Score = Table C Score + Activity Score.
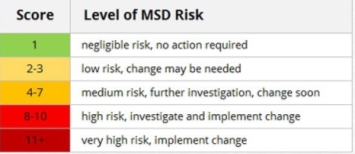
Figure 7. Final REBA Score with MSD level indicator, (2015, November 6). In A Step-by-Step Guide to the REBA Assessment Tool. Retrieved August 12, 2016, from http://ergo-plus.com/REBA-assessment-tool-guide.
3.2 Participants
The participants in this experiment were the respondents or subjects of study who were observed, performed the trials and filled out the survey. A homogenous mixture of four boys and five girls performed the trials at Bradley University.
The age group of the participants/subjects was 10-12 years. Most of the participants were coming from metropolitan areas like Peoria, IL helped them having basic idea on the usage of the ICTs. The study was approved by the Committee on the Use of Human Subjects in Research (CUHSR) at Bradley University, Peoria, Illinois and all participants provided informed consent prior to data collection.
3.3 Procedures
Data collection was conducted in a laboratory at Bradley University, Peoria, Illinois. Prior to data collection, participants reviewed the study protocol and were provided with three different platforms/stations.
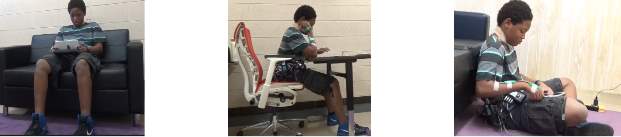
Figure 8. Participants performing different trials on different stations with mobile ICTs
3.4 Equipment/Apparatus
The electronic equipment used in this experiment includes two ICTs (mobile phone, tablet) and two SONY cameras, one preprogrammed computer laptop. The physical equipment used was REBA sheets.
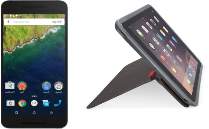
Figure 9. Those were two kinds of ICTs being used in this experimentation.
3.5 Design of Trials
There were 17 different trials tabulated in Table 10 Design of Trials that the participants were clearly instructed to follow which include participant choice (Pope-Ford R. D., 2016). All the trials were randomized to form a homogeneous data set for all the participants.
3.6 Video scenarios and data collection
Postures represented in Fig.8 scenarios were videotaped mid-task to allow the child to settle into her typical self-selected postures. Each scenario was filmed from a minimum of two different stationary viewing angles to provide a comprehensive view of the child’s posture. Raw video data was produced and a single video clip for each trial in scenario was recorded that was between 120s and 140s duration (Pope-Ford, 2016).
The videotaped scenarios were observed using a computer laptop and REBA assessment was conducted. All the independent variables that were present in the REBA sheet were documented and tabulated separately as shown in Table 10 Design of Trials for all the nine participants.
3.7 Data Analysis
The collected data was analyzed using the Minitab 17 (2010). [Statistical analysis software]. (State College, PA) with two different tests
- One-Way ANOVA (Analysis Of Variance) With Fisher Pairwise Comparison Test.
- Two sample T-test for individual pairs.
3.7.1 One-Way ANOVA with Fisher pairwise comparison Test. A One-Way ANOVA (analysis of variance) test is used when one categorical factor and a continuous response are present and to determine whether the means of two or more groups differ. Fisher’s LSD method is used with ANOVA to create confidence intervals for all pairwise differences between factor level means while controlling the individual error rate to a significance level specified.
Fisher’s LSD method then uses the individual error rate and number of comparisons to calculate the simultaneous confidence level for all confidence intervals. This simultaneous confidence level is the probability that all confidence intervals contain the true difference.
An individual comparison between the stations that were SS (Sitting on the Sofa), SC (Sitting on the Chair) and SF (Sitting on the Floor) was the best way to predict the best platform/station for the children to use the ICT at any home environment. Thus, the test was conducted in three different phases based on the kind of the device they used while performing the trials. The sequence being
- Phone
- Tablet
- Participant Choice
3.7.2 Graphs for ANOVA test. There are two graphs in the analysis .They are
- Interval plot: The interval plot is used to display the mean and confidence interval for each group. Each dot represents a sample mean. Each interval is an 85% confidence interval for the mean of a group.
- Difference of mean plot: The mean of the observations within each group describes each group with a single value identifying the center of the data. It is the sum of all the observations with a group divided by the number of observations in that group. The mean of each sample provides an estimate of each population mean.
3.7.3 Two sample T-Test for individual pairs. Two-Sample T-test determines whether the means of two independent groups differ and calculates a range of values that are likely to include the difference between the population means. It creates a confidence interval and does a hypothesis test of the difference between two populations’ means when standard deviations are unknown and samples are drawn independently from each other. This procedure was based on the t-distribution.
The two sample T- test was conducted for individual platforms in pairs (SS, SC, SF, PC/SS, PC/SC, PC/SF and PC/SF (L)) with respect to the device used while performing the trial. The two sample T-test was conducted for individual pairs as the probability value (p-value) obtained from the ANOVA test was for the three platforms/stations combined and it does not specify for the individual comparisons.
- Results and discussions
4.1 One- Way ANOVA test for participants using phone
Test Conditions for ANOVA were the Null hypothesis to be ‘All means are equal’, The Alternative hypothesis to be ‘At least one mean was different’, and Significance level (α) = 0.15.
Table 1 ANOVA test results for posture vs phone-REBA score
| Source | DF | Adj SS | Adj MS | F-Value | P-Value |
| POSITION | 2 | 17.85 | 8.926 | 5.3 | 0.012 |
| Error | 24 | 40.44 | 1.685 | ||
| Total | 26 | 58.3 |
Note: This table shows ANOVA test results conducted on the data set. The degree of freedom was 2, the standard error was 24 and the P-value was 0.012.
The table suggests a lower P-value when compared to α value (0.012<0.15).Thus, it can be inferred that the Null hypothesis should be rejected, All the means are not equal and at least one factor (SS, SC and SF) has significant influence on response (Phone-REBA score).
4.1.1 Fisher’s Pairwise comparison test for participants using phone (SS vs SC vs SF). After selecting the three platforms as factors, the comparison was conducted with a confidence interval of 85%. Fisher’s LSD comparison test results for phone were as follows
Table 2 Grouping information table for posture vs REBA scores when participant uses phone
| Position | N | Mean | Grouping |
| SC | 9 | 10 | A |
| SS | 9 | 9.889 | A |
| SF | 9 | 8.222 | B |
Note: This table shows the results of the Fisher’s LSD conducted on the data set.
This table suggests that SC and SS were grouped as the letter A and SF was grouped as letter B which implies that the SF has a lower and a better REBA score.
4.1.1.1 Interval plot for position (SS, SC, and SF) and REBA scores for phone. In the interval plot, SF (8.222) has the lower mean and SC (10) has the highest (SF (8.222) <SS (9.889) <SC (10)).
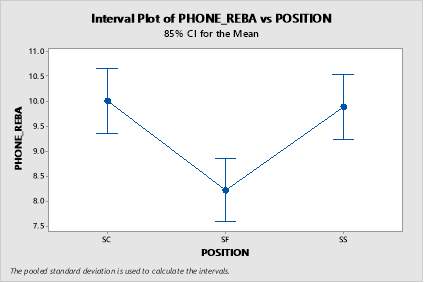
Figure 12 Graph representing the interval plot of REBA scores and Position, Minitab 17 Statistical Software (2010). [Computer software]. State College, PA: Minitab, Inc. (www.minitab.com)
4.1.1.2 Differences of the mean values for REBA score while using phone for SS,SC, SF.
. 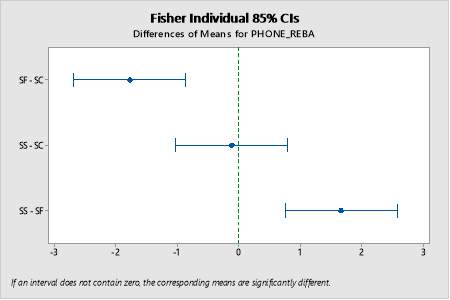
Figure 13 Graph representing differences of the mean values for REBA score while using phone, Minitab 17 Statistical Software (2010). [Computer software]. State College, PA: Minitab, Inc. (www.minitab.com)
In these results, the graph shows all means are not equal and the difference in the means of SS and SC is -0.111 which is very close to zero, whereas the difference between SF and SC shows -1.669 and the difference between SS and SF shows 1.778. The difference in the means also predicts that (SF<SS<SC).
4.2 One Way ANOVA for Participants Using Tablet
Test Conditions for ANOVA were the Null hypothesis to be ‘All means are equal’, The Alternative hypothesis to be ‘At least one mean was different’, and Significance level (α) = 0.15.
Table 3 ANOVA test results for posture vs Tab-REBA score
| Source | DF | Adj SS | Adj MS | F | P-Value |
| Posture | 2 | 60.37 | 30.185 | 14.22 | 0.000 |
| Error | 132 | 280.18 | 2.123 | ||
| Total | 134 | 340.55 |
This table was the after part of the ANOVA conducted on the data set. The degree of freedom was 2, the standard error was 132 and the P-value was 0.000.
The table suggests a lower P-value when compared to α value (0.000<0.15). Thus, it can be inferred that Null hypothesis should be rejected, All the means are not equal and at least one factor (SS, SC and SF) have significant influence on response (TAB-REBA score).
4.2.1 Fisher’s LSD comparison test for participants using Tablet. This table shows the results of the fisher’s LSD conducted on the data set.
The result of the test was that there was one factor’s mean that stands out from the lot and it was considerably lower than the rest. In this case, the factor having least mean value was SF that was 8.378.
Table 4 Grouping information table for posture vs REBA scores when participant uses Tablet
| Posture | N | Mean | Grouping |
| SC | 45 | 9.933 | A |
| SS | 45 | 9.600 | A |
| SF | 45 | 8.378 | B |
4.2.1.1Interval plot for position (SS, SC, SF) and REBA scores for Tablet. In the interval plot, SF (8.378) has the lower mean and SC (9.933) has the highest (SF (8.378) <SS (9.933) <SC (9.933)).
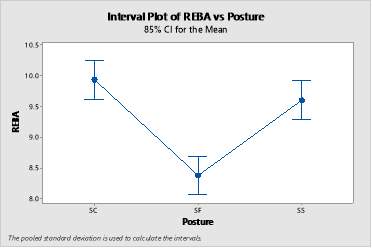
Figure 16 Graph representing the interval plot of TAB-REBA scores and Position, Minitab 17 Statistical Software (2010). [Computer software]. State College, PA: Minitab, Inc. (www.minitab.com)
4.2.1.2 Differences of the mean values for REBA score while using Tablet. This graph helps determining the individual mean differences for REBA scores. In these results, the graph shows all means are not equal and the difference in the means of SS and SC is -0.333. Whereas the difference between SF and SC shows -1.555 and the difference between SS and SF shows 1.222. The difference in the means also predict that (SF<SS<SC).
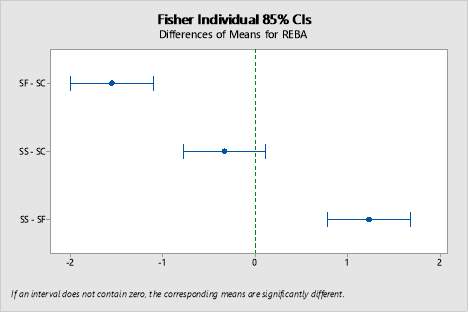
Figure 17 Graph representing differences of the mean values for REBA score while using Tablet, Minitab 17 Statistical Software (2010). [Computer software]. State College, PA: Minitab, Inc. (www.minitab.com)
An inference can be made from the graph that the means of SS and SC are very close and the mean value of SF was quite different and low when compared to the rest.
4.3 One-Way ANOVA for Participant Choice
The ANOVA for participant choice follows a sequence for comparison which is as follows:
- PC/SF (Sitting on the Floor) and PC/SC (Sitting on the Chair)
- PC/SF(Lay) (Laying on the Floor) and PC/SC(Lay) (Laying on the Chair)
- PC/SS (Sitting on the Sofa) and PC/SC (Sitting on the Chair)
- PC/SF(Lay) (Laying on the Floor) and PC/SF (Sitting on the Floor)
- PC/SS (Sitting on the Sofa) and PC/SF (Sitting on the Floor)
- PC/SS (Sitting on the Sofa) and PC/SF (Laying on the Floor)
Test Conditions for ANOVA were the Null hypothesis to be ‘All means are equal’, the Alternative hypothesis to be ‘At least one mean was different’, and significance level (α) = 0.15.
Table 5 ANOVA for Posture vs PC-REBA score
| Source | DF | Adj SS | Adj MS | F | P-Value |
| POSITION | 3 | 25.46 | 8.487 | 4.30 | 0.024 |
| Error | 14 | 27.65 | 1.975 | ||
| Total | 17 | 53.11 |
Note: This table was the ANOVA conducted on the data set. The degree of freedom was 3, the standard error was 14, and the P-value was 0.024. The P-value from the table suggests a very low P-value when compared to α value (0.024<0.15).
Thus, it can be inferred that the Null hypothesis should be rejected, All the means are not equal and at least one factor (PC/SC, PC/SF, PC/SF(LAY), PC/SS) has significant influence on response (PC-REBA score).
4.3.1 Fisher’s Pairwise comparison test for participants using phone (SS vs SC vs SF). The result of the test was one factor’s mean that stands out from the lot and it was considerably lower than the rest. In this case, the factor having the least mean value was SF (Sitting on the Floor) that was 6.000.
Table 6 Grouping information table for posture vs REBA scores for participant’s choice
| POSITION | N | Mean | Grouping |
| PC/SC | 2 | 10.500 | A |
| PC/SS | 10 | 9.600 | A |
| PC/SF(LAY) | 4 | 9.250 | A |
| PC/SF | 2 | 6.000 | B |
Note: This table shows the results of the Fisher’s LSD conducted on the data set.
4.3.1.1 Interval plot for position (PC/SS, PC/SF, PC/SF (LAY) SC, SF) and REBA scores for participant’s choice. In the interval plot, PC/SF (6.000) has the least mean and PC/SC (10.500) has the highest (PC/SF (8.378) < PC/SF (LAY) (9.250) < PC/SS (9.600) < PC/SC (10.500)).
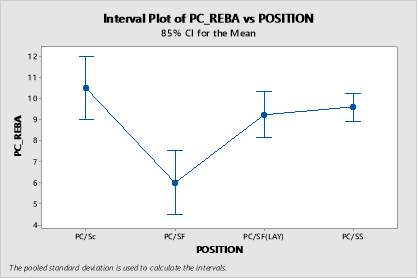
Figure 20 Graph representing the interval plot of PC-REBA scores and Position, Minitab 17 Statistical Software (2010). [Computer software]. State College, PA: Minitab, Inc. (www.minitab.com)
4.3.1.2 Differences of the mean values for REBA score while using Tablet for SS, SC, and SF for participant’s choice. The graph shows all means are not equal and the difference in the means of PC/SF and PC/SC is -4.5, whereas the difference between PC/SF (LAY) and PC/SC shows -1.250 and the difference between PC/SS and PC/SC shows -0.9, and the difference between PC/SF (LAY) and PC/SF shows 3.25, and the differences between PC/SS and PC/SF (LAY) shows 0.350. The difference in the means also predict that (PC/SF<PC/SF (LAY) < PC/SS<PC/SC).
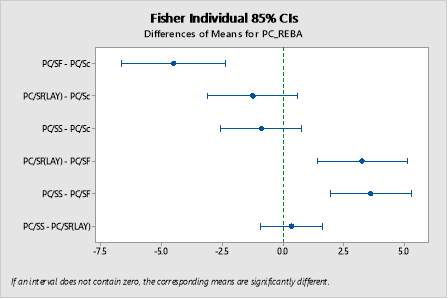
Figure 21 Graph representing differences of the mean values for REBA score while performing their participant choice of position, Minitab 17 Statistical Software (2010). [Computer software]. State College, PA: Minitab, Inc. (www.minitab.com)
An inference can be made from the graph that the means of SS and SC are very close and the mean value of SF was quite different and low when compared to the rest.
4.4 Two sample T-Test for individual pairs (SS-SC, SS-SF, SC-SF) for participant was using phone
The Two sample T-test is now conducted with three different pairs of stations (SS-SC, SS-SF, SC-SF). All three stations were compared individually and P-value was obtained.
4.4.1 The two sample T-test for the SF and SC while the participant was using phone. The probability value for this pair (SF and SC) was 0.006 which was less than α value (0.15) that was {P-value (0.006) < α (0.005)}, thus, it can be inferred that there was a difference between the means. SF has a lower mean value when compared to SC.
Table 7 Test results for Two-Sample T-Test and CI: SF, SC
| Test Variables | Test Results |
| P-Value | 0.006 |
| Difference | μ (SF) – μ (SC) |
| Estimate for difference | -1.778 |
| 85% CI for difference | (-2.584, -0.971) |
| Degree of Freedom | 11 |
4.4.2 Two-Sample T-Test and CI: SS, SC while the participant was using phone. The two sample T-test for the SS and SC show the following results
Table 8 Test results for Two-Sample T-Test and CI: SS, SC
| Test Variables | Test Results |
| P-Value | 0.854 |
| Difference | μ (SS) – μ (SC) |
| Estimate for difference | -0.111 |
| 85% CI for difference | (-1.028, 0.806) |
| Degree of Freedom | 10 |
The probability value for this pair (SF and SC) was 0.006 which was less than α value (0.15) that was {P-value (0.854) > α (0.005)}.It can be inferred that there was no difference between the means. SS has a lower mean value when compared to SC.
4.4.3 Two-Sample T-Test and CI: SS, SF while the participant was using phone. The two sample T-test for the SS and SF show the following results
Table 9 Test results for Two-Sample T-Test and CI: SS, SF
| Test Variables | Test Results |
| P-Value | 0.033 |
| Difference | μ (SS) – μ (SF) |
| Estimate for difference | 1.667 |
| 85% CI for difference | (0.587, 2.746) |
| Degree of Freedom | 15 |
The probability value for this pair (SF and SC) was 0.006 which was less than α value (0.15) that was {P-value (0.033) < α (0.005)}. Thus, it can be inferred that there was a difference between the means. SF (sitting on the floor) has a lower mean value when compared to SS (sitting on the sofa).
4.5 Two sample T-Test for individual pairs (SS-SC, SS-SF, SC-SF) while the participant was using Tablet
Two sample T-test is now conducted with three different pairs of stations. All the three stations were compared individually and P-value was obtained.
4.5.1 Two-Sample T-Test and CI: SF, SC while the participant was using Tablet. The two sample T-test for the SF and SC show the following results
Table 10 Test results for Two-Sample T-Test and CI: SC, SF
| Test Variables | Test Results |
| P-Value | 0.000 |
| Difference | μ (SF) – μ (SC) |
| Estimate for difference | -1.556 |
| 95% CI for difference | (-2.110, -1.001) |
| Degree of Freedom | 78 |
The probability value for this pair (SF and SC) was 0.006 which was less than α value (0.15) that was {P-value (0.000) < α (0.005)}. Thus, it can be inferred that there was a difference between the means. SF (sitting on the floor) has a lower mean value when compared to SC (sitting on the chair).
4.5.2 Two-Sample T-Test and CI: SS, SC while the participant was using Tablet. The Two sample T-test for the SS and SC shows the following results
Table 11 Test results for Two-Sample T-Test and CI: SC, SS
| Test Variables | Test Results |
| P-Value | 0.269 |
| Difference | μ (SS) – μ (SC) |
| Estimate for difference | -0.333 |
| 95% CI for Difference | (-0.930, 0.263) |
| Degree of Freedom | 74 |
The probability value for this pair (SF and SC) was 0.006 which was less than α value (0.15) that was {P-value (0.269) < α (0.005)}. Thus, it can be inferred that there was a difference between the means. SS (sitting on the sofa) has a lower mean value when compared to SC.
4.5.3 Two-Sample T-Test and CI: SS, SF while the participant was using Tablet. The two sample T-test for the SS and SF show the following results
Table 12 Test results for Two-Sample T-Test and CI: SS, SF
| Test Variables | Test Results |
| P-Value | 0.001 |
| Difference | μ (SS) – μ (SF) |
| Estimate for difference | 1.222 |
| 95% CI for Difference | (0.546, 1.899) |
| Degree of Freedom | 87 |
The probability value for this pair (SF and SC) was 0.001 which was less than α value (0.15) that was {P-value (0.001) < α (0.005)}. Thus, it can be inferred that there was a difference between the means. SS has a lower mean value when compared to SF.
4.6 Two sample T-test for Participant Choice
The Two sample T-test cannot be conducted as the data set has unequal and fewer number of data points.
All mean REBA score values for all the cases of phone, Tablet, and participant choice has been tabulated in their descending order.
Table 13 Posture vs Mean TAB-REBA score Posture vs Mean Phone-REBA score Posture vs Mean PC-REBA score
| Position | Mean Tab-REBA score | Position | Mean Phone-REBA score | POSITION | Mean PC-REBA score |
| SC | 9.933 | SC | 10 | PC/SC | 10.5 |
| SS | 9.6 | SS | 9.889 | PC/SS | 9.6 |
| SF | 8.378 | SF | 8.222 | PC/SF(LAY) | 9.25 |
| PC/SF | 6 |
Note: All three different platforms/stations mean REBA scores have been displayed in a descending order (Top to bottom).
- Conclusion
Participants who performed the trials have shown a high risk REBA score Figure 7 in all the three cases of phone, Tablet, and participant choice.
The SF (Sitting on the Floor) had the least mean REBA score values(8.375, 8.222, 6.000) in all positions including the participant choice which means a lower risk of MSD when compared to other positions was possible if the participant uses the floor as the station.
The SC (Sitting on the chair) had the highest mean REBA score values (9.933, 10, 10.5) in all positions including the participant choice which means a higher risk of MSD when compared to other positions was possible if the participant uses a chair as the station.
- Recommendations
Few recommendations drafted aiming a better musculoskeletal health of the children using ICTs.
- Sit on the floor with your back supported.
- Do not hold the devices too close to your chest.
- Make sure the lower back and trunk portions are supported.
- Take regular breaks from the ICT usage.
- Sit back in your chair; your back should be supported by the seat back.
- Adjust your chair height so that your hips are slightly higher than your knees.
- Prevent the spine from becoming fixed in abnormal positions.
- Optimize breathing and circulation.
- Distribute your weight evenly on both hips.
- Keep your head and neck aligned over your shoulders.
- Be sure your feet are supported by the floor or a footrest.
- Avoid sitting for long periods of time; get up from your chair at least once every hour.
- Do not twist or bend your back from a seated position.
- Reference
Baker, j. K. (2012, October 18). The association between children’s computer use and musculoskeletal discomfort. Work The Association between Children’s Computer Use and Musculoskeletal Discomfort. The association between children’s computer use and musculoskeletal discomfort. Work The Association between Children’s Computer Use and Musculoskeletal Discomfort, 221-226. Retrieved from http://web.a.ebs.
Bakerb, K. J. (2002). The association between children’s computer use and musculoskeletal discomfort. 221-226.
Bao.S, H. S. (2007). Two posture analysis approaches and their application in a modified Rapid Upper Limb Assessment evaluation. Ergonomics. 2118-2136.
Belanger, B. H. (2011). A U-Shaped Association Between Intensity of Internet Use and Adolescent Health. Pediatrics.
Breen.R, P. R. (2007). An investigation of children’s posture and discomfort during computer use. Ergonomics. 1582-1592.
C., D. G. (2005). Ergonomic methods for assessing exposure to risk factors for work-related musculoskeletal disorders. Occupational Medicine, 190–199.
Ciccarelli, C. V. (2015). Managing children’s postural risk when using mobile technology at home: Challenges and strategies. Applied Ergonomics, 189-198.
Ciccarelli. M, S. M. (2013). Variation in Muscle Activity Among Office Workers When Using Different Information Technologies at Work and Away From Work. Human Factors. The Journal of the Human Factors and Ergonomics society, 911-923.
Coyle, A. (2005). Comparison of the Rapid Entire Body Assessment and the New Zealand Manual Handling ‘Hazard Control Record’, for assessment of manual handling hazards in the supermarket industry. 111-116.
Er. Surinder Singh, E. A. (2013). A Proposed REBA on Small Scale Forging Industry. International Journal of Modern Engineering Research (IJMER), 3796-3802.
Gerr, F. ,. (2004). Epidemiology of musculoskeletal disorders among computer users: Lesson learned from the role of posture and keyboard use. Journal of Electromyography and Kinesiology, 25-31.
Grimes. P, &. L. (2004). Musculoskeletal Disorders (MSD) in School Students as a Risk Factor for Adult MSD: A Review of the Multiple Factors Affecting Posture, Comfort and Health in Classroom Environments. Journal of the Human-Environment System JHES, 1-9.
Harris. C, &. S. (2000). Survey of physical ergonomics wassues associated with school childrens’ use of laptop computers. International Journal of Industrial Ergonomics, 337-346.
Harris.C, &. S. (2000). Survey of physical ergonomics wassues associated with school children’s’ use of laptop computers. International Journal of Industrial Ergonomics, 337-346.
Janice D. Chen, ,. T. (2014). Impact of experience when using the Rapid Upper Limb Assessment to assess postural risk in children using information and communication technologies. Applied Ergonomics, 398-405.
Karwowski, D. K. (2007). A Comparison of Three Observational Techniques for Assessing Postural Loads in Industry. International Journal of Occupational Safety and Ergonomics, 3-14.
Kimmerly L, O. D. (2009). Children and computer use in the home: workstations, behaviors and parental attitudes. 299-310.
Marina Ciccarelli, L. S. (2011). ITKids Part II: Variation of postures and muscle activity in children using different information and communication technologies. 413-427.
Marina Ciccarellia, L. S. (2011). ITKids Part I:Children’s occupations and use of information and communication technologies. 401-412.
N. A. Ansari, D. M. (2014). Evaluation of work Posture by REBA and REBA: A Case Study. IOSR Journal of Mechanical and Civil Engineering (IOSR-JMCE), 18-23.
N. J. DELLEMAN, J. D. (2007). International standards on working postures and movements wasO 1126 and EN 1005-4. 1809-1819.
Paula T. Hakala, A. H. (2006). Frequent computer-related activities increase the risk of neck–shoulder and low back pain in adolescents. European Journal of Public Health, 536-541.
Pope-Ford, R. &. (2015). Neck and shoulder muscle activation patterns among dentists during common dental procedures. 391-399.
Pope-Ford, R. D. (2013). Assessment of Neck and Shoulder Muscle Coactivations and the Effect on the Musculoskeletal. (Doctoral dissertation), Greensboro, North Carolina.
Pope-Ford, R. D. (2016). Mobile Technology. Peoria.
Sara Dockrell, E. O. (2012). An investigation of the reliability of Rapid Upper Limb Assessment (REBA). Applied Ergonomics, 632-636.
Sue Hignett, L. M. (2000). Rapid Entire Body Assessment (REBA). Applied Ergonomics, 201-205.
Syazwan Aizat wasmail, S. B. (2009). The Association between Ergonomic Risk Factors, REBA Score, and Musculoskeletal Pain among School Children: A Preliminary Result. 73-84.
Tayyari, F. &. (2015). Occupational ergonomics: Principles and applications. . Boston: Kluwer Academic.
- Appendix A
Design of Trials prepared for the experiment
The sequence of the trials was designed to be random. Here P# represents participant number; Posture represents their seating platform/station (Sofa, Chair and Floor), Device represents the ICT device in use.
| P# | Posture | Device | Posture Legend | |
| P#1 | SF | PHONE | SC | Sit in Chair |
| P#1 | SS | TAB | SS | Sit on Sofa |
| P#1 | SC | PHONE | SF | Sit on Floor |
| P#1 | SS | TAB | PC | Participant choice |
| P#1 | SF | TAB | ||
| P#1 | SC | TAB | ||
| P#1 | SS | PHONE | ||
| P#1 | SC | TAB | ||
| P#1 | SF | TAB | ||
| P#1 | SC | TAB | ||
| P#1 | SS | TAB | ||
| P#1 | SC | TAB | ||
| P#1 | SF | TAB | ||
| P#1 | SF | TAB | ||
| P#1 | SS | TAB | ||
| P#1 | PC/SS | PHONE | ||
| P#1 | PC/SS | TAB | ||
- Appendix B
Data for participants using phone
The REBA scores for all participants using phone at all positions was tabulated as shown below. One-Way ANOVA was conducted with a specific test of Fisher pairwise comparison.
Table 15 Position/Station vs REBA score for phone
| POSITION | PHONE_REBA |
| SF | 7 |
| SC | 9 |
| SS | 11 |
| SF | 9 |
| SC | 11 |
| SS | 10 |
| SF | 10 |
| SC | 10 |
| SS | 11 |
| SF | 10 |
| SC | 11 |
| SS | 11 |
| SF | 7 |
| SC | 10 |
| SS | 11 |
| SF | 9 |
| SC | 10 |
| SS | 10 |
| SF | 8 |
| SC | 10 |
| SS | 10 |
| SF | 6 |
| SC | 9 |
| SS | 6 |
| SF | 8 |
| SC | 10 |
| SS | 9 |
Note: The data was fed into Minitab using the one column for the position/station and the other column for Phone-REBA score.
- Appendix C
One- Way ANOVA test for participants using phone
After the data’s input was complete, the One-Way ANOVA was selected the Minitab.
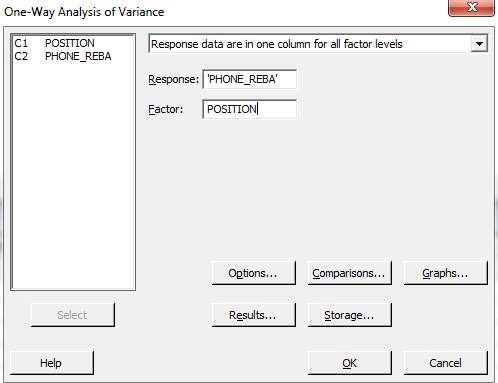
Figure 10 One-Way ANOVA for Phone REBA scores, Minitab 17 Statistical Software (2010). [Computer software]. State College, PA: Minitab, Inc. (www.minitab.com)
Fisher’s Pairwise comparison test for phone
After selecting the factors, the comparison was to be selected; the confidence interval for this device was 85%.
Table 16 Factor Information for phone
| Factor | Levels | Values |
| POSITION | 3 | SC, SF, SS |
Note: The factor in this was considered to be the position or the station of seating that was SS, SC and SF as three levels.
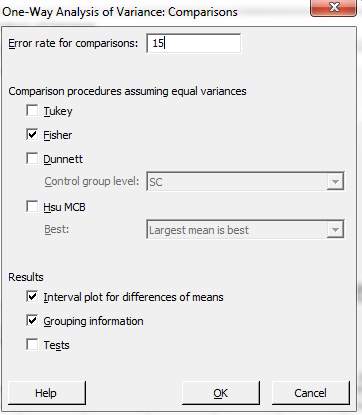
Figure 11 Fisher’s LSD with 85% confidence, Minitab 17 Statistical Software (2010). [Computer software]. State College, PA: Minitab, Inc. (www.minitab.com)
Difference of means for participants using phone
Table 17 Means summary for phone
| POSITION | N | Mean | St.Dev | 85% CI |
| SC | 9 | 10 | 0.707 | (9.356, 10.644) |
| SF | 9 | 8.222 | 1.394 | (7.579, 8.866) |
| SS | 9 | 9.889 | 1.616 | (9.245, 10.532) |
Note: This table indicates that the mean values of the Phone-REBA score for the factors being SC, SC and SF are different.
- Appendix D
ANOVA for participants using Table
The data was actually fed into Minitab in the form of two columns containing all the values of positions and REBA in each. However for an easy and better representation the columns are divided into three parts.
Table 18 Posture (SS, SC and SF) vs REBA score
| Posture | TAB-REBA | Posture | TAB-REBA | Posture | TAB-REBA |
| SS | 10 | SC | 9 | SF | 7 |
| SS | 7 | SC | 11 | SF | 6 |
| SS | 11 | SC | 10 | SF | 5 |
| SS | 7 | SC | 11 | SF | 9 |
| SS | 7 | SC | 8 | SF | 7 |
| SS | 11 | SC | 11 | SF | 9 |
| SS | 9 | SC | 10 | SF | 7 |
| SS | 10 | SC | 10 | SF | 11 |
| SS | 11 | SC | 10 | SF | 9 |
| SS | 11 | SC | 11 | SF | 7 |
| SS | 10 | SC | 10 | SF | 10 |
| SS | 8 | SC | 10 | SF | 9 |
| SS | 11 | SC | 8 | SF | 7 |
| SS | 6 | SC | 11 | SF | 9 |
| SS | 10 | SC | 11 | SF | 7 |
| SS | 11 | SC | 11 | SF | 10 |
| SS | 11 | SC | 11 | SF | 10 |
| SS | 11 | SC | 11 | SF | 10 |
| SS | 11 | SC | 11 | SF | 10 |
| SS | 11 | SC | 11 | SF | 10 |
| SS | 11 | SC | 10 | SF | 7 |
| SS | 11 | SC | 9 | SF | 8 |
| SS | 11 | SC | 9 | SF | 9 |
| SS | 10 | SC | 11 | SF | 10 |
| SS | 11 | SC | 11 | SF | 6 |
| SS | 11 | SC | 10 | SF | 9 |
| SS | 10 | SC | 11 | SF | 10 |
| SS | 10 | SC | 8 | SF | 10 |
| SS | 9 | SC | 11 | SF | 7 |
| SS | 11 | SC | 10 | SF | 9 |
| SS | 11 | SC | 10 | SF | 8 |
| SS | 10 | SC | 10 | SF | 10 |
| SS | 10 | SC | 10 | SF | 10 |
| SS | 11 | SC | 11 | SF | 10 |
| SS | 10 | SC | 10 | SF | 11 |
| SS | 6 | SC | 9 | SF | 6 |
| SS | 9 | SC | 8 | SF | 8 |
| SS | 6 | SC | 8 | SF | 8 |
| SS | 6 | SC | 8 | SF | 8 |
| SS | 6 | SC | 9 | SF | 8 |
| SS | 10 | SC | 10 | SF | 8 |
| SS | 9 | SC | 9 | SF | 8 |
| SS | 9 | SC | 10 | SF | 6 |
| SS | 10 | SC | 8 | SF | 7 |
| SS | 10 | SC | 11 | SF | 7 |
Factor Information for Tablet: This represents all the factors that influence the response REBA score.
One- Way ANOVA for Tablet
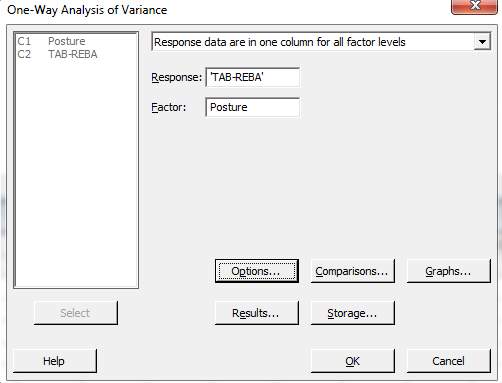
Figure 14 One-Way ANOVA for TAB-REBA scores, Minitab 17 Statistical Software (2010). [Computer software]. State College, PA: Minitab, Inc. (www.minitab.com)
Fisher’s Pairwise comparison test
After selecting the factors the comparison was conducted with the confidence interval for this device was 85%.
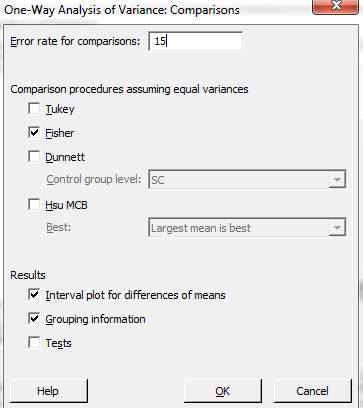
Figure 15 Fisher’s LSD with 85% confidence, Minitab 17 Statistical Software (2010). [Computer software]. State College, PA: Minitab, Inc. (www.minitab.com)
Factor Information: This represents all the factors that influence the response REBA score.
Table 19 Factor Information
| Factor | Levels | Values |
| Posture | 3 | SC, SF, SS |
Note: The factor in this was considered to be the position or the station of seating that was SS, SC and SF as three levels.
Difference of means for Tab
Table 20 Means summary for Tab-REBA scores
| Posture | N | Mean | StDev | 85% CI |
| SC | 45 | 9.933 | 1.074 | (9.619, 10.248) |
| SF | 45 | 8.378 | 1.527 | (8.063, 8.692) |
| SS | 45 | 9.600 | 1.698 | (9.286, 9.914) |
Note: This table indicates that the mean values of the TAB-REBA score for the factors being SC, SC and SF are different.
- Appendix E
Participant Choice
Data is fed into Minitab in the following sequence:
Table 21 Posture (PC/SC, PC/SF, PC/SF (LAY), and PC/SS) vs PC-REBA
| Posture | PC-REBA SCORE |
| PC/SS | 9 |
| PC/SS | 9 |
| PC/SS | 10 |
| PC/SS | 10 |
| PC/SF | 6 |
| PC/SF | 6 |
| PC/SS | 12 |
| PC/SS | 9 |
| PC/SF(LAY) | 10 |
| PC/SF(LAY) | 10 |
| PC/SS | 12 |
| PC/SS | 9 |
| PC/SF(LAY) | 10 |
| PC/SF(LAY) | 7 |
| PC/SC | 11 |
| PC/SC | 10 |
| PC/SS | 9 |
| PC/SS | 7 |
ANOVA for participant’s choice
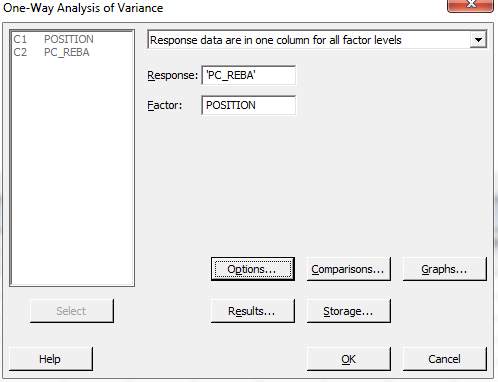
Figure 18 One-Way ANOVA for PC-REBA scores, Minitab 17 Statistical Software (2010). [Computer software]. State College, PA: Minitab, Inc. (www.minitab.com)
Fisher’s Pairwise comparison test
After selecting the factors the comparison was conducted with the confidence interval for this device was 85%.
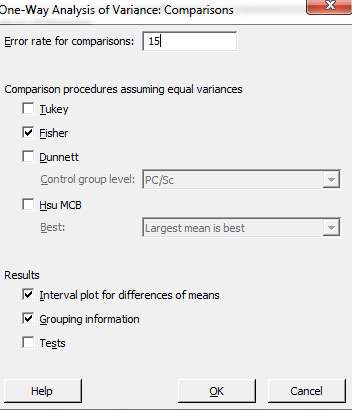
Figure 19 Fishers LSD with 85% confidence, Minitab 17 Statistical Software (2010). [Computer software]. State College, PA: Minitab, Inc. (www.minitab.com)
Table 22 Factor Information
| Factor | Levels | Values |
| POSITION | 4 | PC/SC, PC/SF, PC/SF(LAY), PC/SS |
Note: The factor in this was considered to be the position or the station of seating that was PC/SC, PC/SF, PC/SF (LAY) and PC/SS as four levels.
Table 23 Means summary for PC-REBA scores
| position | n | mean | stdev | 85% ci |
| PC/SC | 2 | 10.500 | 0.707 | (8.986, 12.014) |
| PC/SF | 2 | 6.000 | 0.000 | (4.486, 7.514) |
| PC/SF(LAY) | 4 | 9.250 | 1.500 | (8.180, 10.320) |
| PC/SS | 10 | 9.600 | 1.506 | (8.923, 10.277) |
Note: This table indicates that the mean values of the PC-REBA score for the factors being PC/SC, PC/SF, PC/SF (LAY) and PC/SS are different.
- Appendix F
Two sample T-Test for individual pairs (SS-SC, SS-SF, SC-SF) for phone
The data was fed into Minitab with postures as column names and REBA scores column entries.
Table 24 Two sample T-Test for (SS-SC, SS-SF, SC-SF) vs Phone-REBA
| SS | SC | SF |
| 11 | 9 | 7 |
| 10 | 11 | 9 |
| 11 | 10 | 10 |
| 11 | 11 | 10 |
| 11 | 10 | 7 |
| 10 | 10 | 9 |
| 10 | 10 | 8 |
| 6 | 9 | 6 |
| 9 | 10 | 8 |
Two-Sample T-Test and CI: SF, SC for phone:
Table 25 Two-Sample T-Test and CI: (SF, SC)
| Position | N | Mean | StDev | SE Mean |
| SF | 9 | 8.22 | 1.39 | 0.46 |
| SC | 9 | 10.000 | 0.707 | 0.24 |
Two-Sample T-Test and CI: SS, SC for phone
Table 26 Two-Sample T-Test and CI: SS, SC
| Position | N | Mean | StDev | SE Mean |
| SS | 9 | 9.89 | 1.62 | 0.54 |
| SC | 9 | 10.000 | 0.707 | 0.24 |
Two-Sample T-Test and CI: SS, SF for phone
Table 27 Two-sample T for SS vs SF
| Position | N | Mean | StDev | SE Mean |
| SS | 9 | 9.89 | 1.62 | 0.54 |
| SF | 9 | 8.22 | 1.39 | 0.46 |
- Appendix G
Two sample T-test for Tablet:
Table 28 Two-Sample T-Test and CI: SF, SC (TAB)
| SS | SC | SF |
| 10 | 9 | 7 |
| 7 | 11 | 6 |
| 11 | 10 | 5 |
| 7 | 11 | 9 |
| 7 | 8 | 7 |
| 11 | 11 | 9 |
| 9 | 10 | 7 |
| 10 | 10 | 11 |
| 11 | 10 | 9 |
| 11 | 11 | 7 |
| 10 | 10 | 10 |
| 8 | 10 | 9 |
| 11 | 8 | 7 |
| 6 | 11 | 9 |
| 10 | 11 | 7 |
| 11 | 11 | 10 |
| 11 | 11 | 10 |
| 11 | 11 | 10 |
| 11 | 11 | 10 |
| 11 | 11 | 10 |
| 11 | 10 | 7 |
| 11 | 9 | 8 |
| 11 | 9 | 9 |
| 10 | 11 | 10 |
| 11 | 11 | 6 |
| 11 | 10 | 9 |
| 10 | 11 | 10 |
| 10 | 8 | 10 |
| 9 | 11 | 7 |
| 11 | 10 | 9 |
| 11 | 10 | 8 |
| 10 | 10 | 10 |
| 10 | 10 | 10 |
| 11 | 11 | 10 |
| 10 | 10 | 11 |
| 6 | 9 | 6 |
| 9 | 8 | 8 |
| 6 | 8 | 8 |
| 6 | 8 | 8 |
| 6 | 9 | 8 |
| 10 | 10 | 8 |
| 9 | 9 | 8 |
| 9 | 10 | 6 |
| 10 | 8 | 7 |
| 10 | 11 | 7 |
Two-Sample T-Test and CI: SF, SC
Table 29 Two-sample T for SF vs SC
| Position | N | Mean | StDev | SE Mean |
| SF | 45 | 8.38 | 1.53 | 0.23 |
| SC | 45 | 9.93 | 1.07 | 0.16 |
Two-Sample T-Test and CI: SS, SC
Table 30 Two-sample T for SS vs SC
| Position | N | Mean | StDev | SE Mean |
| SS | 45 | 9.60 | 1.70 | 0.25 |
| SC | 45 | 9.93 | 1.07 | 0.16 |
Two-Sample T-Test and CI: SS, SF
Table 31 Two-sample T for SS vs SF
| Position | N | Mean | StDev | SE Mean |
| SS | 45 | 9.60 | 1.70 | 0.25 |
| SF | 45 | 8.38 | 1.53 | 0.23 |
- Appendix H
Data collection participant wise for Tablet
Participant number one
Data including neck, trunk, legs, score A, upper arm, lower arm, and wrist, score B, coupling score, activity score and Final REBA score.
| p#1 | posture | device | neck | trunk | legs | score A | upper arm | lower arm | wrist | score B | coupling score | activity score | REBA score |
| p#1 | SF | PHONE | 2 | 3 | 2 | 5 | 2 | 2 | 2 | 4 | 1 | 2 | 7 |
| p#1 | SS | TAB | 1 | 3 | 4 | 6 | 3 | 2 | 1 | 5 | 1 | 2 | 10 |
| p#1 | SC | PHONE | 1 | 2 | 4 | 5 | 3 | 2 | 2 | 6 | 1 | 2 | 9 |
| p#1 | SS | TAB | 1 | 2 | 4 | 5 | 2 | 2 | 2 | 4 | 1 | 2 | 7 |
| p#1 | SF | TAB | 2 | 3 | 1 | 4 | 2 | 2 | 1 | 3 | 1 | 2 | 6 |
| p#1 | SC | TAB | 2 | 3 | 4 | 6 | 4 | 2 | 2 | 7 | 1 | 2 | 11 |
| p#1 | SS | PHONE | 2 | 3 | 4 | 7 | 3 | 2 | 1 | 5 | 1 | 2 | 11 |
| p#1 | SC | TAB | 2 | 2 | 4 | 6 | 3 | 2 | 1 | 5 | 1 | 2 | 10 |
| p#1 | SF | TAB | 1 | 2 | 2 | 3 | 2 | 2 | 2 | 4 | 1 | 2 | 5 |
| p#1 | SC | TAB | 2 | 3 | 4 | 7 | 4 | 2 | 2 | 7 | 1 | 2 | 11 |
| p#1 | SS | TAB | 1 | 2 | 4 | 5 | 2 | 2 | 2 | 4 | 1 | 2 | 7 |
| p#1 | SC | TAB | 1 | 2 | 4 | 5 | 3 | 2 | 1 | 5 | 1 | 2 | 8 |
| p#1 | SF | TAB | 2 | 3 | 2 | 5 | 3 | 2 | 2 | 6 | 1 | 2 | 9 |
| p#1 | SF | TAB | 2 | 2 | 3 | 5 | 2 | 2 | 2 | 4 | 1 | 2 | 7 |
| p#1 | SS | TAB | 1 | 2 | 4 | 5 | 2 | 2 | 2 | 4 | 1 | 2 | 7 |
| p#1 | PC/SS | PHONE | 2 | 2 | 4 | 4 | 2 | 2 | 2 | 4 | 1 | 2 | 9 |
| p#1 | PC/SS | TAB | 1 | 2 | 4 | 5 | 3 | 2 | 2 | 6 | 1 | 2 | 9 |
| variables | neck | trunk | legs | score a | upper arm | lower arm | wrist | score b | coupling score | activity score | REBA score | ||
| mean | 2 | 2 | 3 | 5 | 3 | 2 | 2 | 5 | 1 | 2 | 8 | ||
- Appendix I
participant number two
Data including neck, trunk, legs, score A, upper arm, lower arm, and wrist, score B, coupling score, activity score and Final REBA score.
| p#2 | POSTURE | device | neck | trunk | legs | score A | upper arm | lower arm | wrist | score B | coupling score | activity score | REBA score |
| p#2 | SF | Phone | 2 | 2 | 3 | 5 | 3 | 2 | 2 | 6 | 1 | 2 | 9 |
| p#2 | SS | Tab | 2 | 3 | 4 | 7 | 3 | 2 | 1 | 5 | 1 | 2 | 11 |
| p#2 | SC | Phone | 2 | 3 | 4 | 7 | 3 | 2 | 2 | 6 | 1 | 2 | 11 |
| p#2 | SS | Tab | 2 | 3 | 3 | 6 | 2 | 2 | 2 | 4 | 1 | 2 | 9 |
| p#2 | SF | Tab | 2 | 2 | 3 | 5 | 2 | 2 | 2 | 4 | 1 | 2 | 7 |
| p#2 | SC | Tab | 2 | 3 | 4 | 6 | 3 | 2 | 2 | 6 | 1 | 2 | 10 |
| p#2 | SS | Phone | 2 | 3 | 4 | 7 | 2 | 2 | 2 | 4 | 1 | 2 | 10 |
| p#2 | SC | Tab | 3 | 2 | 4 | 7 | 2 | 2 | 2 | 4 | 1 | 2 | 10 |
| p#2 | SF | Tab | 2 | 3 | 4 | 7 | 3 | 2 | 1 | 5 | 1 | 2 | 11 |
| p#2 | SC | Tab | 2 | 2 | 4 | 6 | 3 | 2 | 2 | 6 | 1 | 2 | 10 |
| p#2 | SS | Tab | 2 | 3 | 4 | 7 | 3 | 2 | 2 | 6 | 1 | 2 | 11 |
| p#2 | SC | Tab | 2 | 2 | 4 | 7 | 3 | 2 | 2 | 6 | 1 | 2 | 11 |
| p#2 | SF | Tab | 2 | 2 | 3 | 5 | 3 | 2 | 2 | 6 | 1 | 2 | 9 |
| p#2 | SF | Tab | 2 | 2 | 3 | 5 | 2 | 2 | 2 | 4 | 1 | 2 | 7 |
| p#2 | SS | Tab | 3 | 2 | 4 | 7 | 3 | 2 | 2 | 6 | 1 | 2 | 11 |
| p#2 | PC/SS | Phone | 2 | 2 | 4 | 6 | 3 | 2 | 2 | 6 | 1 | 2 | 10 |
| p#2 | PC/SS | Tab | 2 | 2 | 4 | 6 | 3 | 2 | 2 | 6 | 1 | 2 | 10 |
| Variables | neck | trunk | legs | score A | upper arm | lower arm | wrist | score B | coupling score | activity score | REBA score | ||
| mean | 2 | 2 | 4 | 6 | 3 | 2 | 2 | 5 | 1 | 2 | 10 | ||
- Appendix J
Participant number three
Data including neck, trunk, legs, score A, upper arm, lower arm, and wrist, score B, coupling score, activity score and Final REBA score.
| p#3 | posture | device | neck | trunk | legs | score A | upper arm | lower arm | wrist | score B | coupling score | activity score | REBA score |
| p#3 | SF | Phone | 2 | 3 | 3 | 6 | 3 | 2 | 2 | 6 | 1 | 2 | 10 |
| p#3 | SS | Tab | 2 | 2 | 4 | 6 | 3 | 2 | 2 | 6 | 1 | 2 | 10 |
| p#3 | SC | Phone | 2 | 2 | 4 | 6 | 3 | 2 | 2 | 6 | 1 | 2 | 10 |
| p#3 | SS | Tab | 2 | 1 | 4 | 4 | 3 | 2 | 2 | 6 | 1 | 2 | 8 |
| p#3 | SF | Tab | 2 | 3 | 3 | 6 | 2 | 2 | 2 | 4 | 1 | 2 | 9 |
| p#3 | SC | Tab | 2 | 2 | 4 | 6 | 3 | 2 | 1 | 6 | 1 | 2 | 10 |
| p#3 | SS | Phone | 3 | 2 | 4 | 7 | 3 | 2 | 2 | 6 | 1 | 2 | 11 |
| p#3 | SC | Tab | 2 | 1 | 4 | 4 | 3 | 2 | 2 | 6 | 1 | 2 | 8 |
| p#3 | SF | Tab | 2 | 2 | 3 | 5 | 2 | 2 | 2 | 4 | 1 | 2 | 7 |
| p#3 | SC | Tab | 2 | 3 | 4 | 7 | 3 | 2 | 2 | 6 | 1 | 2 | 11 |
| p#3 | SS | Tab | 1 | 2 | 4 | 4 | 2 | 2 | 2 | 4 | 1 | 2 | 6 |
| p#3 | SC | Tab | 2 | 3 | 4 | 7 | 3 | 2 | 2 | 6 | 1 | 2 | 11 |
| p#3 | SF | Tab | 1 | 2 | 3 | 5 | 3 | 2 | 2 | 6 | 1 | 2 | 9 |
| p#3 | SF | Tab | 2 | 2 | 3 | 5 | 2 | 2 | 2 | 4 | 1 | 2 | 7 |
| p#3 | SS | Tab | 2 | 2 | 4 | 6 | 3 | 2 | 2 | 6 | 1 | 2 | 10 |
| p#3 | PC/SF | Phone | 1 | 2 | 3 | 5 | 2 | 1 | 1 | 3 | 1 | 2 | 6 |
| p#3 | PC/SF | Tab | 1 | 2 | 3 | 5 | 2 | 1 | 1 | 2 | 1 | 2 | 6 |
| variables | neck | trunk | legs | score A | upper arm | lower arm | wrist | score B | coupling score | activity score | REBA score | ||
| mean | 2 | 2 | 4 | 6 | 3 | 2 | 2 | 5 | 1 | 2 | 9 | ||
- Appendix K
Participant number four
Data including neck, trunk, legs, score A, upper arm, lower arm, and wrist, score B, coupling score, activity score and Final REBA score.
| p#3 | posture | device | neck | trunk | legs | score A | upper arm | lower arm | wrist | score B | coupling score | activity score | REBA score |
| p#3 | SF | Phone | 2 | 3 | 3 | 6 | 3 | 2 | 2 | 6 | 1 | 2 | 10 |
| p#3 | SS | Tab | 2 | 2 | 4 | 6 | 3 | 2 | 2 | 6 | 1 | 2 | 10 |
| p#3 | SC | Phone | 2 | 2 | 4 | 6 | 3 | 2 | 2 | 6 | 1 | 2 | 10 |
| p#3 | SS | Tab | 2 | 1 | 4 | 4 | 3 | 2 | 2 | 6 | 1 | 2 | 8 |
| p#3 | SF | Tab | 2 | 3 | 3 | 6 | 2 | 2 | 2 | 4 | 1 | 2 | 9 |
| p#3 | SC | Tab | 2 | 2 | 4 | 6 | 3 | 2 | 1 | 6 | 1 | 2 | 10 |
| p#3 | SS | Phone | 3 | 2 | 4 | 7 | 3 | 2 | 2 | 6 | 1 | 2 | 11 |
| p#3 | SC | Tab | 2 | 1 | 4 | 4 | 3 | 2 | 2 | 6 | 1 | 2 | 8 |
| p#3 | SF | Tab | 2 | 2 | 3 | 5 | 2 | 2 | 2 | 4 | 1 | 2 | 7 |
| p#3 | SC | Tab | 2 | 3 | 4 | 7 | 3 | 2 | 2 | 6 | 1 | 2 | 11 |
| p#3 | SS | Tab | 1 | 2 | 4 | 4 | 2 | 2 | 2 | 4 | 1 | 2 | 6 |
| p#3 | SC | Tab | 2 | 3 | 4 | 7 | 3 | 2 | 2 | 6 | 1 | 2 | 11 |
| p#3 | SF | Tab | 1 | 2 | 3 | 5 | 3 | 2 | 2 | 6 | 1 | 2 | 9 |
| p#3 | SF | Tab | 2 | 2 | 3 | 5 | 2 | 2 | 2 | 4 | 1 | 2 | 7 |
| p#3 | SS | Tab | 2 | 2 | 4 | 6 | 3 | 2 | 2 | 6 | 1 | 2 | 10 |
| p#3 | PC/SF | Phone | 1 | 2 | 3 | 5 | 2 | 1 | 1 | 3 | 1 | 2 | 6 |
| p#3 | PC/SF | Tab | 1 | 2 | 3 | 5 | 2 | 1 | 1 | 2 | 1 | 2 | 6 |
| Variables | neck | trunk | legs | score a | upper arm | lower arm | wrist | score b | coupling score | activity score | REBA score | ||
| mean | 2 | 2 | 4 | 6 | 3 | 2 | 2 | 5 | 1 | 2 | 9 | ||
- Appendix L
Participant number five
Data including neck, trunk, legs, score A, upper arm, lower arm, and wrist, score B, coupling score, activity score and Final REBA score.
| p#4 | posture | device | neck | trunk | legs | score a | upper arm | lower arm | wrist | score b | coupling score | activity score | REBA score |
| p#4 | SF | Phone | 2 | 3 | 3 | 6 | 3 | 2 | 2 | 6 | 1 | 2 | 10 |
| p#4 | SS | Tab | 2 | 3 | 4 | 7 | 3 | 2 | 2 | 6 | 1 | 2 | 11 |
| p#4 | SC | Phone | 2 | 3 | 4 | 7 | 3 | 2 | 2 | 6 | 1 | 2 | 11 |
| p#4 | SS | Tab | 2 | 3 | 4 | 7 | 3 | 2 | 2 | 6 | 1 | 2 | 11 |
| p#4 | SF | Tab | 2 | 3 | 3 | 6 | 3 | 2 | 2 | 6 | 1 | 2 | 10 |
| p#4 | SC | Tab | 2 | 3 | 4 | 7 | 3 | 2 | 2 | 6 | 1 | 2 | 11 |
| p#4 | SS | Phone | 2 | 3 | 4 | 7 | 3 | 2 | 2 | 6 | 1 | 2 | 11 |
| p#4 | SC | Tab | 2 | 3 | 4 | 7 | 3 | 2 | 2 | 6 | 1 | 2 | 11 |
| p#4 | SF | Tab | 2 | 3 | 3 | 6 | 3 | 2 | 2 | 6 | 1 | 2 | 10 |
| p#4 | SC | Tab | 2 | 3 | 4 | 7 | 3 | 2 | 2 | 6 | 1 | 2 | 11 |
| p#4 | SS | Tab | 2 | 3 | 4 | 7 | 3 | 2 | 2 | 6 | 1 | 2 | 11 |
| p#4 | SC | Tab | 2 | 3 | 4 | 7 | 3 | 2 | 2 | 6 | 1 | 2 | 11 |
| p#4 | SF | Tab | 2 | 3 | 3 | 6 | 3 | 2 | 2 | 6 | 1 | 2 | 10 |
| p#4 | SF | Tab | 2 | 3 | 3 | 6 | 3 | 2 | 2 | 6 | 1 | 2 | 10 |
| p#4 | SS | Tab | 2 | 3 | 4 | 7 | 3 | 2 | 2 | 6 | 1 | 2 | 11 |
| p#4 | PC/SS | Phone | 2 | 4 | 4 | 8 | 3 | 2 | 2 | 6 | 1 | 2 | 12 |
| p#4 | PC/SS | Tab | 2 | 3 | 3 | 6 | 2 | 2 | 2 | 4 | 1 | 2 | 9 |
| Variables | neck | trunk | legs | score a | upper arm | lower arm | wrist | score b | coupling score | activity score | REBA score | ||
| mean | 2 | 3 | 4 | 7 | 3 | 2 | 2 | 6 | 1 | 2 | 11 | ||
- Appendix M
Participant number six
Data including neck, trunk, legs, score A, upper arm, lower arm, and wrist, score B, coupling score, activity score and Final REBA score.
| p#6 | posture | device | neck | trunk | legs | score A | upper arm | lower arm | wrist | score B | coupling score | activity score | REBA score |
| p#6 | SF | PHONE | 2 | 3 | 3 | 6 | 2 | 2 | 2 | 4 | 1 | 2 | 9 |
| p#6 | SS | TAB | 2 | 3 | 4 | 7 | 3 | 2 | 2 | 6 | 1 | 2 | 11 |
| p#6 | SC | PHONE | 2 | 2 | 4 | 6 | 3 | 2 | 2 | 6 | 1 | 2 | 10 |
| p#6 | SS | TAB | 2 | 2 | 4 | 6 | 3 | 2 | 2 | 6 | 1 | 2 | 10 |
| p#6 | SF | TAB | 2 | 4 | 3 | 7 | 2 | 2 | 2 | 4 | 1 | 2 | 10 |
| p#6 | SC | TAB | 2 | 3 | 4 | 7 | 3 | 2 | 2 | 6 | 1 | 2 | 11 |
| p#6 | SS | PHONE | 2 | 3 | 4 | 7 | 2 | 2 | 2 | 4 | 1 | 2 | 10 |
| p#6 | SC | TAB | 1 | 1 | 4 | 4 | 3 | 2 | 2 | 6 | 1 | 2 | 8 |
| p#6 | SF | TAB | 2 | 4 | 3 | 7 | 2 | 2 | 2 | 4 | 1 | 2 | 10 |
| p#6 | SC | TAB | 2 | 4 | 4 | 7 | 3 | 2 | 2 | 6 | 1 | 2 | 11 |
| p#6 | SS | TAB | 2 | 2 | 4 | 6 | 2 | 2 | 2 | 4 | 1 | 2 | 9 |
| p#6 | SC | TAB | 2 | 2 | 4 | 6 | 3 | 2 | 2 | 6 | 1 | 2 | 10 |
| p#6 | SF | TAB | 2 | 3 | 3 | 5 | 2 | 2 | 2 | 4 | 1 | 2 | 7 |
| p#6 | SF | TAB | 2 | 3 | 3 | 6 | 2 | 2 | 2 | 4 | 1 | 2 | 9 |
| p#6 | SS | TAB | 2 | 3 | 4 | 7 | 3 | 2 | 2 | 6 | 1 | 2 | 11 |
| p#6 | PC/SS | PHONE | 2 | 3 | 4 | 8 | 3 | 2 | 2 | 6 | 1 | 2 | 12 |
| p#6 | PC/SS | TAB | 1 | 2 | 4 | 5 | 3 | 2 | 2 | 6 | 1 | 2 | 9 |
| Variables | neck | trunk | legs | score A | upper arm | lower arm | wrist | score B | coupling score | activity score | REBA score | ||
| mean | 2 | 3 | 4 | 6 | 3 | 2 | 2 | 5 | 1 | 2 | 10 | ||
- Appendix N
Participant number seven
Data including neck, trunk, legs, score A, upper arm, lower arm, and wrist, score B, coupling score, activity score and Final REBA score
| p#7 | posture | device | neck | trunk | legs | score A | upper arm | lower arm | wrist | score B | coupling score | activity score | REBA score |
| p#7 | SF | PHONE | 2 | 3 | 3 | 6 | 1 | 2 | 2 | 3 | 1 | 2 | 8 |
| p#7 | SS | TAB | 2 | 3 | 4 | 7 | 3 | 2 | 2 | 6 | 1 | 2 | 11 |
| p#7 | SC | PHONE | 2 | 2 | 4 | 6 | 3 | 2 | 2 | 6 | 1 | 2 | 10 |
| p#7 | SS | TAB | 2 | 2 | 4 | 6 | 3 | 2 | 2 | 6 | 1 | 2 | 10 |
| p#7 | SF | TAB | 2 | 3 | 3 | 6 | 3 | 2 | 2 | 6 | 1 | 2 | 10 |
| p#7 | SC | TAB | 2 | 2 | 4 | 6 | 3 | 2 | 2 | 6 | 1 | 2 | 10 |
| p#7 | SS | PHONE | 2 | 2 | 4 | 6 | 3 | 2 | 2 | 6 | 1 | 2 | 10 |
| p#7 | SC | TAB | 2 | 2 | 4 | 6 | 3 | 2 | 2 | 6 | 1 | 2 | 10 |
| p#7 | SF | TAB | 2 | 3 | 3 | 6 | 3 | 2 | 2 | 6 | 1 | 2 | 10 |
| p#7 | SC | TAB | 2 | 3 | 4 | 7 | 3 | 2 | 2 | 6 | 1 | 2 | 11 |
| p#7 | SS | TAB | 2 | 3 | 4 | 7 | 3 | 2 | 2 | 6 | 1 | 2 | 11 |
| p#7 | SC | TAB | 2 | 2 | 4 | 6 | 3 | 2 | 2 | 6 | 1 | 2 | 10 |
| p#7 | SF | TAB | 2 | 3 | 3 | 6 | 3 | 2 | 2 | 6 | 1 | 2 | 10 |
| p#7 | SF | TAB | 2 | 4 | 3 | 7 | 3 | 2 | 2 | 6 | 1 | 2 | 11 |
| p#7 | SS | TAB | 2 | 3 | 4 | 7 | 2 | 2 | 2 | 4 | 1 | 2 | 10 |
| p#7 | PC/SF(L) | PHONE | 2 | 3 | 4 | 7 | 2 | 2 | 2 | 4 | 1 | 2 | 10 |
| p#7 | PC/SF(L) | TAB | 2 | 4 | 1 | 3 | 3 | 2 | 2 | 6 | 1 | 2 | 7 |
| Variables | neck | trunk | legs | score A | upper arm | lower arm | wrist | score B | coupling score | activity score | REBA score | ||
| mean | 2 | 3 | 4 | 6 | 3 | 2 | 2 | 6 | 1 | 2 | 10 | ||
- Appendix O
Participant number eight
Data including neck, trunk, legs, score A, upper arm, lower arm, and wrist, score B, coupling score, activity score and Final REBA score
| p#8 | posture | device | neck | trunk | legs | score A | upper arm | lower arm | wrist | score B | coupling score | activity score | REBA score |
| p#8 | SF | PHONE | 1 | 2 | 3 | 4 | 2 | 2 | 2 | 4 | 1 | 2 | 6 |
| p#8 | SS | TAB | 1 | 2 | 4 | 5 | 1 | 2 | 2 | 3 | 1 | 2 | 6 |
| p#8 | SC | PHONE | 1 | 2 | 4 | 5 | 3 | 2 | 2 | 6 | 1 | 2 | 9 |
| p#8 | SS | TAB | 2 | 2 | 4 | 6 | 2 | 2 | 2 | 4 | 1 | 2 | 9 |
| p#8 | SF | TAB | 1 | 2 | 3 | 4 | 3 | 2 | 2 | 6 | 1 | 2 | 8 |
| p#8 | SC | TAB | 1 | 1 | 4 | 4 | 3 | 2 | 2 | 6 | 1 | 2 | 8 |
| p#8 | SS | PHONE | 1 | 2 | 4 | 5 | 1 | 2 | 2 | 3 | 1 | 2 | 6 |
| p#8 | SC | TAB | 1 | 1 | 4 | 4 | 3 | 2 | 2 | 6 | 1 | 2 | 8 |
| p#8 | SF | TAB | 1 | 2 | 3 | 4 | 3 | 2 | 2 | 6 | 1 | 2 | 8 |
| p#8 | SC | TAB | 1 | 1 | 4 | 4 | 3 | 2 | 2 | 6 | 1 | 2 | 8 |
| p#8 | SS | TAB | 1 | 2 | 4 | 5 | 1 | 1 | 2 | 3 | 1 | 2 | 6 |
| p#8 | SC | TAB | 1 | 2 | 4 | 5 | 3 | 2 | 2 | 6 | 1 | 2 | 9 |
| p#8 | SF | TAB | 1 | 2 | 3 | 4 | 3 | 2 | 2 | 6 | 1 | 2 | 8 |
| p#8 | SF | TAB | 1 | 2 | 3 | 4 | 3 | 2 | 2 | 6 | 1 | 2 | 8 |
| p#8 | SS | TAB | 1 | 2 | 4 | 5 | 1 | 1 | 2 | 3 | 1 | 2 | 6 |
| p#8 | PC/SC | PHONE | 2 | 2 | 4 | 6 | 4 | 2 | 2 | 7 | 1 | 2 | 11 |
| p#8 | PC/SC | TAB | 2 | 2 | 4 | 6 | 3 | 2 | 2 | 6 | 1 | 2 | 10 |
| Variables | neck | trunk | legs | score A | upper arm | lower arm | wrist | score B | coupling score | activity score | REBA score | ||
| mean | 1 | 2 | 4 | 5 | 2 | 2 | 2 | 5 | 1 | 2 | 8 | ||
- Appendix P
Participant number nine
Data including neck, trunk, legs, score A, upper arm, lower arm, and wrist, score B, coupling score, activity score and Final REBA score
| p#9 | posture | device | neck | trunk | legs | score A | upper arm | lower arm | wrist | score B | coupling score | activity score | REBA score |
| p#9 | SF | PHONE | 1 | 2 | 3 | 4 | 3 | 2 | 2 | 6 | 1 | 2 | 8 |
| p#9 | SS | TAB | 1 | 3 | 4 | 6 | 3 | 2 | 2 | 6 | 1 | 2 | 10 |
| p#9 | SC | PHONE | 2 | 2 | 4 | 6 | 3 | 2 | 2 | 6 | 1 | 2 | 10 |
| p#9 | SS | TAB | 2 | 3 | 4 | 6 | 2 | 2 | 2 | 4 | 1 | 2 | 9 |
| p#9 | SF | TAB | 1 | 2 | 3 | 4 | 3 | 2 | 2 | 6 | 1 | 2 | 8 |
| p#9 | SC | TAB | 1 | 2 | 4 | 5 | 3 | 2 | 2 | 6 | 1 | 2 | 9 |
| p#9 | SS | PHONE | 1 | 2 | 4 | 5 | 3 | 2 | 2 | 6 | 1 | 2 | 9 |
| p#9 | SC | TAB | 2 | 2 | 4 | 6 | 3 | 2 | 2 | 6 | 1 | 2 | 10 |
| p#9 | SF | TAB | 1 | 2 | 3 | 4 | 2 | 2 | 2 | 4 | 1 | 2 | 6 |
| p#9 | SC | TAB | 2 | 3 | 4 | 6 | 1 | 2 | 2 | 3 | 1 | 2 | 8 |
| p#9 | SS | TAB | 1 | 3 | 4 | 6 | 3 | 2 | 2 | 6 | 1 | 2 | 10 |
| p#9 | SC | TAB | 2 | 3 | 4 | 7 | 3 | 2 | 2 | 6 | 1 | 2 | 11 |
| p#9 | SF | TAB | 2 | 2 | 3 | 5 | 2 | 2 | 2 | 4 | 1 | 2 | 7 |
| p#9 | SF | TAB | 2 | 2 | 3 | 5 | 2 | 2 | 2 | 4 | 1 | 2 | 7 |
| p#9 | SS | TAB | 2 | 2 | 4 | 6 | 3 | 2 | 2 | 6 | 1 | 2 | 10 |
| p#9 | PC/SS | PHONE | 1 | 2 | 4 | 5 | 3 | 2 | 2 | 6 | 1 | 2 | 9 |
| p#9 | PC/SS | TAB | 1 | 2 | 4 | 5 | 2 | 2 | 2 | 4 | 1 | 2 | 7 |
| Variables | neck | trunk | legs | score A | upper arm | lower arm | wrist | score B | coupling score | activity score | REBA score | ||
| mean | 1 | 2 | 4 | 5 | 3 | 2 | 2 | 5 | 1 | 2 | 9 | ||
- Appendix Q
Platform/Station wise arrangement of the data collected
SS (Sitting on the sofa)
| p#1 | posture | device | neck | trunk | legs | score A | upper arm | lower arm | wrist | score B | coupling score | activity score | REBA score |
| p#1 | SS | TAB | 1 | 3 | 4 | 6 | 3 | 2 | 1 | 5 | 1 | 2 | 10 |
| p#1 | SS | TAB | 1 | 2 | 4 | 5 | 2 | 2 | 2 | 4 | 1 | 2 | 7 |
| p#1 | SS | PHONE | 2 | 3 | 4 | 7 | 3 | 2 | 1 | 5 | 1 | 2 | 11 |
| p#1 | SS | TAB | 1 | 2 | 4 | 5 | 2 | 2 | 2 | 4 | 1 | 2 | 7 |
| p#1 | SS | TAB | 1 | 2 | 4 | 5 | 2 | 2 | 2 | 4 | 1 | 2 | 7 |
| p#2 | SS | TAB | 2 | 3 | 4 | 7 | 3 | 2 | 1 | 5 | 1 | 2 | 11 |
| p#2 | SS | TAB | 2 | 3 | 3 | 6 | 2 | 2 | 2 | 4 | 1 | 2 | 9 |
| p#2 | SS | PHONE | 2 | 3 | 4 | 7 | 2 | 2 | 2 | 4 | 1 | 2 | 10 |
| p#2 | SS | TAB | 2 | 3 | 4 | 7 | 3 | 2 | 2 | 6 | 1 | 2 | 11 |
| p#2 | SS | TAB | 3 | 2 | 4 | 7 | 3 | 2 | 2 | 6 | 1 | 2 | 11 |
| p#3 | SS | TAB | 2 | 2 | 4 | 6 | 3 | 2 | 2 | 6 | 1 | 2 | 10 |
| p#3 | SS | TAB | 2 | 1 | 4 | 4 | 3 | 2 | 2 | 6 | 1 | 2 | 8 |
| p#3 | SS | PHONE | 3 | 2 | 4 | 7 | 3 | 2 | 2 | 6 | 1 | 2 | 11 |
| p#3 | SS | TAB | 1 | 2 | 4 | 4 | 2 | 2 | 2 | 4 | 1 | 2 | 6 |
| p#3 | SS | TAB | 2 | 2 | 4 | 6 | 3 | 2 | 2 | 6 | 1 | 2 | 10 |
| p#4 | SS | TAB | 2 | 3 | 4 | 7 | 3 | 2 | 2 | 6 | 1 | 2 | 11 |
| p#4 | SS | TAB | 2 | 3 | 4 | 7 | 3 | 2 | 2 | 6 | 1 | 2 | 11 |
| p#4 | SS | PHONE | 2 | 3 | 4 | 7 | 3 | 2 | 2 | 6 | 1 | 2 | 11 |
| p#4 | SS | TAB | 2 | 3 | 4 | 7 | 3 | 2 | 2 | 6 | 1 | 2 | 11 |
| p#4 | SS | TAB | 2 | 3 | 4 | 7 | 3 | 2 | 2 | 6 | 1 | 2 | 11 |
| p#5 | SS | TAB | 2 | 3 | 4 | 7 | 3 | 2 | 2 | 6 | 1 | 2 | 11 |
| p#5 | SS | TAB | 2 | 3 | 4 | 7 | 3 | 2 | 2 | 6 | 1 | 2 | 11 |
| p#5 | SS | PHONE | 2 | 3 | 4 | 7 | 3 | 2 | 2 | 6 | 1 | 2 | 11 |
| p#5 | SS | TAB | 2 | 2 | 4 | 6 | 3 | 2 | 2 | 6 | 1 | 2 | 10 |
| p#5 | SS | TAB | 2 | 3 | 4 | 7 | 3 | 2 | 2 | 6 | 1 | 2 | 11 |
| p#6 | SS | TAB | 2 | 3 | 4 | 7 | 3 | 2 | 2 | 6 | 1 | 2 | 11 |
| p#6 | SS | TAB | 2 | 2 | 4 | 6 | 3 | 2 | 2 | 6 | 1 | 2 | 10 |
| p#6 | SS | PHONE | 2 | 3 | 4 | 7 | 2 | 2 | 2 | 4 | 1 | 2 | 10 |
| p#6 | SS | TAB | 2 | 2 | 4 | 6 | 2 | 2 | 2 | 4 | 1 | 2 | 9 |
| p#6 | SS | TAB | 2 | 3 | 4 | 7 | 3 | 2 | 2 | 6 | 1 | 2 | 11 |
| p#7 | SS | TAB | 2 | 3 | 4 | 7 | 3 | 2 | 2 | 6 | 1 | 2 | 11 |
| p#7 | SS | TAB | 2 | 2 | 4 | 6 | 3 | 2 | 2 | 6 | 1 | 2 | 10 |
| p#7 | SS | PHONE | 2 | 2 | 4 | 6 | 3 | 2 | 2 | 6 | 1 | 2 | 10 |
| p#7 | SS | TAB | 2 | 3 | 4 | 7 | 3 | 2 | 2 | 6 | 1 | 2 | 11 |
| p#7 | SS | TAB | 2 | 3 | 4 | 7 | 2 | 2 | 2 | 4 | 1 | 2 | 10 |
| p#8 | SS | TAB | 1 | 2 | 4 | 5 | 1 | 2 | 2 | 3 | 1 | 2 | 6 |
| p#8 | SS | TAB | 2 | 2 | 4 | 6 | 2 | 2 | 2 | 4 | 1 | 2 | 9 |
| p#8 | SS | PHONE | 1 | 2 | 4 | 5 | 1 | 2 | 2 | 3 | 1 | 2 | 6 |
| p#8 | SS | TAB | 1 | 2 | 4 | 5 | 1 | 1 | 2 | 3 | 1 | 2 | 6 |
| p#8 | SS | TAB | 1 | 2 | 4 | 5 | 1 | 1 | 2 | 3 | 1 | 2 | 6 |
| p#9 | SS | TAB | 1 | 3 | 4 | 6 | 3 | 2 | 2 | 6 | 1 | 2 | 10 |
| p#9 | SS | TAB | 2 | 3 | 4 | 6 | 2 | 2 | 2 | 4 | 1 | 2 | 9 |
| p#9 | SS | PHONE | 1 | 2 | 4 | 5 | 3 | 2 | 2 | 6 | 1 | 2 | 9 |
| p#9 | SS | TAB | 1 | 3 | 4 | 6 | 3 | 2 | 2 | 6 | 1 | 2 | 10 |
| p#9 | SS | TAB | 2 | 2 | 4 | 6 | 3 | 2 | 2 | 6 | 1 | 2 | 10 |
| Variables | neck | trunk | legs | score A | upper arm | lower arm | wrist | score B | coupling score | activity score | REBA score | ||
| mean | 2 | 3 | 4.0 | 6 | 2.6 | 2 | 2 | 5 | 1 | 2 | 10 | ||
- Appendix Q
SC (Sitting on the Chair)
| p#1 | posture | device | neck | trunk | legs | score A | upper arm | lower arm | wrist | score B | coupling score | activity score | REBA score |
| p#1 | SC | PHONE | 1 | 2 | 4 | 5 | 3 | 2 | 2 | 6 | 1 | 2 | 9 |
| p#1 | SC | TAB | 2 | 3 | 4 | 6 | 4 | 2 | 2 | 7 | 1 | 2 | 11 |
| p#1 | SC | TAB | 2 | 2 | 4 | 6 | 3 | 2 | 1 | 5 | 1 | 2 | 10 |
| p#1 | SC | TAB | 2 | 3 | 4 | 7 | 4 | 2 | 2 | 7 | 1 | 2 | 11 |
| p#1 | SC | TAB | 1 | 2 | 4 | 5 | 3 | 2 | 1 | 5 | 1 | 2 | 8 |
| p#2 | SC | PHONE | 2 | 3 | 4 | 7 | 3 | 2 | 2 | 6 | 1 | 2 | 11 |
| p#2 | SC | TAB | 2 | 3 | 4 | 6 | 3 | 2 | 2 | 6 | 1 | 2 | 10 |
| p#2 | SC | TAB | 3 | 2 | 4 | 7 | 2 | 2 | 2 | 4 | 1 | 2 | 10 |
| p#2 | SC | TAB | 2 | 2 | 4 | 6 | 3 | 2 | 2 | 6 | 1 | 2 | 10 |
| p#2 | SC | TAB | 2 | 2 | 4 | 7 | 3 | 2 | 2 | 6 | 1 | 2 | 11 |
| p#3 | SC | PHONE | 2 | 2 | 4 | 6 | 3 | 2 | 2 | 6 | 1 | 2 | 10 |
| p#3 | SC | TAB | 2 | 2 | 4 | 6 | 3 | 2 | 1 | 6 | 1 | 2 | 10 |
| p#3 | SC | TAB | 2 | 1 | 4 | 4 | 3 | 2 | 2 | 6 | 1 | 2 | 8 |
| p#3 | SC | TAB | 2 | 3 | 4 | 7 | 3 | 2 | 2 | 6 | 1 | 2 | 11 |
| p#3 | SC | TAB | 2 | 3 | 4 | 7 | 3 | 2 | 2 | 6 | 1 | 2 | 11 |
| p#4 | SC | PHONE | 2 | 3 | 4 | 7 | 3 | 2 | 2 | 6 | 1 | 2 | 11 |
| p#4 | SC | TAB | 2 | 3 | 4 | 7 | 3 | 2 | 2 | 6 | 1 | 2 | 11 |
| p#4 | SC | TAB | 2 | 3 | 4 | 7 | 3 | 2 | 2 | 6 | 1 | 2 | 11 |
| p#4 | SC | TAB | 2 | 3 | 4 | 7 | 3 | 2 | 2 | 6 | 1 | 2 | 11 |
| p#4 | SC | TAB | 2 | 3 | 4 | 7 | 3 | 2 | 2 | 6 | 1 | 2 | 11 |
| p#5 | SC | PHONE | 1 | 3 | 4 | 6 | 3 | 2 | 2 | 6 | 1 | 2 | 10 |
| p#5 | SC | TAB | 1 | 2 | 4 | 5 | 3 | 2 | 2 | 6 | 1 | 2 | 9 |
| p#5 | SC | TAB | 1 | 2 | 4 | 5 | 3 | 2 | 2 | 6 | 1 | 2 | 9 |
| p#5 | SC | TAB | 2 | 3 | 4 | 7 | 3 | 2 | 2 | 6 | 1 | 2 | 11 |
| p#5 | SC | TAB | 2 | 3 | 4 | 7 | 3 | 2 | 2 | 6 | 1 | 2 | 11 |
| p#6 | SC | PHONE | 2 | 2 | 4 | 6 | 3 | 2 | 2 | 6 | 1 | 2 | 10 |
| p#6 | SC | TAB | 2 | 3 | 4 | 7 | 3 | 2 | 2 | 6 | 1 | 2 | 11 |
| p#6 | SC | TAB | 1 | 1 | 4 | 4 | 3 | 2 | 2 | 6 | 1 | 2 | 8 |
| p#6 | SC | TAB | 2 | 4 | 4 | 7 | 3 | 2 | 2 | 6 | 1 | 2 | 11 |
| p#6 | SC | TAB | 2 | 2 | 4 | 6 | 3 | 2 | 2 | 6 | 1 | 2 | 10 |
| p#7 | SC | PHONE | 2 | 2 | 4 | 6 | 3 | 2 | 2 | 6 | 1 | 2 | 10 |
| p#7 | SC | TAB | 2 | 2 | 4 | 6 | 3 | 2 | 2 | 6 | 1 | 2 | 10 |
| p#7 | SC | TAB | 2 | 2 | 4 | 6 | 3 | 2 | 2 | 6 | 1 | 2 | 10 |
| p#7 | SC | TAB | 2 | 3 | 4 | 7 | 3 | 2 | 2 | 6 | 1 | 2 | 11 |
| p#7 | SC | TAB | 2 | 2 | 4 | 6 | 3 | 2 | 2 | 6 | 1 | 2 | 10 |
| p#8 | SC | PHONE | 1 | 2 | 4 | 5 | 3 | 2 | 2 | 6 | 1 | 2 | 9 |
| p#8 | SC | TAB | 1 | 1 | 4 | 4 | 3 | 2 | 2 | 6 | 1 | 2 | 8 |
| p#8 | SC | TAB | 1 | 1 | 4 | 4 | 3 | 2 | 2 | 6 | 1 | 2 | 8 |
| p#8 | SC | TAB | 1 | 1 | 4 | 4 | 3 | 2 | 2 | 6 | 1 | 2 | 8 |
| p#8 | SC | TAB | 1 | 2 | 4 | 5 | 3 | 2 | 2 | 6 | 1 | 2 | 9 |
| p#9 | SC | PHONE | 2 | 2 | 4 | 6 | 3 | 2 | 2 | 6 | 1 | 2 | 10 |
| p#9 | SC | TAB | 1 | 2 | 4 | 5 | 3 | 2 | 2 | 6 | 1 | 2 | 9 |
| p#9 | SC | TAB | 2 | 2 | 4 | 6 | 3 | 2 | 2 | 6 | 1 | 2 | 10 |
| p#9 | SC | TAB | 2 | 3 | 4 | 6 | 1 | 2 | 2 | 3 | 1 | 2 | 8 |
| p#9 | SC | TAB | 2 | 3 | 4 | 7 | 3 | 2 | 2 | 6 | 1 | 2 | 11 |
| Variables | neck | trunk | legs | score A | upper arm | lower arm | wrist | score B | coupling score | activity score | REBA score | ||
| mean | 2 | 2 | 4 | 6 | 3 | 2.0 | 2 | 6 | 1.0 | 2 | 10 | ||
- Appendix R
SF (Sitting on the Floor)
| p#1 | posture | device | neck | trunk | legs | score A | upper arm | lower arm | wrist | score B | coupling score | activity score | REBA score |
| p#1 | SF | PHONE | 2 | 3 | 2 | 5 | 2 | 2 | 2 | 4 | 1 | 2 | 7 |
| p#1 | SF | TAB | 2 | 3 | 1 | 4 | 2 | 2 | 1 | 3 | 1 | 2 | 6 |
| p#1 | SF | TAB | 1 | 2 | 2 | 3 | 2 | 2 | 2 | 4 | 1 | 2 | 5 |
| p#1 | SF | TAB | 2 | 3 | 2 | 5 | 3 | 2 | 2 | 6 | 1 | 2 | 9 |
| p#1 | SF | TAB | 2 | 2 | 3 | 5 | 2 | 2 | 2 | 4 | 1 | 2 | 7 |
| p#2 | SF | PHONE | 2 | 2 | 3 | 5 | 3 | 2 | 2 | 6 | 1 | 2 | 9 |
| p#2 | SF | TAB | 2 | 2 | 3 | 5 | 2 | 2 | 2 | 4 | 1 | 2 | 7 |
| p#2 | SF | TAB | 2 | 3 | 4 | 7 | 3 | 2 | 1 | 5 | 1 | 2 | 11 |
| p#2 | SF | TAB | 2 | 2 | 3 | 5 | 3 | 2 | 2 | 6 | 1 | 2 | 9 |
| p#2 | SF | TAB | 2 | 2 | 3 | 5 | 2 | 2 | 2 | 4 | 1 | 2 | 7 |
| p#3 | SF | PHONE | 2 | 3 | 3 | 6 | 3 | 2 | 2 | 6 | 1 | 2 | 10 |
| p#3 | SF | TAB | 2 | 3 | 3 | 6 | 2 | 2 | 2 | 4 | 1 | 2 | 9 |
| p#3 | SF | TAB | 2 | 2 | 3 | 5 | 2 | 2 | 2 | 4 | 1 | 2 | 7 |
| p#3 | SF | TAB | 1 | 2 | 3 | 5 | 3 | 2 | 2 | 6 | 1 | 2 | 9 |
| p#3 | SF | TAB | 2 | 2 | 3 | 5 | 2 | 2 | 2 | 4 | 1 | 2 | 7 |
| p#4 | SF | PHONE | 2 | 3 | 3 | 6 | 3 | 2 | 2 | 6 | 1 | 2 | 10 |
| p#4 | SF | TAB | 2 | 3 | 3 | 6 | 3 | 2 | 2 | 6 | 1 | 2 | 10 |
| p#4 | SF | TAB | 2 | 3 | 3 | 6 | 3 | 2 | 2 | 6 | 1 | 2 | 10 |
| p#4 | SF | TAB | 2 | 3 | 3 | 6 | 3 | 2 | 2 | 6 | 1 | 2 | 10 |
| p#4 | SF | TAB | 2 | 3 | 3 | 6 | 3 | 2 | 2 | 6 | 1 | 2 | 10 |
| p#5 | SF(LAY) | PHONE | 2 | 4 | 1 | 3 | 3 | 2 | 2 | 6 | 1 | 2 | 7 |
| p#5 | SF | TAB | 1 | 2 | 3 | 4 | 3 | 2 | 2 | 6 | 1 | 2 | 8 |
| p#5 | SF | TAB | 2 | 2 | 3 | 5 | 3 | 2 | 2 | 6 | 1 | 2 | 9 |
| p#5 | SF | TAB | 2 | 3 | 3 | 6 | 3 | 2 | 2 | 6 | 1 | 2 | 10 |
| p#5 | SF | TAB | 1 | 2 | 3 | 4 | 2 | 2 | 2 | 4 | 1 | 2 | 6 |
| p#6 | SF | PHONE | 2 | 3 | 3 | 6 | 2 | 2 | 2 | 4 | 1 | 2 | 9 |
| p#6 | SF | TAB | 2 | 4 | 3 | 7 | 2 | 2 | 2 | 4 | 1 | 2 | 10 |
| p#6 | SF | TAB | 2 | 4 | 3 | 7 | 2 | 2 | 2 | 4 | 1 | 2 | 10 |
| p#6 | SF | TAB | 2 | 3 | 3 | 5 | 2 | 2 | 2 | 4 | 1 | 2 | 7 |
| p#6 | SF | TAB | 2 | 3 | 3 | 6 | 2 | 2 | 2 | 4 | 1 | 2 | 9 |
| p#7 | SF | PHONE | 2 | 3 | 3 | 6 | 1 | 2 | 2 | 3 | 1 | 2 | 8 |
| p#7 | SF | TAB | 2 | 3 | 3 | 6 | 3 | 2 | 2 | 6 | 1 | 2 | 10 |
| p#7 | SF | TAB | 2 | 3 | 3 | 6 | 3 | 2 | 2 | 6 | 1 | 2 | 10 |
| p#7 | SF | TAB | 2 | 3 | 3 | 6 | 3 | 2 | 2 | 6 | 1 | 2 | 10 |
| p#7 | SF | TAB | 2 | 4 | 3 | 7 | 3 | 2 | 2 | 6 | 1 | 2 | 11 |
| p#8 | SF | PHONE | 1 | 2 | 3 | 4 | 2 | 2 | 2 | 4 | 1 | 2 | 6 |
| p#8 | SF | TAB | 1 | 2 | 3 | 4 | 3 | 2 | 2 | 6 | 1 | 2 | 8 |
| p#8 | SF | TAB | 1 | 2 | 3 | 4 | 3 | 2 | 2 | 6 | 1 | 2 | 8 |
| p#8 | SF | TAB | 1 | 2 | 3 | 4 | 3 | 2 | 2 | 6 | 1 | 2 | 8 |
| p#8 | SF | TAB | 1 | 2 | 3 | 4 | 3 | 2 | 2 | 6 | 1 | 2 | 8 |
| p#9 | SF | PHONE | 1 | 2 | 3 | 4 | 3 | 2 | 2 | 6 | 1 | 2 | 8 |
| p#9 | SF | TAB | 1 | 2 | 3 | 4 | 3 | 2 | 2 | 6 | 1 | 2 | 8 |
| p#9 | SF | TAB | 1 | 2 | 3 | 4 | 2 | 2 | 2 | 4 | 1 | 2 | 6 |
| p#9 | SF | TAB | 2 | 2 | 3 | 5 | 2 | 2 | 2 | 4 | 1 | 2 | 7 |
| p#9 | SF | TAB | 2 | 2 | 3 | 5 | 2 | 2 | 2 | 4 | 1 | 2 | 7 |
| Variables | neck | trunk | legs | score A | upper arm | lower arm | wrist | score B | coupling score | activity score | REBA score | ||
| mean | 2 | 3 | 3 | 5 | 3 | 2 | 2 | 5 | 1 | 2 | 8 | ||
- Appendix S
Data collection participant wise for phone
All participants in a single column
Data including neck, trunk, legs, score A, upper arm, lower arm, and wrist, score B, coupling score, activity score and Final REBA score.
| p#1 | posture | device | neck | trunk | legs | score A | upper arm | lower arm | wrist | score B | coupling score | activity score | REBA score |
| p#1 | SF | PHONE | 2 | 3 | 2 | 5 | 2 | 2 | 2 | 4 | 1 | 2 | 7 |
| p#1 | SC | PHONE | 1 | 2 | 4 | 5 | 3 | 2 | 2 | 6 | 1 | 2 | 9 |
| p#1 | SS | PHONE | 2 | 3 | 4 | 7 | 3 | 2 | 1 | 5 | 1 | 2 | 11 |
| p#1 | PC/SS | PHONE | 2 | 2 | 4 | 4 | 2 | 2 | 2 | 4 | 1 | 2 | 9 |
| p#2 | SF | PHONE | 2 | 2 | 3 | 5 | 3 | 2 | 2 | 6 | 1 | 2 | 9 |
| p#2 | SC | PHONE | 2 | 3 | 4 | 7 | 3 | 2 | 2 | 6 | 1 | 2 | 11 |
| p#2 | SS | PHONE | 2 | 3 | 4 | 7 | 2 | 2 | 2 | 4 | 1 | 2 | 10 |
| p#2 | PC/SS | PHONE | 2 | 2 | 4 | 6 | 3 | 2 | 2 | 6 | 1 | 2 | 10 |
| p#3 | SF | PHONE | 2 | 3 | 3 | 6 | 3 | 2 | 2 | 6 | 1 | 2 | 10 |
| p#3 | SC | PHONE | 2 | 2 | 4 | 6 | 3 | 2 | 2 | 6 | 1 | 2 | 10 |
| p#3 | SS | PHONE | 3 | 2 | 4 | 7 | 3 | 2 | 2 | 6 | 1 | 2 | 11 |
| p#3 | PC/SF | PHONE | 1 | 2 | 3 | 5 | 2 | 1 | 1 | 3 | 1 | 2 | 6 |
| p#4 | SF | PHONE | 2 | 3 | 3 | 6 | 3 | 2 | 2 | 6 | 1 | 2 | 10 |
| p#4 | SC | PHONE | 2 | 3 | 4 | 7 | 3 | 2 | 2 | 6 | 1 | 2 | 11 |
| p#4 | SS | PHONE | 2 | 3 | 4 | 7 | 3 | 2 | 2 | 6 | 1 | 2 | 11 |
| p#4 | PC/SS | PHONE | 2 | 4 | 4 | 8 | 3 | 2 | 2 | 6 | 1 | 2 | 12 |
| p#5 | SF(LAY) | PHONE | 2 | 4 | 1 | 3 | 3 | 2 | 2 | 6 | 1 | 2 | 7 |
| p#5 | SC | PHONE | 1 | 3 | 4 | 6 | 3 | 2 | 2 | 6 | 1 | 2 | 10 |
| p#5 | SS | PHONE | 2 | 3 | 4 | 7 | 3 | 2 | 2 | 6 | 1 | 2 | 11 |
| p#5 | PC/SF(LAY) | PHONE | 1 | 4 | 3 | 6 | 3 | 2 | 2 | 6 | 1 | 2 | 10 |
| p#6 | SF | PHONE | 2 | 3 | 3 | 6 | 2 | 2 | 2 | 4 | 1 | 2 | 9 |
| p#6 | SC | PHONE | 2 | 2 | 4 | 6 | 3 | 2 | 2 | 6 | 1 | 2 | 10 |
| p#6 | SS | PHONE | 2 | 3 | 4 | 7 | 2 | 2 | 2 | 4 | 1 | 2 | 10 |
| p#6 | PC/SS | PHONE | 2 | 3 | 4 | 8 | 3 | 2 | 2 | 6 | 1 | 2 | 12 |
| p#7 | SF | PHONE | 2 | 3 | 3 | 6 | 1 | 2 | 2 | 3 | 1 | 2 | 8 |
| p#7 | SC | PHONE | 2 | 2 | 4 | 6 | 3 | 2 | 2 | 6 | 1 | 2 | 10 |
| p#7 | SS | PHONE | 2 | 2 | 4 | 6 | 3 | 2 | 2 | 6 | 1 | 2 | 10 |
| p#7 | PC/SF(L) | PHONE | 2 | 3 | 4 | 7 | 2 | 2 | 2 | 4 | 1 | 2 | 10 |
| p#8 | SF | PHONE | 1 | 2 | 3 | 4 | 2 | 2 | 2 | 4 | 1 | 2 | 6 |
| p#8 | SC | PHONE | 1 | 2 | 4 | 5 | 3 | 2 | 2 | 6 | 1 | 2 | 9 |
| p#8 | SS | PHONE | 1 | 2 | 4 | 5 | 1 | 2 | 2 | 3 | 1 | 2 | 6 |
| p#8 | PC/SC | PHONE | 2 | 2 | 4 | 6 | 4 | 2 | 2 | 7 | 1 | 2 | 11 |
| p#9 | SF | PHONE | 1 | 2 | 3 | 4 | 3 | 2 | 2 | 6 | 1 | 2 | 8 |
| p#9 | SC | PHONE | 2 | 2 | 4 | 6 | 3 | 2 | 2 | 6 | 1 | 2 | 10 |
| p#9 | SS | PHONE | 1 | 2 | 4 | 5 | 3 | 2 | 2 | 6 | 1 | 2 | 9 |
| p#9 | PC/SS | PHONE | 1 | 2 | 4 | 5 | 3 | 2 | 2 | 6 | 1 | 2 | 9 |
| variables | neck | trunk | legs | score A | upper arm | lower arm | wrist | score B | coupling score | activity score | REBA score | ||
| mean | 2 | 3 | 4 | 6 | 3 | 2 | 2 | 5 | 1 | 2 | 10 | ||
- Appendix T
Data collection participant wise for phone
All data points for phone being used on sofa (SS)
Data including neck, trunk, legs, score A, upper arm, lower arm, and wrist, score B, coupling score, activity score and Final REBA score.
| p#1 | posture | device | neck | trunk | legs | score A | upper arm | lower arm | wrist | score B | coupling score | activity score | REBA score |
| p#1 | SS | PHONE | 2 | 3 | 4 | 7 | 3 | 2 | 1 | 5 | 1 | 2 | 11 |
| p#2 | SS | PHONE | 2 | 3 | 4 | 7 | 2 | 2 | 2 | 4 | 1 | 2 | 10 |
| p#3 | SS | PHONE | 3 | 2 | 4 | 7 | 3 | 2 | 2 | 6 | 1 | 2 | 11 |
| p#4 | SS | PHONE | 2 | 3 | 4 | 7 | 3 | 2 | 2 | 6 | 1 | 2 | 11 |
| p#5 | SS | PHONE | 2 | 3 | 4 | 7 | 3 | 2 | 2 | 6 | 1 | 2 | 11 |
| p#6 | SS | PHONE | 2 | 3 | 4 | 7 | 2 | 2 | 2 | 4 | 1 | 2 | 10 |
| p#7 | SS | PHONE | 2 | 2 | 4 | 6 | 3 | 2 | 2 | 6 | 1 | 2 | 10 |
| p#8 | SS | PHONE | 1 | 2 | 4 | 5 | 1 | 2 | 2 | 3 | 1 | 2 | 6 |
| p#9 | SS | PHONE | 1 | 2 | 4 | 5 | 3 | 2 | 2 | 6 | 1 | 2 | 9 |
| variables | neck | trunk | legs | score A | upper arm | lower arm | wrist | score B | coupling score | activity score | REBA score | ||
| mean | 2 | 3 | 4 | 6 | 3 | 2 | 2 | 5 | 1 | 2 | 10 | ||
- Appendix U
All data points for phone being used on Chair (SC)
Data including neck, trunk, legs, score A, upper arm, lower arm, and wrist, score B, coupling score, activity score and Final REBA score.
| p#1 | posture | device | neck | trunk | legs | score A | upper arm | lower arm | wrist | score B | coupling score | activity score | REBA score |
| p#1 | SC | PHONE | 1 | 2 | 4 | 5 | 3 | 2 | 2 | 6 | 1 | 2 | 9 |
| p#2 | SC | PHONE | 2 | 3 | 4 | 7 | 3 | 2 | 2 | 6 | 1 | 2 | 11 |
| p#3 | SC | PHONE | 2 | 2 | 4 | 6 | 3 | 2 | 2 | 6 | 1 | 2 | 10 |
| p#4 | SC | PHONE | 2 | 3 | 4 | 7 | 3 | 2 | 2 | 6 | 1 | 2 | 11 |
| p#5 | SC | PHONE | 1 | 3 | 4 | 6 | 3 | 2 | 2 | 6 | 1 | 2 | 10 |
| p#6 | SC | PHONE | 2 | 2 | 4 | 6 | 3 | 2 | 2 | 6 | 1 | 2 | 10 |
| p#7 | SC | PHONE | 2 | 2 | 4 | 6 | 3 | 2 | 2 | 6 | 1 | 2 | 10 |
| p#8 | SC | PHONE | 1 | 2 | 4 | 5 | 3 | 2 | 2 | 6 | 1 | 2 | 9 |
| p#9 | SC | PHONE | 2 | 2 | 4 | 6 | 3 | 2 | 2 | 6 | 1 | 2 | 10 |
| variables | neck | trunk | legs | score A | upper arm | lower arm | wrist | score B | coupling score | activity score | REBA score | ||
| mean | 2 | 2 | 4 | 6 | 3 | 2 | 2 | 6 | 1 | 2 | 10 | ||
- Appendix V
All data points for phone being used on Floor (SF)
Data including neck, trunk, legs, score A, upper arm, lower arm, and wrist, score B, coupling score, activity score and Final REBA score.
| p#1 | posture | device | neck | trunk | legs | score A | upper arm | lower arm | wrist | score B | coupling score | activity score | REBA score |
| p#1 | SF | PHONE | 2 | 3 | 2 | 5 | 2 | 2 | 2 | 4 | 1 | 2 | 7 |
| p#2 | SF | PHONE | 2 | 2 | 3 | 5 | 3 | 2 | 2 | 6 | 1 | 2 | 9 |
| p#3 | SF | PHONE | 2 | 3 | 3 | 6 | 3 | 2 | 2 | 6 | 1 | 2 | 10 |
| p#4 | SF | PHONE | 2 | 3 | 3 | 6 | 3 | 2 | 2 | 6 | 1 | 2 | 10 |
| p#6 | SF | PHONE | 2 | 3 | 3 | 6 | 2 | 2 | 2 | 4 | 1 | 2 | 9 |
| p#7 | SF | PHONE | 2 | 3 | 3 | 6 | 1 | 2 | 2 | 3 | 1 | 2 | 8 |
| p#8 | SF | PHONE | 1 | 2 | 3 | 4 | 2 | 2 | 2 | 4 | 1 | 2 | 6 |
| p#9 | SF | PHONE | 1 | 2 | 3 | 4 | 3 | 2 | 2 | 6 | 1 | 2 | 8 |
| variables | neck | trunk | legs | score A | upper arm | lower arm | wrist | score B | coupling score | activity score | REBA
score |
||
| mean | 2 | 3 | 3 | 5 | 2 | 2 | 2 | 5 | 1 | 2 | 8 | ||
- Appendix W
All data points for participant choice (PC)with phone
Data including neck, trunk, legs, score A, upper arm, lower arm, and wrist, score B, coupling score, activity score and Final REBA score.
| p#1 | posture | device | neck | trunk | legs | score A | upper arm | lower arm | wrist | score B | coupling score | activity score | REBA
score |
| p#1 | PC/SS | PHONE | 2 | 2 | 4 | 4 | 2 | 2 | 2 | 4 | 1 | 2 | 9 |
| p#2 | PC/SS | PHONE | 2 | 2 | 4 | 6 | 3 | 2 | 2 | 6 | 1 | 2 | 10 |
| p#3 | PC/SF | PHONE | 1 | 2 | 3 | 5 | 2 | 1 | 1 | 3 | 1 | 2 | 6 |
| p#4 | PC/SS | PHONE | 2 | 4 | 4 | 8 | 3 | 2 | 2 | 6 | 1 | 2 | 12 |
| p#5 | SF(LAY) | PHONE | 2 | 4 | 1 | 3 | 3 | 2 | 2 | 6 | 1 | 2 | 7 |
| p#5 | PC/SF(LAY) | PHONE | 1 | 4 | 3 | 6 | 3 | 2 | 2 | 6 | 1 | 2 | 10 |
| p#6 | PC/SS | PHONE | 2 | 3 | 4 | 8 | 3 | 2 | 2 | 6 | 1 | 2 | 12 |
| p#7 | PC/SF(L) | PHONE | 2 | 3 | 4 | 7 | 2 | 2 | 2 | 4 | 1 | 2 | 10 |
| p#8 | PC/SC | PHONE | 2 | 2 | 4 | 6 | 4 | 2 | 2 | 7 | 1 | 2 | 11 |
| p#9 | PC/SS | PHONE | 1 | 2 | 4 | 5 | 3 | 2 | 2 | 6 | 1 | 2 | 9 |
| variables | neck | trunk | legs | score A | upper arm | lower arm | wrist | score B | coupling score | activity score | REBA score | ||
| mean | 2 | 3 | 3 | 6 | 3 | 2 | 2 | 6 | 1 | 2 | 10 | ||
- Appendix X
All data points for participant choice with phone and TAB
Data including neck, trunk, legs, score A, upper arm, lower arm, and wrist, score B, coupling score, activity score and Final REBA score.
| p#1 | posture | device | neck | trunk | legs | score A | upper arm | lower arm | wrist | score B | coupling score | activity score | REBA score |
| p#1 | PC/SS | PHONE | 2 | 2 | 4 | 4 | 2 | 2 | 2 | 4 | 1 | 2 | 9 |
| p#1 | PC/SS | TAB | 1 | 2 | 4 | 5 | 3 | 2 | 2 | 6 | 1 | 2 | 9 |
| p#2 | PC/SS | PHONE | 2 | 2 | 4 | 6 | 3 | 2 | 2 | 6 | 1 | 2 | 10 |
| p#2 | PC/SS | TAB | 2 | 2 | 4 | 6 | 3 | 2 | 2 | 6 | 1 | 2 | 10 |
| p#3 | PC/SF | PHONE | 1 | 2 | 3 | 5 | 2 | 1 | 1 | 3 | 1 | 2 | 6 |
| p#3 | PC/SF | TAB | 1 | 2 | 3 | 5 | 2 | 1 | 1 | 2 | 1 | 2 | 6 |
| p#4 | PC/SS | PHONE | 2 | 4 | 4 | 8 | 3 | 2 | 2 | 6 | 1 | 2 | 12 |
| p#4 | PC/SS | TAB | 2 | 3 | 3 | 6 | 2 | 2 | 2 | 4 | 1 | 2 | 9 |
| p#5 | SF(LAY) | PHONE | 2 | 4 | 1 | 3 | 3 | 2 | 2 | 6 | 1 | 2 | 7 |
| p#5 | PC/SF(LAY) | PHONE | 1 | 4 | 3 | 6 | 3 | 2 | 2 | 6 | 1 | 2 | 10 |
| p#5 | PC/SF(LAY) | TAB | 1 | 4 | 3 | 6 | 3 | 2 | 2 | 6 | 1 | 2 | 10 |
| p#6 | PC/SS | PHONE | 2 | 3 | 4 | 8 | 3 | 2 | 2 | 6 | 1 | 2 | 12 |
| p#6 | PC/SS | TAB | 1 | 2 | 4 | 5 | 3 | 2 | 2 | 6 | 1 | 2 | 9 |
| p#7 | PC/SF(L) | PHONE | 2 | 3 | 4 | 7 | 2 | 2 | 2 | 4 | 1 | 2 | 10 |
| p#7 | PC/SF(L) | TAB | 2 | 4 | 1 | 3 | 3 | 2 | 2 | 6 | 1 | 2 | 7 |
| p#8 | PC/SC | PHONE | 2 | 2 | 4 | 6 | 4 | 2 | 2 | 7 | 1 | 2 | 11 |
| p#8 | PC/SC | TAB | 2 | 2 | 4 | 6 | 3 | 2 | 2 | 6 | 1 | 2 | 10 |
| p#9 | PC/SS | PHONE | 1 | 2 | 4 | 5 | 3 | 2 | 2 | 6 | 1 | 2 | 9 |
| p#9 | PC/SS | TAB | 1 | 2 | 4 | 5 | 2 | 2 | 2 | 4 | 1 | 2 | 7 |
| Variables | neck | trunk | legs | score A | upper arm | lower arm | wrist | score B | coupling score | activity score | REBA score | ||
| mean | 2 | 3 | 4 | 6 | 3 | 2 | 2 | 6 | 1 | 2 | 9 | ||
- Appendix Y
Simpler representation of posture, participant and final REBA scores
| REBA SCORE | |||
| Position | Participant # | Tablet | Phone |
| SOFA | 1 | 7 | 11 |
| 1 | 7 | ||
| 1 | 10 | ||
| 1 | 7 | ||
| 2 | 9 | 10 | |
| 2 | 11 | ||
| 2 | 11 | ||
| 2 | 11 | ||
| 3 | 8 | 11 | |
| 3 | 6 | ||
| 3 | 10 | ||
| 3 | 10 | ||
| 4 | 11 | 11 | |
| 4 | 11 | ||
| 4 | 11 | ||
| 4 | 11 | ||
| 5 | 11 | 11 | |
| 5 | 10 | ||
| 5 | 11 | ||
| 5 | 11 | ||
| 6 | 10 | 10 | |
| 6 | 9 | ||
| 6 | 11 | ||
| 6 | 11 | ||
| 7 | 10 | 10 | |
| 7 | 11 | ||
| 7 | 10 | ||
| 7 | 11 | ||
| 8 | 9 | 6 | |
| 8 | 6 | ||
| 8 | 6 | ||
| 8 | 6 | ||
| 9 | 9 | 9 | |
| 9 | 10 | ||
| 9 | 10 | ||
| 9 | 10 | ||
| REBA SCORE | |||
| Variables | Tablet | Phone | |
| Mean | 10 | 10 | |
- Appendix Z
Simpler representation of posture, participant and final REBA scores
| REBA SCORE | |||
| Position | Participant # | Tablet | Phone |
| CHAIR | 1 | 11 | 9 |
| 1 | 8 | ||
| 1 | 11 | ||
| 1 | 10 | ||
| 2 | 10 | 11 | |
| 2 | 11 | ||
| 2 | 10 | ||
| 2 | 10 | ||
| 3 | 11 | 10 | |
| 3 | 11 | ||
| 3 | 10 | ||
| 3 | 8 | ||
| 4 | 11 | 11 | |
| 4 | 11 | ||
| 4 | 11 | ||
| 4 | 11 | ||
| 5 | 11 | 10 | |
| 5 | 11 | ||
| 5 | 9 | ||
| 5 | 9 | ||
| 6 | 11 | 10 | |
| 6 | 10 | ||
| 6 | 11 | ||
| 6 | 8 | ||
| 7 | 11 | 10 | |
| 7 | 10 | ||
| 7 | 10 | ||
| 7 | 10 | ||
| 8 | 8 | 9 | |
| 8 | 9 | ||
| 8 | 8 | ||
| 8 | 8 | ||
| 9 | 8 | 10 | |
| 9 | 11 | ||
| 9 | 9 | ||
| 9 | 10 | ||
| REBA SCORE | |||
| Variables | Tablet | Phone | |
| Mean | 10 | 10 | |
- Appendix Z.1
Simpler representation of posture, participant and final REBA scores
| REBA SCORE | |||
| Position | Participant # | Tablet | Phone |
| FLOOR | 1 | 5 | 7 |
| 1 | 9 | ||
| 1 | 7 | ||
| 1 | 6 | ||
| 2 | 11 | 9 | |
| 2 | 9 | ||
| 2 | 7 | ||
| 2 | 7 | ||
| 3 | 7 | 10 | |
| 3 | 9 | ||
| 3 | 7 | ||
| 3 | 9 | ||
| 4 | 10 | 10 | |
| 4 | 10 | ||
| 4 | 10 | ||
| 4 | 10 | ||
| 5 | 9 | 7 | |
| 5 | 10 | ||
| 5 | 6 | ||
| 5 | 8 | ||
| 6 | 10 | 9 | |
| 6 | 7 | ||
| 6 | 9 | ||
| 6 | 10 | ||
| 7 | 10 | 8 | |
| 7 | 10 | ||
| 7 | 11 | ||
| 7 | 10 | ||
| 8 | 8 | 6 | |
| 8 | 8 | ||
| 8 | 8 | ||
| 8 | 8 | ||
| 9 | 6 | 8 | |
| 9 | 7 | ||
| 9 | 7 | ||
| 9 | 8 | ||
| REBA SCORE | |||
| Variables | Tablet | Phone | |
| Mean | 8 | 8 | |
Cite This Work
To export a reference to this article please select a referencing stye below:
Related Services
View all


Related Content
All TagsContent relating to: "Mobile Phones"
The first commercially available mobile phone was the Motorola DynaTAC 8000x, released in 1983. The high cost mainly restricted the first mobile phones to business until the early 1990’s when mass production brought cost effective consumer handsets. The launch of the first iPhone in 2007 introduced the world to the first phone that closely resembles what we know today.
Related Articles

DMCA / Removal Request
If you are the original writer of this dissertation and no longer wish to have your work published on the UKDiss.com website then please: