Metabolic Profiling of Severely Malnourished Children Treated with Gut-microbiota Modifying Therapeutic Feeds
Info: 8298 words (33 pages) Dissertation
Published: 16th Dec 2019
Metabolic profiling of severely malnourished children treated with gut-microbiota modifying therapeutic feeds.
INTRODUCTION
Millions of the world’s children suffer from undernutrition, which is predisposes them to death from diarrhoea and a range of infectious diseases. Severe acute malnutrition (SAM) is the most extreme and visible form of undernutrition with mortality rates among children remaining staggeringly high, mainly because the pathogenesis and the complications of this burdensome state remain poorly understood1. Traditionally, children with SAM are treated in inpatient therapeutic feeding centres which recognise that these children often have comprised physiological systems that need to recovery slowly2 Although medical treatments such as antibiotics are routine for infection control, therapeutic feeding centres are the mainstay of current SAM treatment which aim to restore normal nutritional status in order to minimise mortality and morbidity. This includes a diet of ‘ready-to-use therapeutic food’ (RUTF) which is usually a nutrient dese milk-based feed specially formulated for children with SAM. However, RUTFs do not come with their disadvantages. They are not a treatment for SAM and using them alone will not result in a healthy child. Many children with SAM are lactose intolerant with already atrophied intestinal villi, so disaccharide based milk feeds have the potential to cause osmotic diarrhoea which further aggravates the compromised digestive tract of an undernourished child 3,4.
There is increasing global interest in the claim of ‘functional foods’ to confer health benefits beyond the provision of essential nutrients. Belonging to this category are ‘prebiotics’ which have been defined as ‘a non-digestible food ingredient that beneficially affects the host by stimulating the growth and activity of bacteria in the colon, leading to improvements in health outcomes’ 5. Prebiotics have been shown to have significant and distinctive effects in the human large intestine, with some evidence showing that they can prevent episodes of diarrhoea 6,7. Prebiotics have been shown to promote a healthy gut flora, encouraging the growth of ‘good’ organisms and competitively excluding potentially pathogenic ones 8. Most research however has focused on patients in high income developed countries. Few studies have looked at low income developing countries where SAM and preventable mortality rates are high. This study will thereby address a major treatment gap, as it is biologically plausible that the benefits shown in other patients will also apply to children with SAM. This study is part of a larger proof of principal pilot study that looked at the effects of non-digestible fermentable carbohydrate (i.e. a prebiotic) in the form of cowpea flour or inulin on the intestinal integrity and microbiome of Ugandan children suffering from SAM. This paper will specifically look at the metabolic profile changes of children, by using Nuclear Magnetic Resonance Spectroscopy (NMR), after these prebiotics were given as a nutritional intervention alongside conventional WHO milk-based feeds.
Severe Acute Malnutrition
Cause
Malnutrition in all its forms remains a global concern. It continues to be the most important risk factor for the burden of disease throughout the developing world, particularly amongst vulnerable populations in southern Asia and sub-Saharan Africa9. Due to a clear association with the insecure supply of food and nutrition, poverty is thought to be the underlying cause this major public health problem10. The strain on potential resources caused by poverty is shown as a base cause of child malnutrition by a UNICEF conceptual framework shown in Figure 1, a model that still remains relevant today. This framework acknowledges that the cause of malnutrition is a complex matter, with the degree and distribution of this problem depending on many factors.
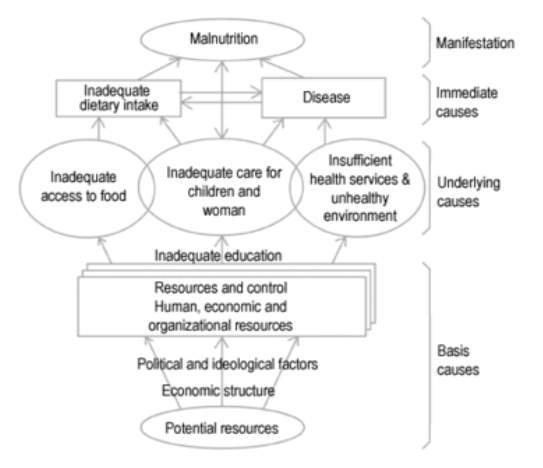
Figure 1. A conceptual framework for malnutrition. Reproduced from UNICEF11.
The degree of and distribution of malnutrition depends on many factors including:
- Political and economic situation.
- Season and climate conditions.
- Food production.
- Existence and effectiveness of nutritional programs.
- Availability and quality of health services.
- Cultural and religious food customs.
- Prevalence of infectious diseases.
https://www.ncbi.nlm.nih.gov/pmc/articles/PMC1180662/
Prevalence in children
Of the 555 million children in developing countries aged 0 to 5 years12:
- 32% (177 million) are stunted (chronic malnutrition)
- 20.2% (112 million) are underweight (mixed malnutrition)
- 3.5% (19 million) are severely wasted (severe acute malnutrition)
As highlighted in a Lancet series, malnutrition is a greatly neglected area of research even though it contributes to approximately 60% of childhood deaths13. SAM affects approximately 19 million children <5 years of age and is a significant contributing factor in approximately 6 million deaths of these children worldwide14. Children suffering from SAM are nine times more likely to die than well-nourished children and these deaths are not only the direct result of the malnutrition itself, but also the indirect result of co-morbidities such as diarrhoea, HIV infection and pneumonia. This problem is exacerbated by the fact that endemic malnutrition is most common throughout Africa, where exposure to pathogens and recurrent cycles of infection compound the problems of food security. All degrees of ‘underweight’ status in more impoverished areas therefore carries an increased risk of mortality, with Uganda having one of the highest child mortality rates in the world12. Nearly half of childhood deaths in Uganda are attributed to malnutrition as the underlying cause.15
Diagnosis
Malnutrition is diagnosed by anthropometric measurements and physical examination. Severe acute malnutrition (SAM) is the most extreme and visible form of malnutrition, with severe wasting (weight-for-height z-score of <-3) being a defining feature. It encompasses both muscle wasting and nutritional oedema-characterised by swollen feet, face and limbs. The WHO and UNICEF recommend classifying SAM among children aged from 6 months to 5 years using 3 criteria16:
- A weight-for-height score with a cut off of < 3 standard deviations from the median value. (also described as a z-score of ≤ −3).
- A mid-upper arm circumference of <11.5cm.
- The presence of clinical signs of bilateral oedema of nutritional origin.
Given the
Pathophysiology (p.25)
https://academic.oup.com/jcem/article-lookup/doi/10.1210/jc.2013-4018
http://journals.sagepub.com/doi/pdf/10.1177/15648265150361S114
In order to address metabolic changes during SAM, we can start by looking at the human “fasting metabolome”- one of the simplest metabolic challenges that can be performed in humans. A 2011 analysis of 377 fasted volunteers revealed markers that reflect changes in the body’s fuel management17. Figure 2 shows a snapshot of the “catabolic metabolome”.
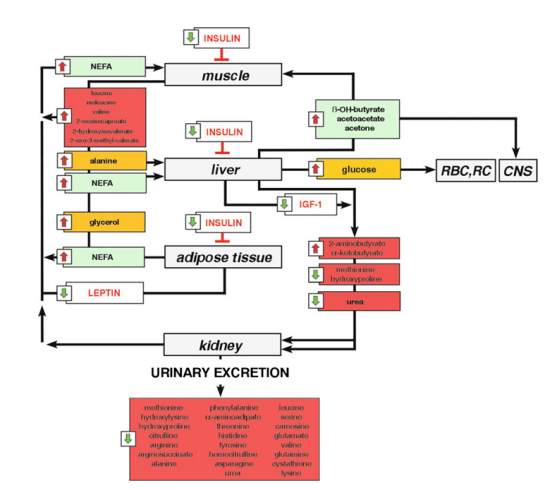
Figure 2. A metabolic network representing the signature of fasting changes. Reproduced from Rubio-Aliaga et al17.
After prolonged periods of fasting, 3-hydroxybutyrate, acetoacetate and acetone all showed increased, representing a state of ketosis17. Non-esterified free fatty acids (NEFA) and glycerol were also significantly increased suggesting increase in gluconeogenesis17. Increased alanine corresponds with the fact that, after glycerol, this amino acid is the second most important precursor for hepatic glucose production. These findings may be further explored later in this paper if necessary (i.e. if our results require elucidating).
As mentioned earlier, the pathophysiology underlying the development of SAM is a complex phenomenon and remains poorly understood. The literature examining the metabolic changes in SAM is also limited. Some studies have shown that SAM is associated with an altered glucose, protein and lipid metabolism18-21. The results of these studies are summarised below:
- Disturbed glucose clearance due to impaired insulin responses.
- Decreased endogenous glucose production.
- Hypoalbuminemia and oxidative stress.
- Slower rate of protein breakdown.
- Electrolyte disturbances in low levels of phosphate.
To my knowledge, there have only been 2 comprehensive metabolomics profiling studies carried out on children with SAM. The first was conducted on 77 children in 2014 by Bartz et al22. These children were undergoing inpatient therapy (with milk-feeds and RUTF’s) and SAM was found to induce significant changes in amino acids, fatty acids, ketones, hormones and inflammatory cytokines related to appetite and energy metabolism22. These results were reviewed by Freemark, who indicated that fatty acid oxidation provides the primary energy source for gluconeogenesis and cardiopulmonary function in the malnourished state1. He also noted that malnourished children are hypoadiponectinemic and therefore may be insulin resistant, which may represent an adaptive mechanism to spare glucose for critical organs1. In addition, proteolysis and amino acid utilisation are supressed in non-infected children with SAM1. The recovery from malnutrition during nutritional rehabilitation was accompanied by lipogenesis, glycogen synthesis, protein synthesis and amino acid utilisation1.
The second study was conducted on 40 children in 2016 by Giovanni23. An interesting finding of this study is that metabolic homeostasis did not restore in children before they were discharged (after rehabilitation on feeds) and that persistent metabolic derangements remained even though they appear to be clinically recovered23. They also found that lower circulating sphinomyelins and phosphatidycholines after nutritional rehabilitation suggest that gut barrier function is slow to recover in children with SAM. This finding together with the fact that mortality rates remained high after nutritional rehabilitation in both studies upholds the reasoning for our alternative intervention groups. Although previous studies have looked at the metabolomic profile of children with SAM fed with traditional milk-feeds and RUTF’s, no study has carried out this analysis after intervention with a microbiota modifying agent. Since our study will have both cowpea and inulin treatment arms, this study is the first of its kind. The next section will look at the gut microbiota and how changes have been observed in this complex ecosystem have been observed in the malnutrition of the human gut.
(m
http://discovery.ucl.ac.uk/1306755/1/1306755.pdf
Further Complications
Although severe malnutrition occurs almost exclusively in children, the impact of SAM are not just short term and confined to the individual child but may have long term individual and intergenerational consequences. Malnutrition also has implications for:
- Combatting other diseases (e.g. HIV/AIDS, Pneumonia and Malaria): Malnutrition increases the child’s vulnerability to infection which can contribute to the worsening of their malnourished state and risk of circulation to family and friends24. A systematic review and meta-analysis of 4891 children treated for SAM in sub-Saharan Africa found the average prevalence of HIV to be 29.2%25.
- Primary education: Malnutrition impairs a child’s ability to attend and perform at school due to impaired mental development26
- Maternal Health: Girls are at risk of not reach their full adult physical potential and are at high risk of maternity-related issues e.g. maternal mortality and lower birth rate for the next generation10.
- Gender equality: Girls are less likely to receive the education that is vital for their empowerment in the African continent27.
Malnutrition in children is described as chronic when it lasts for a long time (i.e. at least months) and this is strongly associated with shorter adult height (stunting), less schooling, reduced economic activity and, for women, lower birth weight in the next generation
Treatment
According to the WHO, most of these deaths are preventable and easily treatable if physiological and metabolic changes are taken into account and their guidelines are followed. The foundations of the WHO interventions (outside of clinical and psychosocial community programmes) for moderate acute malnutrition are formulated ready-to-use therapeutic feeds (RUTF) which allow for the management of a large number of children without medical complications in outpatient settings. For children with more severe malnutrition (i.e. SAM) who have been hospitalised for treatment, enriched therapeutic milk products like the F-75 and F-100 are used for treatment28. Although community based care with RTUFs for children with uncomplicated malnutrition has dramatically improved recovery rates, little progress has been made for children hospitalised with SAM amongst whom mortality rates remain high 29. This is partly due to the fact that current milk-based feeds cannot address the complex pathogenesis of malnutrition which lies in the nexus of immune function, impaired absorption, bowel function and the host genotype30. The microbiota lies at the core of this matrix and is one of the factors currently being explored in order to understand the pathology of malnutrition30. This could lead to more effective treatment and prevention strategies for the devastation condition of SAM.
How it arises, current treatment.
Prevelance, incidence, aetiology, pathophysiology, signs and symptoms, diagnosis, outcomes, complications-stunting, reduced height, mortality rate, social impact-school-cognitive aspect.
RUTF-used for moderate acute malnutrition. F75 and F100 –acute enriched nutritional milks only used in hospital.
The Microbiota in SAM
We have seen a blossom in interest in the human microbiota over the past decade, a vast diverse microbial system living within our GI tract that has co-evolved with our species31. It is estimated that these microbes make up 100 trillion cells, tenfold the number of human cells, and suggested that the total number of genes derived from these microbes exceeds that of the human genome by at least 100-fold 31,32. This ecological community of microorganism is mostly housed within the large intestine, where it is in symbiotic relationship with the host and performs a wide range of protective, structural and metabolic functions33,34. Some of these functions are generalised here:
- Ferment dietary fibre to produce short-chain fatty acids (SCFA) which are the primary nutrient source for the colonic epithelium.
- Promote vitamin production and mineral absorption.
- Contribute to the proliferation and maturation of epithelial cells.
- Influence the development of the mucosal immune system.
- Participate in molecular cross talk with host and influence a range of endocrine molecules and neurotransmitters.
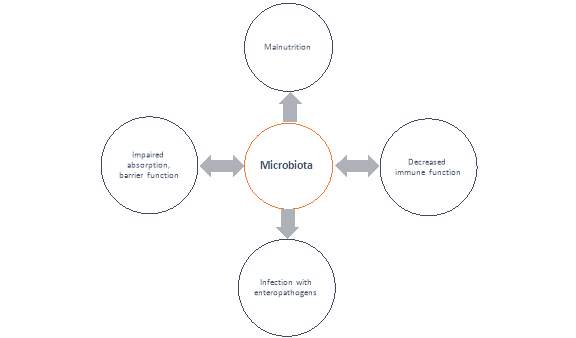
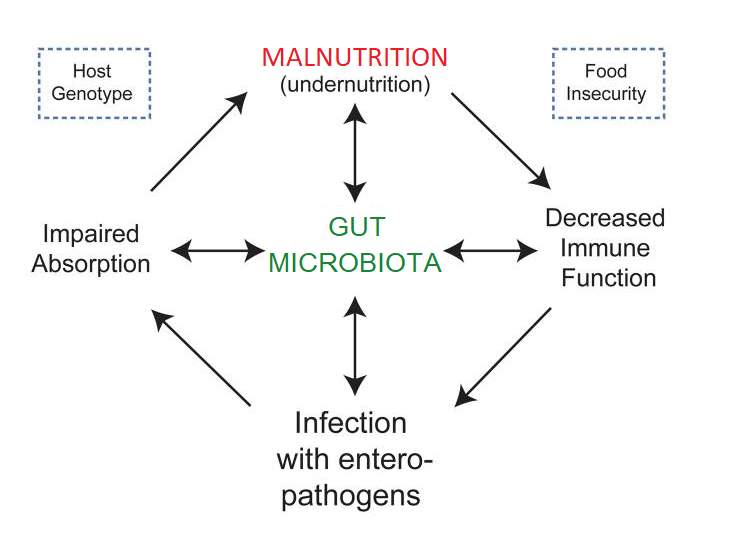
Ultimately, research has eluded to the fact that these microbes have tremendous potential to impact human physiology, both in health and disease. It is no surprise that research in recent years has increased in studying microbiota changes associated with disease, with the term ‘Dysbiosis’ being used to refer to microbiota in a disease state that can be differentiated from the microbiota community associated with healthy controls35. In order to affect multiple metabolic pathways and the immune system accordingly, the microbiota respond to changing nutritional, environmental and genetic patterns30,36. Therefore, when the nutritional environment is perturbed, e.g. in a malnourished state, it has been proposed that dysbiosis ensues and the host physiology is negatively affected30,37 Figure 1 illustrates the dynamic interplay of the gut microbiota in the vicious cycle of malnutrition.
Host Genetics
Food Security
Use altered microbiota instead of dysbiosis-
Figure 1. A schematic of the proposed impact of the gut microbiota on the relationships between immune function, infection, impaired absorption and mucosal barrier function, which underlie the development of malnutrition. Reproduced from Kane et al.
Diet-induced Dysbiosis has been linked to the malnourished state
The ecological commensal communities of the microbiota plateau in their evolution and reach an adult like state at 3 years old.30 According to studies conducted on malnourished children in developing countries, it has been suggested that early dysbiosis caused by nutritional, environmental and genetic patterns put children at risk of SAM and that malnutrition is self-reinforcing and cascading in its effects on the microbiome 38,39. A 2011 study on Bangladeshi children with SAM described their gut microbiota as immature, presenting a loss of diversity and enrichment of proteobacteria40. In 2013, a study followed 317 Malawian twin pairs with Kwashiorkor (a type of SAM characterised by edema) during the first 3 years of their life38. After comparing fecal samples of 13 sets of twins with well-nourished pairs, they found that the microbiota of the twins with kwashiorkor carried some species of bacteria associated with human illness, including bacterial communities linked with inflammatory bowel disease30,38,41. The samples also showed that those twins with kwashiorkor did not show the same maturation patterns as the health twins, who matured into an adult-like state38. These fecal samples were transplanted into mice who were fed a typical Malawian diet. Weight loss was seen in the mice with the kwashikor microbiota, which also showed rapid configuration when fed RUTF’s38. The combination of a poor Malawian diet and a kwashikor microbiota altered carbohydrate and amino acid metabolism, whilst also reducing the availability of bio-active sulphur containing compounds30,38. More studies with an approach analogous to this are required to help provice insights about the contribution of the gut microbiome to the global health problem of malnutrition. However, these preliminary findings support the notion for the use of next-generation therapeutic foods that are able to repair the microbiota, whilst providing nutritional rehabilitation.
Prebiotics
In this study we will assess the effects of adding a source of non-digestible fermentable carbohydrate (either cowpea flour of inulin) to standard feeds in Ugandan children with SAM. These fermentable carbohydrates can also be called ‘Prebiotics’ – a term introduced for non-digestible food ingredient that beneficially affects the host by selectively stimulating the growth and/or activity of one or a limited number of bacteria in the colon42. Prebiotics achieve this feat by bypassing the hydrolysis and absorption by the small intestine in order to act as a substrate for the bacteria of the large intestine. There is logical reasoning behind our choice of inulin and cowpea flour substrates. Cowpea is a legume which have already been tested in trials as a weaning food in undernourished children43. Legumes form a part of the traditional East African diet consumed by children and a number of current research programmes in East Africa are expanding legume growth to improve the environmental impact of agriculture44. This means that treatment will be both acceptable and readily available to local communities. Inulin is perhaps the most widely studied prebiotic and is naturally occurring in many fruits and vegetables that are carbohydrate staples in the traditional Ugandan diet, including banana and yams45,46. Both prebiotics are easily and cheaply sourced in Africa and could offer a safe therapeutic adjuvant to addresses malnutrition. Although cowpea is more of an experimental prebiotic, both compounds used in this study have previously shown to increase SCFA production and it is therefore a good test of principle that they can positively affect the microbiome and outcome in SAM47-50
Arguably the most documented effect of prebiotics is the production of short-chain fatty acids (SCFA) such as acetate, butyrate and propionate. The production of SCFA causes acidification of the colonic lumen which has been shown to change the microbial composition drastically, effectively lowering the levels of pH sensitive pathogens in the gut51. By increasing their solubility, the intestinal pH is considered one of the predominant factors affecting the absorption of minerals in the large bowel52. SCFA’s have also been associated with higher colonic blood flow, epithelial cell proliferation, cell differentiation and increased MUC2 gene expression15,. Expression of this gene is important for the integrity of one of the body’s primary defence mechanisms, the mucosal barrier53,54. The gut associated lymphoid tissue is the largest in the body and there seems to be coordinated cross talk between the gut microbiota and the immune system, allowing the host to tolerate the large amounts of antigen in their gut55,56. Other than altering microbial populations, SCFA production and increased mucus production are also postulated to confer immunity by enhancing barrier function and gut immunological homeostasis through multiple mechanisms 57-59 Based on these effects, our prebiotic dietary interventions of inlulin and cowpea flour may help to restore intestinal homeostasis and the gut immune response.
Due to this growing body of evidence showing a link between their consumption and bacterial populations, prebiotics are increasingly being investigated as potential adjuncts to improve the balance of normal gut flora and positively influence the immunological and metabolic function of the gut60,61. These effects implicate that a wide range of metabolites are produced by the microbiota which can interact with the host’s cells and influence physiological processes in the colon. Furthermore, these metabolites may be absorbed and influence the entire mammalian biochemistry62,63. Our metabolomics approach could therefore decipher whether our prebiotic intervention of cowpea or inulin can induce changes in the physiological processes both locally in the intestine and systemically. According to the literature, these metabolites include but are not limited to: products of carbohydrate fermentation (SCFA (acetate, propionate, butyrate), lactic acid and succinic acid) and products of protein metabolism (brached-chain fatty acids, amines, p-cresol and benzoates)62. We envisage that NMR analysis of our prebiotic treatment arms may characterise some of these markers of altered gut health. It is worth noting that since our intervention will include a supply of calories and micronutrients through conventional milk-feeds (F75/F100), the metabolite-profiles our malnourished participants are likely to show a range of biomarkers that are indicative of restoring systemic physiological processes after re-feeding.
Other documented effects of prebiotics include
http://www.cell.com/trends/microbiology/fulltext/S0966-842X(11)00095-3 (elaine holmes)-make a list
Hypothesis
Detectable metabolic changes will arise from recovery of SAM: We also expect differences in the recovery trajectory depending on randomised intervention (F75/F100, Inulin and Cowpea flour)
We will be able to detect metabolic changes related to recovery from SAM over time: We will also be able to detect metabolic differences relating to each of the treatment modalities (Standard milk-feeds, inulin and cowpea)
Prebiotics-How can they help? The treatment arms of the mimble study- cowpea is a an experimental prebiotic. The effect on the metabolism. What we are supposed to see (mini hypothesis)-E.g. scfa. Nin discussion-not seen in nmr, this particular analytical method.
Putting it all together
Methods:
The MIMBLE Study
Mention differences in Rx. –median, interquartile ranges. Most had for 7 days- in discussion-we know that x% of kids had the intervention everyday up to day 7. Confident this timepoint is very relective of this intervention. Limitation- not all kids made to 28- we are conscious of this.
This investigation is a subset of a larger pilot study titled: ‘Modifying intestinal integrity and microbiome in severe malnutrition with legume based feeds (MIMBLE).’ Samples were taken from children with SAM in Uganda and sent to imperial college London for laboratory analysis. Our focus will be to assess changes in host and bacterial metabolic products by Nuclear Magnetic Resonance Spectroscopy (NMR). However, due to the holistic nature of the human metabolic profile, the metabolites detected through this method may crossover with the findings of some of the other investigations conducted in the MIMBLE study. The study procedure of MIMBLE, from participant recruitment to sample collection (i.e. before laboratory investigations), was carried out by investigators in Uganda. This protocol will be appropriately clarified below.
Impersonal tense-the samples were prepared. Past tense. E.g. ‘it is thought’ .
Study subjects
Since this study is the first of its kind, there was no reference data to pull from in order to calculate a formal sample size. A power calculation was not carried out because it was not possible. MIMBLE is a pilot study so the data generated here could be used to inform the design and effect size of future pragmatic trials. The initial intended sample size was 90, an adequate number to provide data of a proof of principal that the modified nutritional feed provides evidence of benefit to the child in terms of nutritional rehabilitation and there is an effect on the intestinal microbiota. Taking into account mortality, dropout and loss to follow up, the final sample size was 58. In terms of subject characteristics at baseline, 47% of participants were male and the average age was 1.77 years (SD=0.98). The median treatment duration (Rx) was 17 days (IQR: 25%=8, 75%=21.5). Since the majority of children had treatment intervention for at least 7 days, this will be the exploratory timepoint for metabolic changes in data analysis.
Put this in a table? http://discovery.ucl.ac.uk/1306755/1/1306755.pdf
Inclusion criteria
The sample collection component of this study was carried out in the paediatric nutrition unit at Mbale regional referral hospital, Uganda. 58 children aged 6 months to 5 years who were admitted to this paediatric unit were recruited. Following the anthropometric features of SAM as per WHO Child Growth Standards, inclusion criteria was as follows16:
- Mid-upper arm circumference (MUAC) <11.5cm
or
- Weight-for-height Z-score (WHZ) <-3.
or
- Kwashiorkor: Symmetrical pitting oedema involving at least the feet, irrespective of WHZ score or MUAC.
‘Kwashiorkor’ is one of the 2 types of SAM we see which is characterised by the nutritional oedema symptoms described in the 3rd inclusion criteria. ‘Marasmus’is classic protein-energy starvation which can be classified according to the first 2 inclusion criteria.
Exclusion criteria
Children with SAM with very high risk of early death were excluded. This was indicated by any of the following:
- Impaired consciousness: one of prostration (inability to sit unsupported or inability to breast feed if < 9months) or coma (inability to localise a painful stimulus) after correction of hypoglycaemia (if present)
- Shock: two or more of capillary refill time > 3s, lower limb temperature gradient, or weak radial pulse volume.
- Severe dehydration: Sunken eyes and reduced skin turgor in the presence of diarrhoea (3 or more episodes of profuse and watery stool)
- Respiratory distress: increased work of breathing and hypoxia (oxygen saturation <90% in air)
Randomisation and allocation concealment
Children were randomly allocated to the following intervention groups:
- Standard treatment with WHO feed (F75/100) – control arm. n=18.
- Inulin added to standard treatment WHO feeds (F75/F100). n=20.
- Cowpea flour added to standard cereal based recipe for WHO feeds (F75/F100), altered to maintain equal energy provision as the control arm. n=20.
Randomization was carried out in permuted blocks. Cards with treatment allocation (1,2 or 3) were sealed in numbered, opaque envelopes, each signed across the seal. These cards were numbered consecutively and opened in numerical order in Mbale. After consent and randomisation, urine, blood and stool samples were taken at admission and on day 1, 7 and 28. (4-number of timepoints) Blood was treated with an anticoagulant (lithium heparin) in order to derive plasma which, alongside urine samples, was used for NMR spectroscopy.
Interventions
The transition from F75 to F100 was as per national guidelines – A ‘stablisation phase’ which uses F75 milk and progresses to a ‘rehabilitation phase’ which uses F100 milk64. The gradual transition from the relatively low-protein F75 formula over to the higher protein and energy F100 formula occurs over 2-3 days, depending on the child’s clinical presentation. F75 is designed to promote recovery of normal metabolic function and nutrition-electrolyte balance65. Rapid weight gain at this stage is dangerous. WHO recommends that once children are stabilized, i.e. have regained appetite, have reduced edema and no major medical complication, they are ready to move into the rehabilitation phase64. F100 is designed for patients to rapidly gain weight (more than 8g/day)65. The nutritional composition of these milk-feeds per 100g, together with the composition of these feeds when the prebiotics have been added, can be seen in the appendix. 2.4 grams of inulin was added to 500ml of reconstituted F75 (102g) and F100 (114g). In the standard recipe for milk-feeds, 30g of sugar was taken away and replaced with 35g of cowpea flour. The reason for this was that preexisting cereal based isotonic feeds used by the WHO replace the according amount of sugar with cereal flour. Since 8.5% of 100g cowpea is resistant starch, 1.43g of resistant starch was added to the final 500ml of reconstituted F75 and F100.
The nutritional composition of these milk feeds are shown in figure 4. Grams of each prebiotic?f75 with each (table) f100 with each (table)- put it in appendix, if they would like to see…e.g. difference in protein.
Per 500ml per 102g/114g f75/f100- 2.4g of inulin on top.
With standard recipe of f75/f100, take away 30g of sugar and replace with 35g of cowpea flour. –reason is that they are cereal based isotonic feeds-prexisting recipes that work which replace the sugar with the flour-this was used as the basis of the recipe- calculated via this, per 100g of cowpea, 8.15% is resistant starch- 1.43g per 500ml.
Metabolomic analysis
Metabolomics refers to the systemic identification and quantification of the small molecule products (the metabolome) of a biological system (cell, tissue, organ or biological fluid) at a specific point in time. There is a similar term, metabonomics, which differs more in practice than definition. The term metabonomics is usually only applied to studies of human nutrition that either measure a response or compares metabolic profiles without identifying individual compounds. In practice, analytical and modelling procedures are the same and these terms are usually used interchangeably66.
Metabolomics allows for the simultaneous evaluation of a wide range of metabolites (HMDB lists 42,000) so we can gain a holistic understanding of changes of functional alterations in the host metabolism67. After separating, detecting, characterising and quantifying certain metabolites, we are able to decipher their relevant metabolic pathways. Metabolomics can therefore be used to: 1) identify biomarkers that could indicate the presence of diseases68; 2) determine biochemical or environmental stresses69; 3) characterise microbial metabolism70; and 4) characterise human health or disease71. Thus, the metabolomics approach we have taken provides information with a high potential for accurately inferring functional changes in the microbiota and overall physiology of the malnourished child.
Metabonomics- hereafter, the terms are used interchangibly. Give definitions first (Jeremy, elaine paper).
Metabolomics can be divided into 2 different groups: targeted analysis and non-targeted analysis. In this study, we opted for a non-targeted approach which gives a rapid snapshot of the metabolic profile of samples by using technologies able to cover all or almost all detectable metabolites, rather than specifically quantifying different classes of a known compound (i.e. amino acids, lipids, carbohydrates)72. We chose the untargeted profiling method so that we can see a global view of our biofluid samples and detect as many unknown compounds as possible (i.e. there is no detection limit)73. A non-targeted approach is preferred when characterising the metabolic status of young children with SAM considering the array of metabolites (e.g. amino acids, fatty acids, hormones etc) that may be implicated in the systemic metabolic adaption before and after nutritional intervention1. This renders a targeted approach technically difficult and extremely time-consuming.
NMR spectroscopy
Nuclear magnetic resonance spectroscopy (NMR), next to mass spectrometry (MS), is one of the main metabolomics analytical platforms. It allows for the identification and quantification of compounds in a single sample of biofluid through a large non-targeted scale, whilst being minimally destructive and highly reproducibile74. Other advantages of using include the speed of processing (2-3min/sample), the fact that samples do not require deproteination or derivitization (i.e. separation) and the large body of software and databases that exist for data processing75. In this study we employed 1H (proton) NMR as the majority of known metabolites contain hydrogen atoms and this system is non-biased to particular metabolites, unlike other techniques (i.e. every metabolite at greater concentrations than the instrument detection limit are detected)68. The chemical shift for 1H NMR depends on the difference between the resonance frequency of the observed proton and that of a reference proton presence in a reference compound. This difference is given in ppm. In this experiment, TSP in solution, was used as the reference compound set at 0ppm. The signal intensity is determined by the number of identical nuclei, which allows quantification to be performed68. The robustness of using NMR technology in metabolomics and its applications to nutrition research has been previously discussed67,68,75,76.
The urine and plasma specimens were stored at -40°C and thawed before investigation. Samples were prepared for 1H NMR spectroscopy and processed according standard methods outlined by the metabolomic profiling procedures of Beckonert et al. of Imperial College London77
The software used – clalibration step –urine for TSP, plasma for glucose. PREPROCESSING in matlab,
Pqn normalised – by this.
Data entry and pre-processing
. The Bruker NMR data was imported into MATLAB to show the raw spectral profiles of urine and plasma. The spectra was first pre-processed prior to exploratory analysis. Calibration was carried out using TSP (f 3-trimethylsilylpropionic acid) for urine and glucose for plasma. Interfering NMR signals arising from TSP, water and urea were then removed. Urine data had to be normalised in MATLAB to reduce inter-sample concentration variability and thus make samples directly comparable with one another. Probabilistic Quotient Normalization (pqn) is a robust method to account for dilution of complex biological mixtures and is an essential step in urine where extreme variation in concentration is common78. Due to the raw data being complicated by the number of peaks, overlapping signals and baseline fluctuations, automatic peak detection and matching was performed (alignment) before importing the data into SIMCA. Although alignment facilitates multivariate analysis and allows for cleaner modelling discriminatory analysis between variables, this automated process does not come with its problems. The raw unaligned spectra in MATLAB was therefore used for metabolite identification.
Past tense? Will be, was.
multivariate analysis
The high degree of complexity generated by thousands of variables can be summarised in a relatively simple fashion, without the need to study many different tables or plots, by using multivariate projection methods. Data was imported into SIMCA (Umetrics) where some exploratory analysis was carried out. The goal is to provide a global overview of the data, as well as identifying any outliers and the main sources of variation. Principal Components Analysis (PCA) was used initialy-a multivariate projection method which produces intuitive 2D maps of the whole data set. This method was preferred to enable visualisation in which groups and trends can be identified (e.g. Metabolic differences between intervention groups at a certain timepoint). The advantages of this multivariate method for exploratory analysis is summarised by Bictash et al. 79
Multivariate statistics
From the many thousands of signals generated from low molecular metabolites, the data can then be reduced and interpreted by use of multivariate statistics. Multivariate analysis takes into account all of the metabolomic features simultaneously and identifies patterns between them. These pattern recognition methods can be classified into two groups: supervised and unsupervised methods. Put this in before pca, pls da, opls
- Unsupervised: Similarity patterns identified without taking into account the type or class of the study samples. This method includes PLS-DA (Partial Least Squares-Discriminate Analysis) and OPLS-DA (Orthogonal PLS).
- Supervised: Sample labels used to identify features that are more associated with a phenotype of interest. This method includes PCA (Principal Component Analysis).
Both methods were used in this study, a comprehensive description of which can be found in reviews by Bictash et al and Worley et al79,80.
Figure 5 a) and b) show the models that were constructed:
|
TIMEPOINT |
INTERVENTION | |||
| Standard | Inulin | Cowpea | ||
| 0 |  |
|
||
| 1 | ||||
| 7 | |
|||
| 28 | ||||
Figure 5. A table to show the models constructed in SIMCA according to the direction of arrows. E.g. for table a), Standard: Day 0 vs Day 1. b) Day 0: Standard vs. Inulin.
|
TIMEPOINT |
INTERVENTION | |||
| Standard | Inulin | Cowpea | ||
| 0 |  |
|||
| 1 |  |
|||
| 7 |  |
|||
| 28 | ||||
Each model was made according to the following projection methods.
- PCA
- PLS-DA
- OPLS-DA
Each of these models was auto scaled so variables have zero mean and unit variance. This results in PCA and PLS examining correlations, rather than covariances, in X and Y. A myriad of other scaling methods exist, including pareto scaling which was also carried out on each model. This type of scaling reduces the influence of intense peaks while emphasizing weaker peaks that may have more biological relevance80. 126 models were constructed for both plasma and urine (252 in total).
The number of components fitted would depend on how well each variable models the data (i.e. variable diagnostics). R2 and Q2 tell us which variables explain the data well and which do not, and their ability to correctly categorise new data. R2 estimates the variation explained and Q2 estimates the predictive ability of that component. The quality of the model is assessed by the accumulative R2 and Q2 values calculated from the components. High values are desirable and the difference between R2 and Q2 should not be too large. It is the balance of Q2 and R2 that we wish to identify, as the predictive ability of a model will degrade at a certain level of complexity (i.e. too many components are added).
Statistically speaking the amount of variation explained should be as high as possible and high R2 and Q2 values are desirable (close to 1). Due to extreme inter-individual variation in metabolic profiles of human data, these thresholds are rarely, if ever, met and therefore lower thresholds are considered acceptable in this type of data. This necessitates the use of lower threshold, e.g. a Q2 value at 0.25 as a minimum. The R2 is less important when checking the validity of a model and is more of an indicator as to whether the variation is due to the regression variable that was used. For example, if R=0.7 for Day 0 vs. Day 7, 70% of the metabolic variation between these intervention groups can be attributed to difference over time, therefore presumably related to nutritional intake. histogram.
S line is a loading plot. (type-plotting covariance rather than absolute values). Scores plot. (each data point is a sample)
https://pdfs.semanticscholar.org/eb9a/9af23d7dd3e393a134b0b3d19c37334336cb.pdf
Indenficiation method-stocsy- steps taken from simca giving a ppm value.
Look at raw spectra, storm & stocsy, multiplet identification (jres), comparison to internal and external databases (reference to hmdb, Jeremys paper). ‘internal reference database’-unpublished data.
reference when peak picking and identifying multiple NMR peaks from the same molecule (Statistical Total Correlation Spectroscopy-STOCSY).
All metabolomics studies result in complex multivariate data sets that require visualisation software and bioinformatics methods for interpretation. This produces biochemically based fingerprints that are of interpretive value for diagnosing any changes in metabolic profiles77.
supervised- pca, unsupervised- plsd da. Opls. 18,000 variable. 140 samples with 18k variables each- high dimensional data set- multivate analysis serves as dimension reduction technqiues- enable visualisation of data.
Metabolimics- what it is, why. INTERMAP-or well cited papers. The value of this approach to this field. Why using this approach in this conditions. 1. Sam. 2. Its recovery. 3. The multiple treatment arms. Can infer functional difference in microbiome from nmr. Untargeted profiling-defend this choice.
We will be using supervised analysis methods rather than unsupervised, meaning that sample labels are used in order to identify features (e.g. an intervention or timepoint) associated with a change in the metabolic profile.
Metabolomics.
Limitations
(disavantages of nmr)
- The disadvantages of untargeted methods include the complex informatics required to interpret the results, the semi-quantitative nature of the methods and the need to validate any identified compounds.
There is no single method of structural characterisation. Hence this step is not readily automated, requiring experienced spectroscopists, and can pose a significant bottleneck for metabolic profiling of large-scale population studies
. Assignment of an individual metabolite is both time consuming and technically challenging, because of the diverse chemistries present, fluctuating nature of the metabolome in response to environmental stressors and the lack of well-annotated metabolite databases
The sensitivity of metabolic profiles to unknown or unmeasurable factors introduces a degree of complexity that can hamper the validation and wider utility of identified metabolic signatures.
Cite This Work
To export a reference to this article please select a referencing stye below:
Related Services
View all


Related Content
All TagsContent relating to: "Medicine"
The area of Medicine focuses on the healing of patients, including diagnosing and treating them, as well as the prevention of disease. Medicine is an essential science, looking to combat health issues and improve overall well-being.
Related Articles

DMCA / Removal Request
If you are the original writer of this dissertation and no longer wish to have your work published on the UKDiss.com website then please: