The Compressed Natural Gas in Diesel Engine
Info: 14618 words (58 pages) Dissertation
Published: 9th Dec 2019
Tagged: EngineeringSciences
Table of Contents
4.1 Background of this Project
4.3. Objective of this Project
4.4. Historical of Diesel Engine
4.4.1. How does diesel engine work
5.1. Advantage of using Compress Natural Gas
5.1.3. Reduce Maintenance Cost
6.1. Thermodynamic Principle (Air-Standard Cycles)
6.2.3. Mean Effective Pressure
7.2. Background of Compressed Natural Gas
7.3. How Different Shape of Compressed Natural Gas affects the Geometry Efficient
7.4. The Method to Refuel Compress Natural at Home
7.5. How does Compressed Natural Gas Work
7.5.1. Compressed Natural Gas Fuel Delivery System
7.5.2. Advanced CNG Technology
7.5.3. Work Principle of Dual Fuel
7.5.4. Advantage of Using Dual Fuel
8. EEXPERIMENT METHOD AND PROCDURE
9.5.1. Data Analysis of Diesel Fuel Experiment
9.5.2. Data Analysis of Mix Fuel Experiment
9.5.3. Data Analysis of Biofuel Test Experiment
9.5.4. Data Analysis of Emission Test Experiment
10. COMPARISION BETWEEN COMPRESSED NATURAL GAS, BIOFUEL AND DIESEL FUEL
10.10. Specific Fuel Consumption
11.5. Possible Error Have Made During Experiments and Suggest Methods Reduce the Error
11.6. Recommend how to Increase the Efficiency by using Compressed Natural Gas
12.5. Compressed Natural Gas is the Best Choice
12.6. How does Compressed Natural Gas Affect Our Daily Life
12.7. Prospect and Estimate Compressed Natural Gas in the Future
14.6. Pictures of latest Compressed Natural Gas vehicles design
1. ABSTRACT
The reason to choose this topic because of I have considered 3 different problem by using diesel fuel and gasoline fuel. The first problem is about the environment problem. The second problem is fuel prices and the last problem is whether the fuels is sustainability. Therefore, it motivate me to investigate which alternative fuels more eco-friendly to the environment. As a result, I have chosen compressed natural gas to be my research topic. Moreover, there had some of scientists said that compressed natural gas and electric are going to use in vehicles in the future.
3. LIST OF SYMBOL
List of the Abbreviation
NOx Nitrogen Oxides
CO Carbon Monoxide
CO2 Carbon Dioxide
O2 Oxygen
T.H.C. Tetrahydrocannabinol
CNG Compressed Natural Gas
FWO Food Waste Oil
CH4 Methane
Cl Combustion Ignition
NG Natural Gas
ECM Electronic Control Module
CNG-DI Compressed Natural Gas with Direct Injection System
CNG-BI Compressed Natural Gas with Biofuel Injection System
Gasoline-PI Gasoline Port Injection System
SFC Specific Fuel Consumption
HC Hydrogen Carbon
4. INTRODUCTION
4.1 Background of this Project
In recent 10 years, technology is developed tremendous speed. Especially in automotive industries. In the previous year, most of the car uses diesel fuel and biofuel to be car fuel. However, Jonathan (2016) quote the government’s climate advisers said around 500,000 diesel trucks must progress stop to use and eliminate because these Lorries emit 19 million tons of CO2 in every year. Mike (2016) comments that if the UK use an electric and gas-powered vehicle, the emissions must cut from 500 million tons per year to 120 million tons by 2050 and to 10 million to 20 million tons by 2100. Therefore, natural gas has been developed to be one of the alternative fuel. Most of the fuel industries want to develop compressed natural gas because of compressed natural gas more efficiency than diesel fuel and biofuel. Also, the price by using CNG cheaper than other fuels. The most important thing is CNG eco-friendly to the environment.
4.2 Aim of this Project
The aim of this project is to investigate the feasibility of using compressed natural gas as an alternative fuel in the diesel engine. The project is divided into four sections, including background research, efficiency comparison, emission analysis, analysis of the alternative fuels. The current situations of the three alternative fuels are investigated in background research. The engine power, fuel consumption and mean effective pressure will be investigating in efficiency comparison section. The improvement and suggestion have provided after finished the experiment and research by using diesel fuel, bio-fuel and compress natural gas.
4.3. Objective of this Project
4.3.1. Objective 1
Experiment analysis by using data and evaluate the emission test. In experiment analysis, the experiment results have been generated after the test. Such as analysis the result of bio-fuel and diesel fuel.
4.3.2. Objective 2
Efficiency comparison. The work has been done by using the data which came from the experiment. The comparison includes the theoretical and experimental result of biofuel, diesel fuel, and compressed natural gas.
4.3.3. Objective 3
Find some case study about compress natural gas vehicles. The work has searched and analysis how compressed natural gas applies to various vehicles in different countries.
4.3.4. Objective 4
Compare fuel efficiency/ fuel consumption. After finishing experiments, the work has been done by using the experimental data to compare which of the alternative fuel (as biofuel, diesel, and compressed natural gas) is more efficiency and lower cost due to higher efficiency.
4.3.5. Objective 5
Identify of Diesel cycle, Otto cycle and Dual cycle based on the experimental result.
4.4. Historical of Diesel Engine
The first diesel engine (also known as a compression-ignition or CI engine), who built it by Rudolf Diesel in 1897s. Diesel Engine has two versions, which are two-stroke and the four-stroke. The difference between a two-stroke and four-stroke engine is two-stroke engine has a high specific power. Also, two engines has a greatly reduced number of moving parts, more compact, much lighter than four strokes, the cooling system is less than four-stroke, have high power-to-weight and power-to-volume ratios and create more exhaust emissions than four-stroke engines. Nowadays, most of the diesel engine using diesel to be fuel. The concept of the diesel engine uses compressed air to the degree, so that the temperature rise. It’s based on the theory of adiabatic compression. Diesel engine mostly applies to larger cars. Such as truck, bus, ship, etc.
4.4.1. How does diesel engine work
Firstly, diesel fuel is injected into the fuel injection system into the engine cylinder Secondly, the liquid fuel is injected at high velocity as one or more jets through small orifices or nozzles in the injector tip, atomizer into small drops and penetrates into the combustion chamber. Thirdly, the combustion process is controlled and governed by mixing and combustion takes place where the fuel meets oxygen (non-premixed combustion). There have 2 types of diesel combustion system. The first type is direct injection system and the second type is indirect injection system. In direct injection system, the single combustion chamber into which fuel is injected directly. In direct injection system, the combustion chamber is divided into two regions and fuel is injected into pre-chamber. Although the simple construction and small surface area of the combustion chamber, it reduces heat loss and fuel consumption. In addition, the surface area of the combustion chamber has lower volumetric rate, it decreases the cooling lost. Furthermore, the probability of combustion chamber deformation decrease due to uncomplicated design.
In indirect combustion system, small high-speed engines require faster mixing. Therefore, vigorous charge motion is needed. The pros by using indirect injection combustion system are injection pressure lower than others (approximately 80~150 bar) so that it decreases malfunction of the fuel system and have durability. Besides, air-fuel mixture better than DI system.
4.5. Biofuel
Biofuel is one of the renewable and sustainable resources. Biofuel produced by plant biomass, vegetable oils, treated municipal and industrial waste. Normally, the application by using biofuel is for vehicle. It used as a diesel and compressed natural gas fuel additive to reduce the practical. Such as carbon monoxide (CO), nitrogen oxides (NOx), carbon dioxide (CO2) and oxygen (O2), hydrogen carbon (HC) from diesel-powered and compressed natural gas powered vehicles. Also, biofuel is one of the most popular fuel in the world. The application by using biofuel in passage car, bus, truck and Fast Attack Craft, JAS-39 Gripen fighter. Megan (2017) mention that NASA confirm that .WORLDWATCH INSTITUDE (2016) stated that in 2010, the worldwide production of biofuel reached 105 billion liters and up 17% from 2009.
5. REVIEW
5.1. Advantage of using Compress Natural Gas
5.1.1. Reduce of Fuel Cost
The U.S Department of Energy (2014) stated that using compressed natural gas can save around $0.90 (£0.72) per miles in fuel cost. The reason to save fuel cost because of compressed natural gas is easier to burn than biofuel and diesel fuel (C12H23) due to CNG comprises lower hydrocarbon. In comparison with biofuel and diesel fuel, CNG needs less energy to break the hydrocarbon bond because of low boiling point. Therefore, it needs CNG to produce higher energy and efficiency than biofuel and diesel fuel so that it reduces fuel cost.
5.1.2. Environment Friendly
Compare with diesel fuel and biofuel, compressed natural gas more eco-friendly to nature. OECD (2010) illustrate the figure of emissions, they said that using CNG can reduce 25% of CO2 (on average) emit. According to the European Natural Gas Vehicles Association (2009), they point out that using Dual-Fuel in Heavy-Duty Vehicle (HDVs) have approximately 20% CO2 advantage compared to normal diesel vehicles. Compare with diesel fuel, using spark ignited in NGVs under HDVs can emit around 13% less CO2 than diesel fuel because of efficiency loss in diesel vehicle so that increase amount if equipment for emission as NOx and particulate matter, ENGVA claims. CNC-ONE (2016) said that CNG is the cleanest fuel under transportation market. Furthermore, they mention CNG produce around 20-30% greenhouse gas emission.
5.1.3. Reduce Maintenance Cost
According to CNG-ONE (2016), the reason for using CNG reduce maintained cost because CNG doesn’t consist lead. Lead is the toxic and harmful element, which affect the durability of spark plug and environment. Increase the spark plug life using CNG is the best choice due to CNG is no fouling. Although CNG does not contain pollute crankcase oil, the gap between oil changes and tune-ups can extend. Furthermore, pipes and mufflers (install in exhaust system) can be use longer due to CNG cannot react with metals.
5.1.4. Performance Advantage
Argonne (2010) cite that although compressed natural gas has a high-octane rating (around 130), the power increase in spark-ignition engines. Moreover, CNG-ONE point out high octane rating affect the experience of less engine knock, no vapor locking and no any engine lag under cold or hot weather condition. Engine Knock affect the performance of the engine and decrease the spark plug, piston, cylinder the durability.
5.1.5. Safety Advantage
Compare with diesel tanks, CNG fuel storage tanks are stronger and safer because CNG tanks normally make by reinforced fibers as well as glass fibers, Kevlar (aramid) and carbon fibers (Dr. John in 1995). In recent years, some newer tanks are made by polymers and composites (Christine & Scott Gable, 2016). These new materials are stronger than steel. Although composite and polymer are heat resistant material, it cannot auto-ignite or catch fire under the standard temperature.
5.2. Fractional Distillation
Fractional Distillation is the process which based on boiling point difference and separates a mixture into several different parts. The crude oil has been used during Fractional Distillation process. In this process, the crude oil is drying up and then based on the concentration and temperature differences allowed its vapours in the fractionating column. Although different column represents the various temperature and concentration, it includes hydrocarbon molecules and similar number carbon atoms. The molecule formula to represent various name of fractions, which is CnH2n+2 (n is the number of carbon). For example, if only 1 carbon. C1H2(1) +2 is CH4. We called it methane. The different boiling point, the concentration of hydrocarbon molecules used it in the different way. Picture 1.1 illustrate different application of various hydrocarbon molecules.
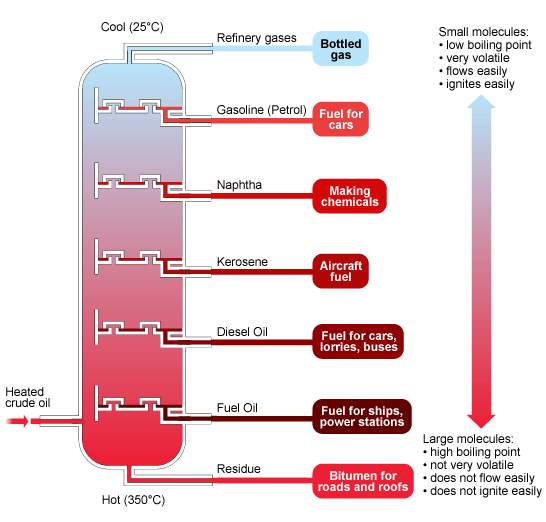
(Diagram 1.1 The application of different hydrocarbon molecules http://www.bbc.co.uk/schools/gcsebitesize/science/aqa_pre_2011/rocks/fuelsrev3.shtml)
According to Picture 1.1, the picture illustrates that the difference between large molecules (at the bottom) and small molecules (at the top). The properties of small molecules are the low boiling point, very volatile, flows easily, ignites easily. The properties of large molecules are not very volatile, does not flow easily, and does not ignite easily. The trend of large and small molecules difference also can represent by the table (table 1.2)
| Fraction
Properties |
1 | 2 | 3 | 4 |
| Boiling point range | Room Temperature to 100˚C | 100-150˚C | 150-200˚C | 200-250˚C |
| Volatility (Ease of evaporation) | Evaporates quickly |  ease of evaporation decrease ease of evaporation decrease |
Evaporates slowly | |
| Colour | colourless | very pale yellow | yellow | brown |
| Viscosity | | non- viscous (flows easily) | viscosity increases |
fairly viscous | |
| Flammability | very easy to burn | flammability decrease |
difficult to burn | |
| Colour and sootiness of flame | yellow with blue edges; non- sooty | yellow/ orange; slightly sooty | orange; sooty | orange; very sooty |
(Table 1.2. the table of properties of the fractions)
6. THEORY
6.1. Thermodynamic Principle (Air-Standard Cycles)
6.1.1. Diesel Cycle
The Diesel Cycle is a combustion process which apply in internal combustion engine. In internal combustion engine, the fuel has been ignited and generated by heat during the compression process of air in the combustion chamber.
In figure 1.1, the work has showed how Diesel Cycle graphs looks like.
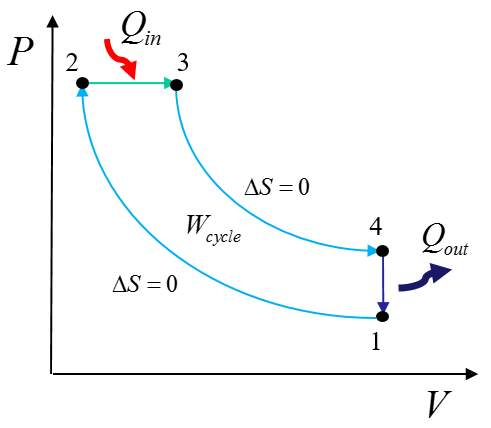
(Diagram 1.1. Diesel cycle graph of P against V) http://www.mpoweruk.com/heat_engines.htm
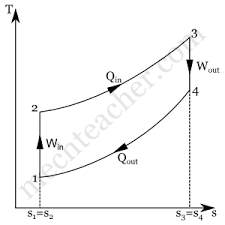
(Diagram 1.2. Diesel cycle graph of T against S) http://mechteacher.com/diesel-cycle/
At 1-2: Isentropic compression
At 2-3: Constant pressure heat addition
At 3-4: Isentropic expansion
At 4-1: Constant volume heat rejection
6.1.2. Otto Cycle
An Otto Cycle (also known as thermodynamic cycle) that describes of a typical spark ignition engine. Otto Cycle also normally can found in automobile engine (such as car, trucks, etc.)
In figure 1.2, the work has showed how Otto Cycle graphs looks like.
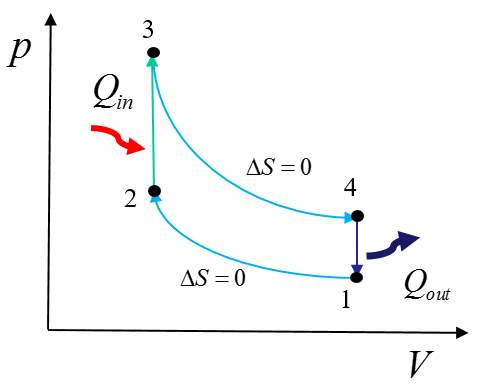
(Diagram 1.3. Otto cycle graph of P against V) http://www.mpoweruk.com/heat_engines.htm
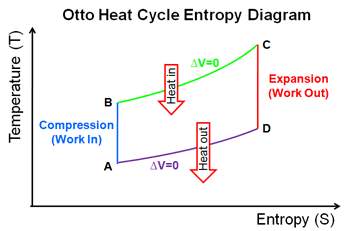
(Diagram 1.4. Otto cycle graph of T against S) http://www.mpoweruk.com/heat_engines.htm
At 1-2: Isentropic compression
At 2-3: Constant volume heat addition
At 3-4: Isentropic expansion
At 4-1: Constant volume heat rejection
- Mix Cycle
Mix Cycle is a thermal cycle which combine with the Otto Cycle and the Diesel Cycle. The pros of Mix Cycle are that more time is available for the fuel to completely combust due to constant volume and constant pressure process. Also, the efficiency by using Mix Cycle better than Diesel Cycle and Otto Cycle.
In figure 1.3, the work has illustrated how Mix Cycle graph looks like
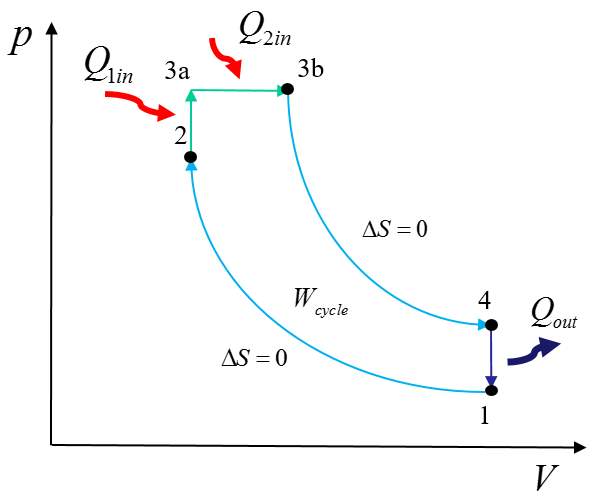
(Diagram 1.5. Mix cycle graph of P against V) http://www.mpoweruk.com/heat_engines.htm
At 1-2: Isentropic compression
At 2-3: Constant volume heat addition (combustion)
At 3a-3b: Constant pressure heat addition (combustion)
At 3b-4: Isentropic expansion
At 4-1: Constant volume heat rejection
4.1.3. Carnot Cycle
Carnot cycle is a theoretical thermodynamic cycle that provide an upper limit on the efficiency of any classical thermodynamic engine to achieve during the conversion of heat and work. Although Carnot Cycle is not an actual thermodynamic cycle, it is a theoretical construct.
In figure 1.3, the work has illustrated how Carnot cycle looks like
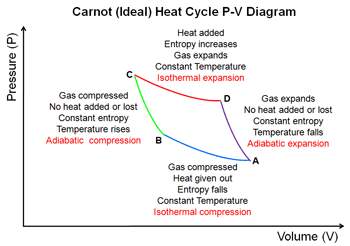
(Diagram 1.6. Carnot cycle graph of P against V) http://www.mpoweruk.com/heat_engines.htm
At 1-2: Isentropic compression (at Th)
At 2-3 Adiabatic Expansion (from Th to T1)
At 3-4: Isothermal Compression (at T1)
At 4-5: Adiabatic Compression (from T1 to Th)
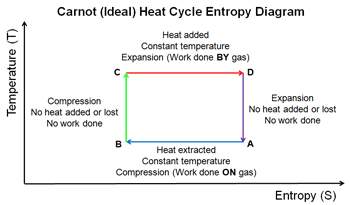
(Diagram 1.7. Carnot cycle graph of T against S) http://www.mpoweruk.com/heat_engines.htm
6.2. Fuel Economy
The term of Fuel Economy used to describe in automobiles, which describe between the fuel efficiency and the distance travelled and the amount of fuel consumed by the vehicles. The parameters affect fuel consumption consist power, torque, mean effective pressure, efficiency and cost.
To calculation the fuel economy, the equation has been used to calculate the Miles per Gallon
6.2.1. Displacement Volume
Equation 1:
Equation 5
Miles per Gallon (MPG) =
nd time fill up the tank in the station
Mileage A= the number based on odometer by using 1st time fill up the tank in the gas station
Gallons= the latest reader based on how many gallons fill up the tank in the gas station
6.2.6. Emission
In terms of Emission is while vehicle was running, it emits substances. These substances and particles discharged and mix into the air. Such as CO2, NOx, and SO2, etc. In this case, the emission describes as an internal combustion engine.
6.2.7. Air-Duel Mixture Ratio
Air-fuel ratio is a combustion process which define mass ratio of air to fuel. Normally, air-fuel ratio applies in internal combustion engine. There has different air-fuel ratio with depends on the combustion whether is stoichiometric combustion (ψ=1, λ=1), rich combustion (not enough oxygen. ψ˃1, λ˂1) and lean combustion (ψ˂1, λ˃1). The air fuel mixture ratio approximately 0.5 to 0.3. There have 3 equations to use, which is Air to fuel (mass of air required to complete burn given amount of fuel), Air-fuel equivalence ratio and Fuel- air equivalence ratio.
Equation 1: Air to fuel ratio (mass of air required to complete burn given amount of fuel)
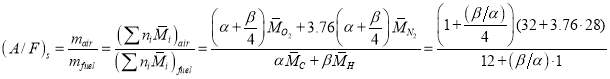
Equation 2: Air-fuel equivalence ratio

A= Mass of Air
F= Mass of Fuel
Λ= lambda of air-fuel equivalence ratio
This equation is measured by exhaust gas oxygen (Lambda) sensor installed upstream of a catalyst.
Equation 3: Fuel-air equivalence ratio

Ø= Fuel-air equivalence ratio (phi)
(F/A) = Fuel to oxidizer ratio
(F/A) s= Fuel to oxidizer ratio under stoichiometric conditions
While,
ψ=1, λ=1 (stoichiometric combustion)
ψ˃1, λ˂ 1 (rich combustion that not enough oxygen)
ψ˂1, λ˃1 (lean combustion)
The definition of lean combustion is when fuel-air mixture with more than stoichiometric air (excess air).
The definition of rich combustion is when a fuel-air mixture with less than stoichiometric (excess fuel). In this case, carbon monoxide (CO) and molecular hydrogen (H2) also appear in the products
The Chemical equation of Lean Combustion is
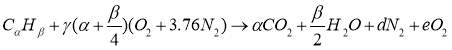
(Reference from http://authors.library.caltech.edu/25069/4/AirPollution88-Ch2.pdf )
The Chemical equation of Rich Combustion is

(Reference from http://authors.library.caltech.edu/25069/4/AirPollution88-Ch2.pdf)
7. COMPRESSED NATURAL GAS
7.1. Introduction
Natural gas is one of the fossil fuel such as oil and coal. Dislike other fossil fuels, natural gas eco-friendly to the environment and emits lower level. Also, NG has higher energy and power than other fuel (such as diesel fuel and biofuel). The natural gas (also called as NG) is chiefly composed of methane (CH4). The method to form methane uses Fractional Distillation to the petroleum depends on petroleum boiling point differences. The boiling point of natural gas (also called as refinery gasses) is below 40°C. After the natural gas has formed, NG compress by compressing process and formed Compress Natural Gas (CNG). Compressed natural gas (CNG) is made by compressing natural gas (less than 1 percent of the volume it occupies under standard atmospheric pressure. CNG stored in hard containers around 4Pa, CNG usually in cylindrical or spherical shapes. To apply in the automotive industry, the shape that automotive industry uses cylinder. CNG have lower emission and noise advantage than conventional diesel vehicles. Also, the durable of CNG can be used longer than other alternative fuels because of the efficiency of CNG higher than other fuels. The technological challenge that will it solve is deployment challenges (as garage modifications and fuel resale for public stations) and other fuel infrastructure challenges. The technological challenge that will it solve is how to increase the efficiency of current compressed natural gas. Compress natural gas can affect society, business, environment, government, safety, and healthcare.
7.2. Background of Compressed Natural Gas
In automotive industry, the Compressed Natural Gas used it for motor fuel because it has the highest-octane rating than other alternative at 130. That’s means compressed natural gas can handle compression ratios of up to 15:1. Moreover, compare with other alternative fuels, compressed natural gas is the most cleanly burning fuel than others because it have lower Carbon Oxide (CO) and Hydrogen Carbon (HC) emissions than propane, gasoline or the alcohols. Furthermore, compressed natural gas also is the cheapest fuel used per gallon of gas.
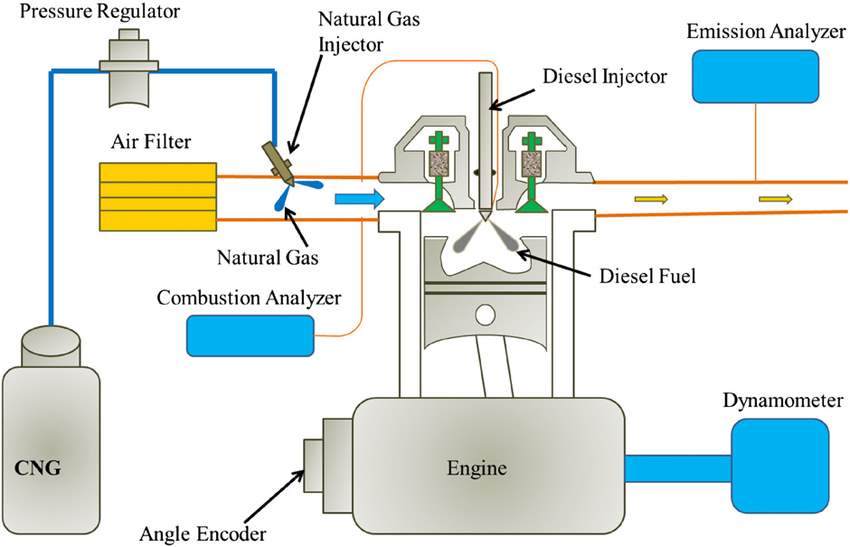
(Picture 1.6 The flow chart to simulate how does compress natural gas work) https://www.researchgate.net/figure/283522119_fig3_Fig-2-The-schematic-diagram-of-high-pressure-direct-injection-system-Fig-3-The
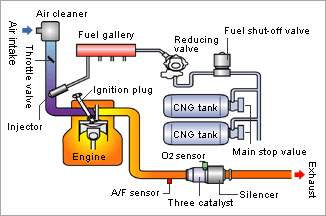
(Picture 1.7 The flow chart to simulate how does compress natural gas work) http://forecasting.tstc.edu/techbriefs/compressed-natural-gas-cng/
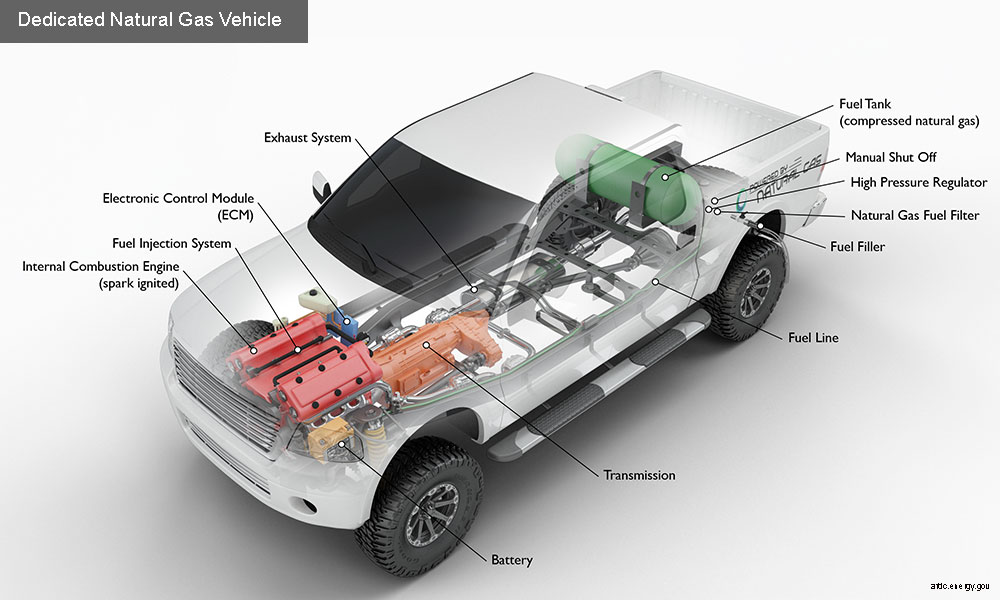 (Picture 1.8 The diagram actual passenger car of Dual-Fuel Compressed Natural Gas Car) http://www.afdc.energy.gov/vehicles/natural_gas.html
In picture 1.6, 1.7 and 1.8, it shows the details of how compressed natural gas works in passenger car and engine. Here is the function of different parts.
- Compressed Natural Gas Fuel Tank
It stores compressed natural gas on the vehicle until the engine needs to use compressed natural gas.
- Gasoline Fuel Tank
It stores petrol fuel tank on the vehicle until the engine needs to use the gasoline fuel.
- Compressed Natural Gas/Gasoline Switch
It used to switch from compressed natural gas to gasoline while in operation. It allows to shut off the fuel supply manually.
- Gasoline Fuel Injection System
It used to inject the gasoline fuel into the engine’s combustion chambers for ignition process.
- Natural Gas Fuel Injection system
It used to inject the compressed natural gas into the engine’s combustion chambers for ignition process.
- Compressed Natural Gas Fuel Filter
It avoid some particles to entre them from clogging critical fuel system components.
- Compressed Natural Gas Sensors
CNG sensors used to control fuel supply and convey the information to the electronic control module (such as ECU and ECM).
- High Pressure Regulator
It used to control the compressed natural gas pressure. The function of pressure regulator is a control valve and reduce the input pressure if a fluid to a desired value at its output. Also, it used to control flow rate. Pressure Regulator have a lot of sensors such as PCM and ECU.
- Electronic Control Module (ECM) of Gasoline
The function of ECM module is used to control the car performance. Such as fuel efficiency, engine performance, gasoline flow rate, emission and ignition time. Also, it solve the different problems of such as troubleshoots problem. Furthermore, it monitors the operation of the vehicle.
- Electronic Control Module (ECM) of Compressed Natural Gas
- The function of ECM module is used to control the car performance. Such as fuel efficiency, engine performance, gasoline flow rate, emission and ignition time. Also, it solve the different problems of such as troubleshoots problem. Furthermore, it monitors the operation of the vehicle.
- Fuel Pump
It transfer fuel from Compressed Natural Gas Tank/ Gasoline Tank to the engine fuel injection system through the fuel lane.
7.3. How Different Shape of Compressed Natural Gas affects the Geometry Efficient
John (1995) stated that different shape of compressed natural gas affects the efficiency. He mentioned using a spherical tank consist of the most geometry efficient in terms of weight. Although a spherical tank geometry efficient of weight, most of the automotive industries preferred cylindrical tank because of cylindrical tank easier to storage in terms of space utilization. Furthermore, he claims the most common volume that automotive industries used around 13 to gallons (50 to 60 liters) and a fuel content of 450 to 550 scf of natural gas at 3000 psi. Moreover, one CNG tank will provide around 100 miles to 150 miles for a vehicle. Fuel efficiency around 20 mpg to 30 mpg respectively.
7.4. The Method to Refuel Compress Natural at Home
The differences between using diesel fuel and compressed natural gas are former can’t refuel at home, but latter can refuel at home. Some fuel company has developed a small slow-fill CNG compressor unit, which can operate in different places. Such as home, office or factory all around the world and it is the latest technology use for light van or light van. This product easy to use, high quality, safe and convenient. According to John (1995) points out CNG refuelling method decrease the vehicle weight, improve fuel efficiency and the most important thing is it reduces the initial cost of a CNG vehicle.
7.5. How does Compressed Natural Gas Work
7.5.1. Compressed Natural Gas Fuel Delivery System
The process by using CNG is similar to the gasoline fuel (as known as diesel fuel). The conventional diesel fuel instead by compressed natural gas (CNG). In the 4-storke diesel engine, the step is intake, compression, power, and exhaust. While the piston rising from bottom dead centre (BDC) to top dead centre (TDC), the fuel injector injects compress natural gas through nozzles before piston arrived at the TDC. Then, it compresses and burns the compressed natural gas. Compressed natural gas have lower boiling point than diesel fuel. Therefore, fuel injector only needs to inject few amount CNG under combustion process. That’s why scientist said using compressed natural gas more efficiency than diesel fuel and biofuel.
7.5.2. Advanced CNG Technology
In recent years, some of the company invent the latest innovation design called ‘’Dual Fuel’’ to apply in the diesel engine.
7.5.3. Work Principle of Dual Fuel
Firstly, in the dual fuel system. Compressed natural gas mixed with air and inject into Intake System.
Secondly, the air-to-compressed natural gas mixture pass through into the cylinder.
Thirdly, diesel fuel injects fuel and mixed with compressed natural gas and drawn into TDC. In this case, the air-fuel ratio depends on diesel fuel and compressed natural gas.
Fourthly, when the piston nearly arrived at the end of the compression stroke (which is at cylinder head (TDC)), diesel fuel injects and ignites, causing the natural gas to burn.
7.5.4. Advantage of Using Dual Fuel
8. EEXPERIMENT METHOD AND PROCDURE
8.5. Diesel fuel test
In diesel fuel test, the work has been done to provide the steps of diesel fuel testing.
Firstly, open CADET V14.4 software
Secondly, run the diesel engine at a constant speed, which is 1200 rpm without load condition
Thirdly, increase the load (Torque) to 50, 100, 200, 300Nm
Fourthly, make sure the engine running under steady conditions for each load and observe the changes of the torque.
Fifthly, increase the speed of the engine to 1400 rpm and repeat this step again. Moreover, apply this step in 1600, 1800 and 2000 rpm.
8.6. Biofuel test
In biofuel test, the work has been done to using some organic material, which including plant material and animal waste to do the test. The Biofuel Test is similar to the diesel fuel test.
Firstly, open CADET V14.4 software
Secondly, run the diesel engine at a constant speed, which is 1200 rpm without load condition
Thirdly, increase the load (Torque) to 50, 100, 200, 300Nm
Fourthly, make sure the engine running under steady conditions for each load and observe the changes of the torque.
Fifthly, increase the speed of the engine from 1000 and repeat this step again. Moreover, apply this step in 1200 rpm, 1400, 1600, 1800 and 2000 rpm until the power value differences become closer.
Sixthly, change the percentage of Biofuel (25%, 50%, 75% and 100%) and 25%, 50% 75% food waste oil have mixed to diesel fuel.
8.7. Mix Fuel Test
In mix fuel test, the work has been done to using food waste oil to do the test. The Mix Fuel Test is similar to the diesel fuel test.
Firstly, open CADET V14.4 software
Secondly, run the diesel engine at a constant speed, which is 1200 rpm without load condition
Thirdly, increase the load (Torque) to 50, 100, 200, 300Nm
Fourthly, make sure the engine running under steady conditions for each load and observe the changes of the torque.
Fifthly, increase the speed of the engine from 1000 and repeat this step again. Moreover, apply this step in 1200 rpm, 1400, 1600, 1800 and 2000 rpm until the power value differences become closer.
Sixthly, change the percentage of food waste oil (25%, 50%, 75% and 100%) and 25%, 50% 75% food waste oil have mixed to diesel fuel.
8.8. How Compressed Natural Gas can be used it in 2 sides (Diesel fuel and Compressed Natural Gas)/ Dual Fuel
8.9. Emission test
In emission test session, the work has been done to use the Vehicle Emission Analysers to analysis Carbon Oxide (CO), Oxygen (O2), Nitrogen Oxygen (NO), (Carbon Dioxide) CO2, Hydrogen Carbon (HC), λ and temperature.
Firstly, turn on the Vehicle Emission Analysers machine and warm up the machine.
Secondly, put the Sampling line into the vehicle exhaust gas system.
Thirdly, switch on the vehicle and forces to the pedal. Then, the Vehicle Emission Analysers machine detect the exhaust gas from the exhaust gas system.
Fourthly, the Vehicle Emission Analysers machine shows the different value of elements (such as CO, CO2 O2, etc). Write down the value from the reader.
Fifthly, repeat the first step to fourth and compare results that have got.
9. DATA ANALYSIS
9.5. Trend of the graphs
9.5.1. Data Analysis of Diesel Fuel Experiment
The work has been done by using Diesel Fuel Experiment to analysis the results. In order to get more accurate results, the experiment has been divided to do 3 times.
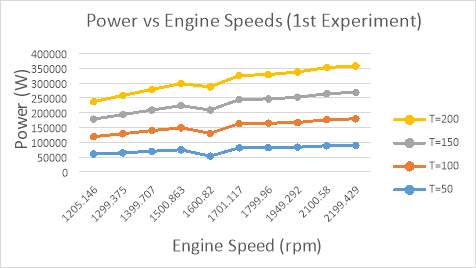
(Graph 1.1a The first experiment result of Power against Engine Speeds)
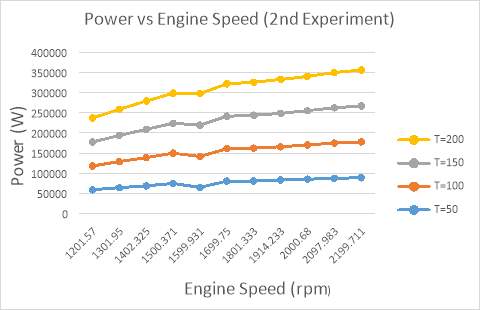
(Graph 1.1b The second experiment result of Power against Engine Speeds)
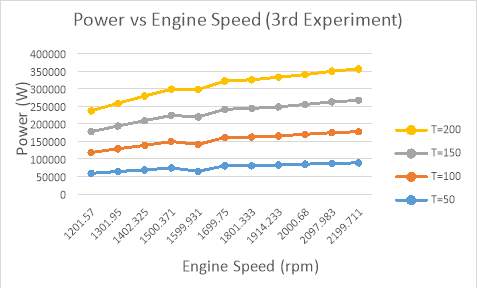
(Graph 1.1c The third experiment result of Power against Engine Speeds)
The annotated graphs revels information about power against engine speeds under different times of experiments. While the engine speeds were increasing, the power were increasing at the same time. Although the experiment did 3 times, the power in these 3 graphs were nearly same under different engine speeds and times. While engine speeds around 1500 rpm to 1600 rpm under different torques, the overall curves decrease slightly during engine speeds 1500 to 1600 rpm. Compare with difficult torque, T=200 had higher increase trend than other torque between engine speeds around 1200 to 2200 rpm.
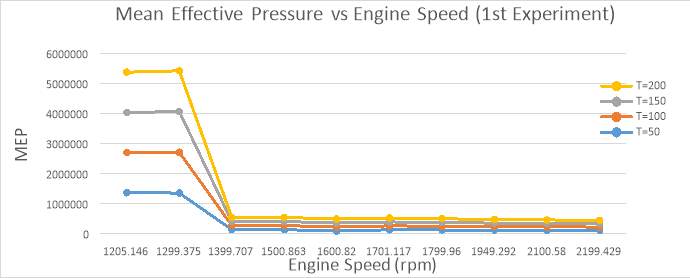
(Graph 1.1d The first experiment result of Mean Effective Pressure against Engine Speeds)
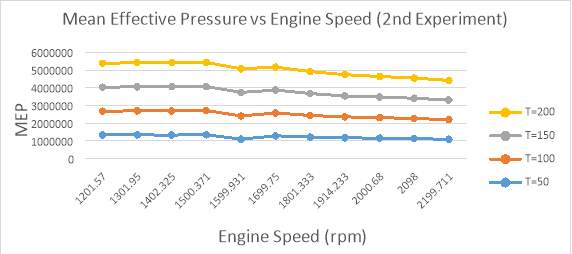 (Graph (Graph 1.1e The second experiment result of Mean Effective Pressure against Engine Speeds)
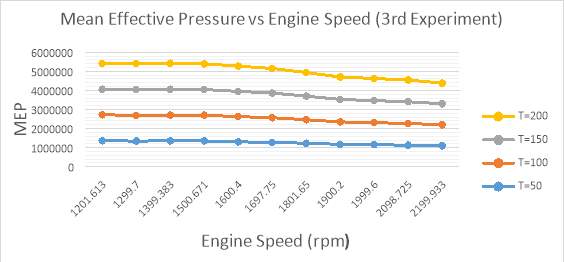 (Graph (Graph 1.1f The third experiment result of Mean Effective Pressure against Engine Speeds)
The annotated graphs showed mean effective pressure against engine speeds under different experiments. 1st experiment have showed the mean effective pressure decreased drastically between around 1200 rpm to 1400 rpm. Compare with 2nd and 3rd experiment, the reason of fell rapidly because of the 1st testing of the diesel machine still in warm up progress. Moreover, compare with 2nd and 3rd experiments, 1st experiment have similar mean effective pressure when the engine speeds around 1400 rom to 2200 rpm under different torques. The overall trends in 2nd and 3rd experiments declined steadily under different engine speeds and torques. Furthermore, compare with 2nd and 3rd experiment, toque 50 of mean effective pressure nearly didn’t change. However, compare with other torques, torque 200 decrease more mean effective pressure than others under different engine speeds.
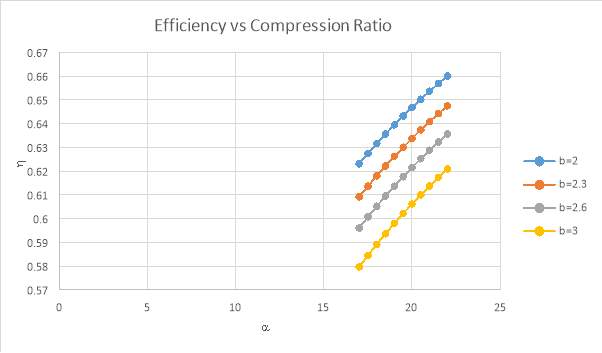 (Graph 1.1g Efficiency against Compression Ratio)
The annotated chart reveals information about efficiency against compression ratio in diesel engine. While the compression ratio increasing, the efficiency was increasing at the same time. Therefore, efficiency is directly to compression ratio. Also, when air standard cycle was rising, compress ratio were decreasing. As a result, air standard cycle is inversely proportional to efficiency and compression ratio.
9.5.2. Data Analysis of Mix Fuel Experiment
In data analysis if mix fuel experiment section, the work has been done to use food waste oil to analysis how different percentage of food wastes oil affect the power and the torque under different engine speeds.
7.1.2.1 25% of Food Waste Oil
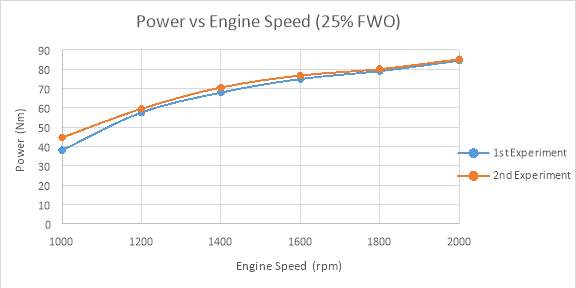 (Graph 1.2a Power against Engine Speed of 25% Food Wade Oil under different Experiment)
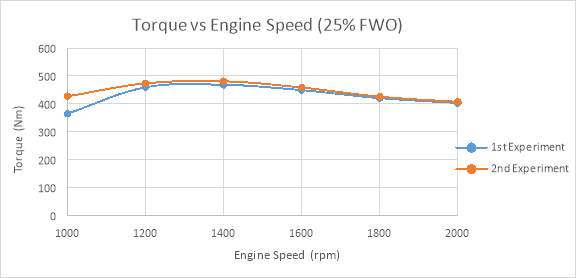 (Graph 1.2b Torque against Engine Speed of 25% Food Wade Oil under different Experiment)
The annotated charts reveal information about how does power and torque affect by the engine speed under 255 food waste oil. In power against engine speed graph (1.2a), while engine speed was increase, the power also increasing at the same time. Therefore, engine speed is directly proportional to the power. Moreover, the 1st and 2nd experiment had the same power value at 1800 rpm and 2000 rpm. The maximum power around 80kW at 2000 rpm. In torque against engine speed graph (1.2b), the overall trend of the graph was decreasing. While engine speed at 1400 rpm, the torque start to drop. It drops from 1400 rpm to 2000 rpm. Also, the 1st experiment and 2nd experiment had the same torque value at 2000 rpm. Therefore, engine speed is inversely proportional to the torque.
7.1.2.2. 50% Food Waste Oil
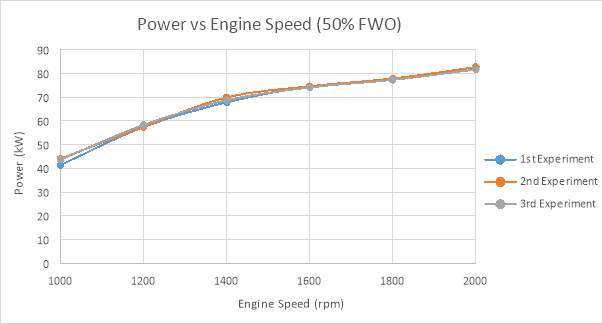 (Graph 1.2c Power against Engine Speed of 50% Food Wade Oil under different Experiment)
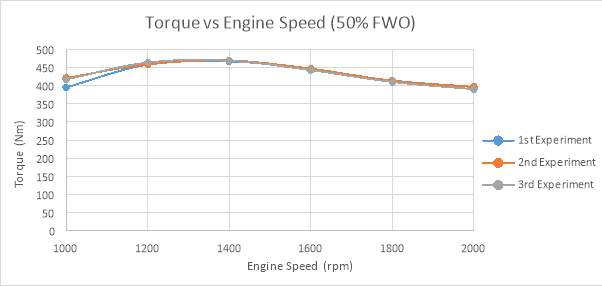 (Graph 1.2d Torque against Engine Speed of 50% Food Wade Oil under different Experiment)
The annotated chart shows information about how does power and toaffect by the engine speed under 50% food waste oil. In power against engine speed graph (1.2c), while engine speed was increase, the power also increasing at the same time. Therefore, engine speed is directly proportional to the power. Moreover, the 1st, 2nd and 3rd experiment had the closer power value at 1200 rpm and 2000 rpm. In torque against engine speed graph (1.2d), the overall trend of the graph was decreasing. While engine speed at 1400 rpm, the torque start to drop. The maximum torque around 460 Nm at 1400 rpm. It dropped from 1400 rpm to 2000 rpm. Also, the 1st experiment, 2nd and 3rd experiment had the similar torque value from 1200 rpm to 2000 rpm.
7.1.2.2.3. 75% Food Waste Oil
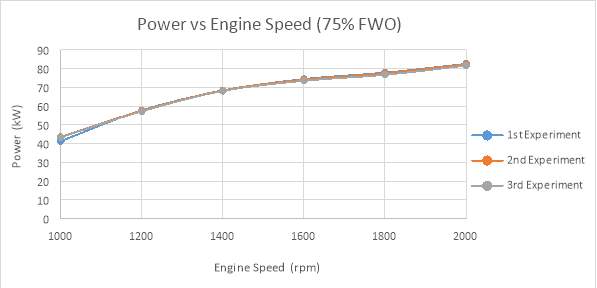 (Graph 1.2e Power against Engine Speed of 75% Food Wade Oil under different Experiment)
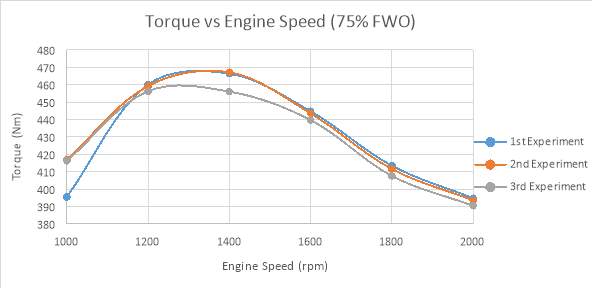 (Graph 1.2f Torque against Engine Speed of 75% Food Wade Oil under different Experiment)
The annotated chart illistruate information about how does power and toaffect by the engine speed under 50% food waste oil. In power against engine speed graph (1.2e), while engine speed was increase, the power also increasing at the same time. Therefore, engine speed is directly proportional to the power. Moreover, the 1st, 2nd and 3rd experiment had the closer power value at 1200 rpm and 2000 rpm. The maximum power around 80kW. In torque against engine speed graph (1.2f), the overall trend of the graph was decreasing. While engine speed at 1400 rpm, the torque start to drop. The maximum torque around 460 Nm at 1400 rpm. It dropped from 1400 rpm to 2000 rpm. Also, the 1st experiment, 2nd and 3rd experiment had the similar torque value from 1200 rpm to 2000 rpm.
7.1.2.2.4. 100% Food Waste Oil
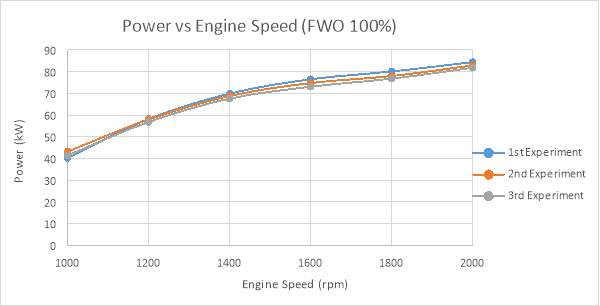 (Graph 1.2g Power against Engine Speed of 100% Food Wade Oil under different Experiment)
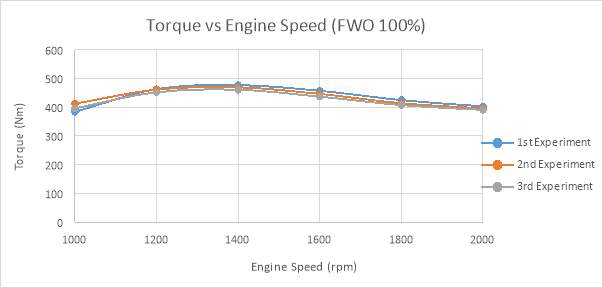 (Graph 1.2h Torque against Engine Speed of 100% Food Wade Oil under different Experiment)
The annotated chart illistruate information about how does power and toaffect by the engine speed under 50% food waste oil. In power against engine speed graph (1.2g), while engine speed was increase, the power also increasing at the same time. Therefore, engine speed is directly proportional to the power. Moreover, the 1st, 2nd and 3rd experiment had the closer power value at 1200 rpm and 2000 rpm. The maximum power around 80kW. In torque against engine speed graph (1.2h), the overall trend of the graph was decreasing. While engine speed at 1400 rpm, the torque start to drop. The maximum torque around 460 Nm at 1400 rpm. It declined from 1400 rpm to 2000 rpm. Also, the 1st experiment, 2nd and 3rd experiment had the similar torque value from 1200 rpm to 2000 rpm.
9.5.3. Data Analysis of Biofuel Test Experiment
9.5.3.1. 50 Corn Oil at 100NM, 200NM and 300NM
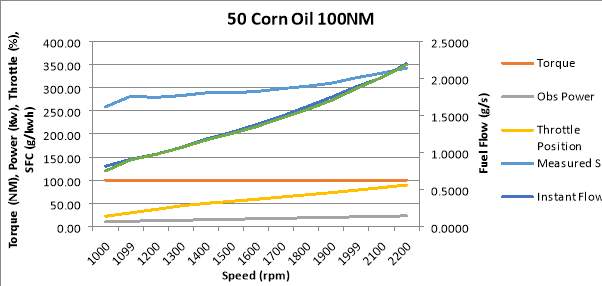
(Figure 2.0 50 Corn Oil at 100NM)
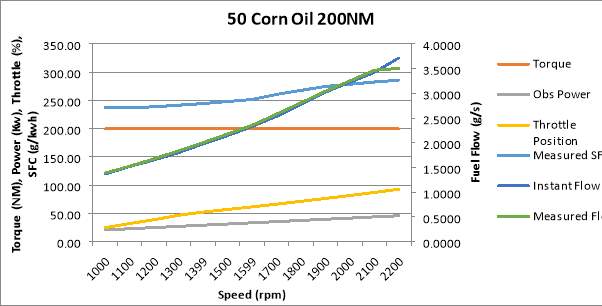 (Figure 2.1 50 Corn Oil at 200NM)
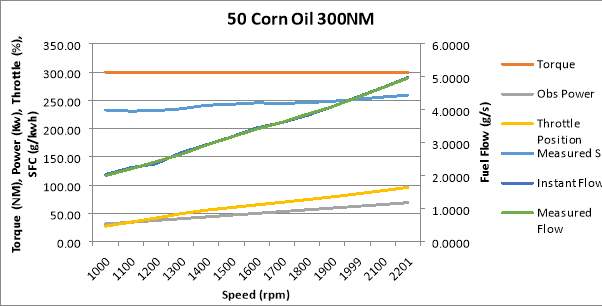
(Figure 2.2 50 Corn Oil at 300NM)
The annotated graphs illustrate the information about of the Corn Oil of torque, power and specific fuel consumption against engine speed under different torque. The torque includes 100NM, 200NM and 300NM respectively. While the engine speed was increasing, the power also climbing at the same time. Moreover, while the engine was rising, the power climbing as well. Therefore, engine speed is directly proportional to engine speed, power and torque value.
In specific fuel consumption, we can see that when the torque at 100MN, it used nearly 350 g/kwh. This value higher than other torque. At torque 200NM, the specific fuel consumption is around 300 g/kwh and 250 g/kwh at 300NM. We can see carefully that while the torque at 300NM, it keeps in constant. To conclude, use higher torque of the corn oil can reduce the specific fuel consumption.
9.5.4. Data Analysis of Emission Test Experiment
The work has been to analysis how different fuels affect emissions under different engine speed.
9.5.4.1. Benchmark 1 at 100MN, 200NM and 300NM
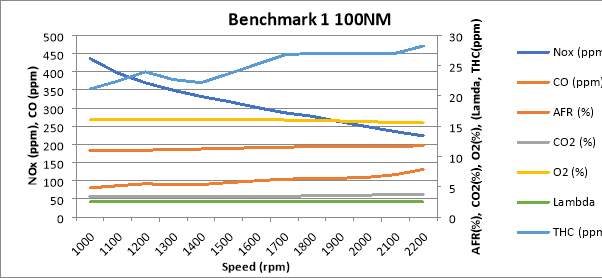
(Figure 2.3a Benchmark 1 at 100NM)
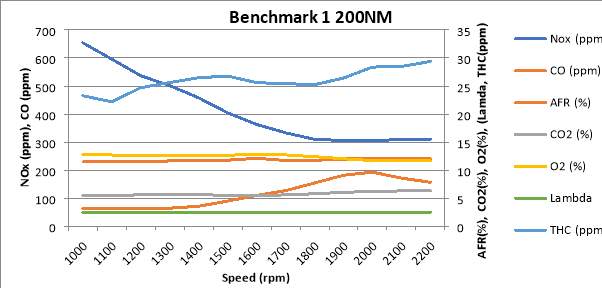
(Figure 2.3b Benchmark 1 at 100NM)
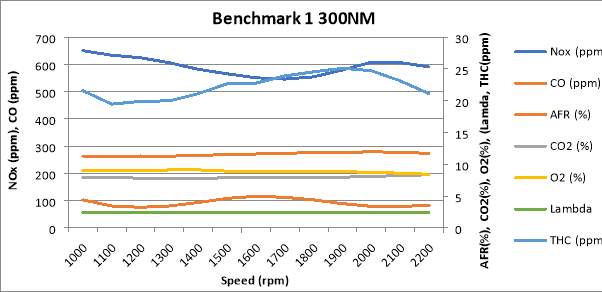 (Figure 2.3c Benchmark 1 at 100NM)
The annotated graphs reveal the information about the emission test of Benchmark under different engine speed. In figure 2.3a and 2.3b, while engine speed was increasing, CO, CO2 and THC were increasing at the same time. Compare with other chemicals, only THF climbing dramatically while engine speed was rising. CO, CO2 and THC are directly proportional to engine speed. In additional, when most of the chemicals were increasing under different engine speed, only NOx was decreasing under different engine speed. Therefore, NOx is inversely proportional to engine speed. In figure 2.3c, the graph was slightly different than figure 2.3a and figure 2.3b. When the engine speed was rising, NOx, THC, O2 were decreasing at the same time.
9.5.4.2. 100 Vegetable Oil at 100NM, 200NM and 300NM
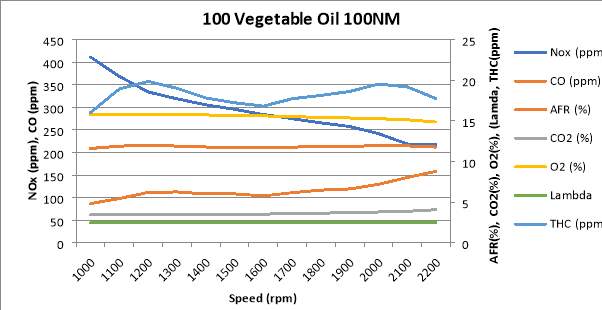 (Figure 2.4a 100 Vegetable Oil at 100NM)
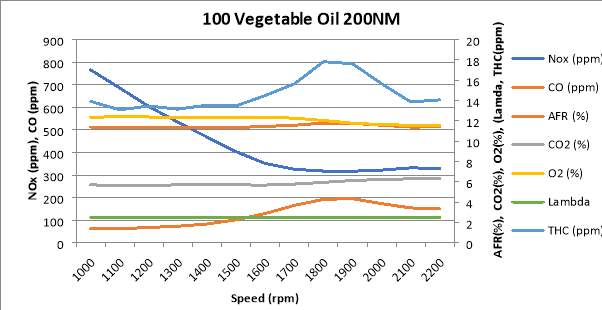 (Figure 2.4b 100 Vegetable Oil at 200NM)
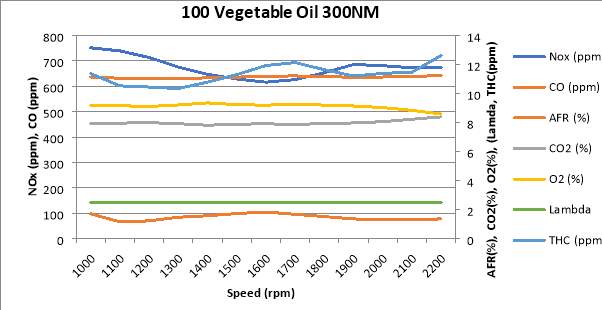 (Figure 2.4c 100 Vegetable Oil at 300NM)
The annotated graphs show the information about the emission test of 100 Vegetable Oil under different engine speed. While the engine speed was climbing, CO, CO2 and THC were increasing simultaneously. Compare with different torques (100NM, 200 NM and 300NM), CO increase dramatically at torque 100NM. When the torque value increase, CO, CO2 and THC value rise at the meantime. Thence, CO, CO2 and THC are directly proportional to engine torque and engine speed.CO2 emit in constant percentage under different torques. Although most of the chemical were increasing under different torque and engine speed, only NOx and O2 were declining. Consequently, NOx and O2 are inversely proportional to different engine speeds and torques.
9.5.4.3. 50 Vegetable Oil at 100NM, 200NM and 300NM
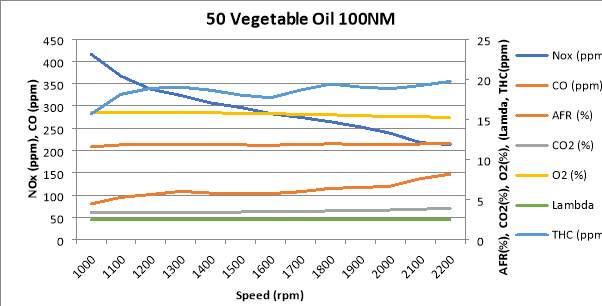 (Figure 2.5a 50 Vegetable Oil at 100NM)
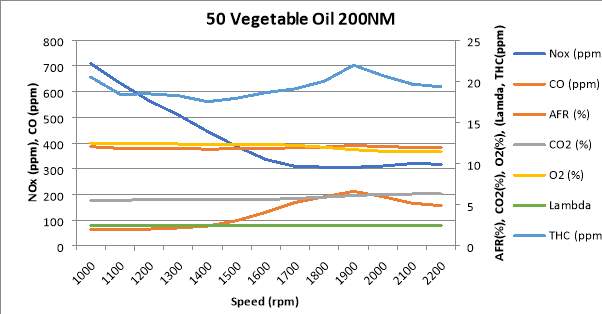 (Figure 2.5b 50 Vegetable Oil at 200NM)
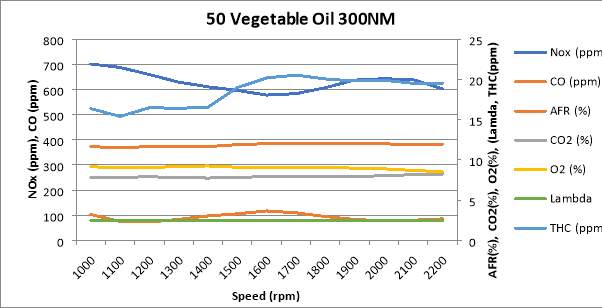 (Figure 2.5c 50 Vegetable Oil at 300NM)
The annotated graphs demonstrate the information about the emission test of 50 Vegetable Oil under different engine speed. When the engine speed was climbing, CO, CO2 and THC were increasing simultaneously. Compare with different torques (100NM, 200 NM and 300NM), CO increase dramatically at torque 100NM. When the torque value increase, CO, CO2 and THC value rise at the meantime. Thence, CO, CO2 and THC are directly proportional to engine torque and engine speed.CO2 emit in constant percentage under different torques. Although most of the chemical were increasing under different torque and engine speed, only NOx and O2 were declining. Consequently, NOx and O2 are inversely proportional to different engine speeds and torques.
9.5.4.4. 100 Sunflower Oil 100NM at 100NM,200NM and 300NM
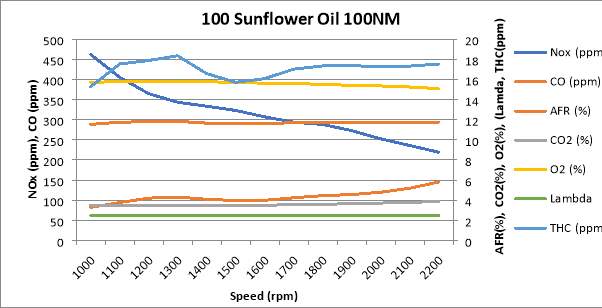 (Figure 2.6a 100 Sunflower Oil at 100NM)
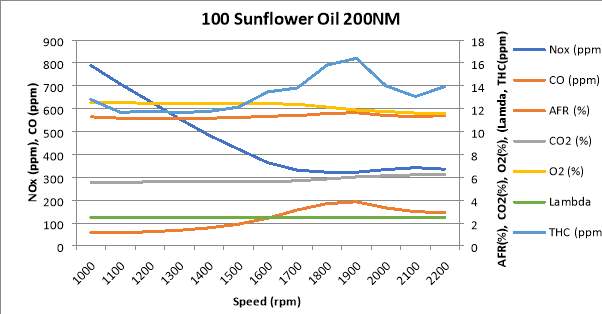 (Figure 2.6b 100 Sunflower at 200NM)
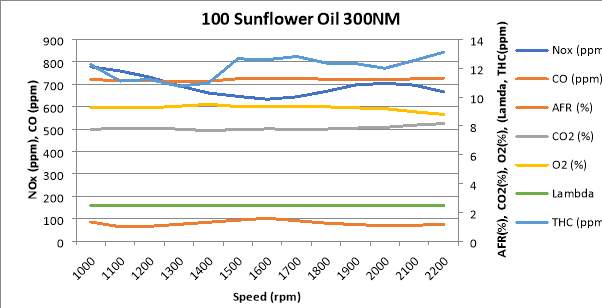
(Figure 2.6c 100 Sunflower Oil at 300NM)
The annotated graphs demonstrate the information about the emission test of 100 Sunflower Oil under different engine speed. When the engine speed was climbing, CO, CO2 and THC were increasing simultaneously. Compare with different torques (100NM, 200 NM and 300NM), CO increase dramatically at torque 100NM. When the torque value increase, CO, CO2 and THC value rise at the meantime. Thence, CO, CO2 and THC are directly proportional to engine torque and engine speed.CO2 emit in constant percentage under different torques. Although most of the chemical were increasing under different torque and engine speed, only NOx and O2 were declining. Consequently, NOx and O2 are inversely proportional to different engine speeds and torques.
9.5.4.5. 50 Sunflower Oil at 100NM, 200NM and 300NM
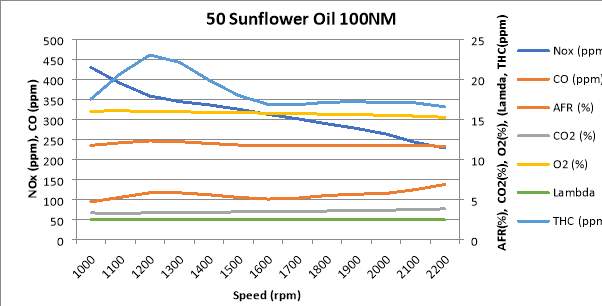 (Figure 2.7a 50 Sunflower Oil at 100NM)
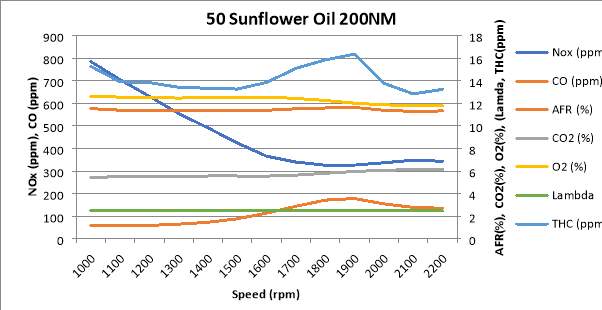 (Figure 2.7b 50 Sunflower Oil at 200NM)
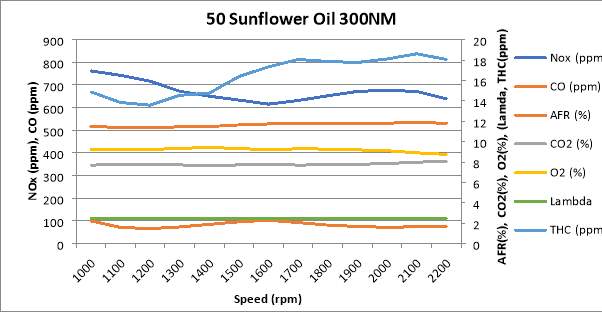 (Figure 2.7c 50 Sunflower Oil at 300NM)
The annotated graphs demonstrate the information about the emission test of 50 Sunflower Oil under different engine speed. When the engine speed was climbing, CO, CO2 and THC were increasing simultaneously. Compare with different torques (100NM, 200 NM and 300NM), CO increase dramatically at torque 100NM. When the torque value increase, CO, CO2 and THC value rise at the meantime. Thence, CO, CO2 and THC are directly proportional to engine torque and engine speed.CO2 emit in constant percentage under different torques. Although most of the chemical were increasing under different torque and engine speed, only NOx and O2 were declining. Consequently, NOx and O2 are inversely proportional to different engine speeds and torques.
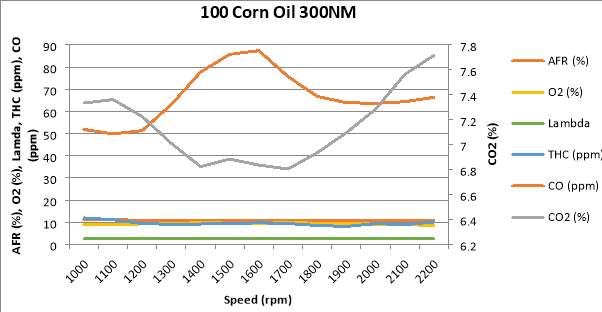
9.5.4.6. 100 Corn Oil at 100NM, 200NM and 300NM
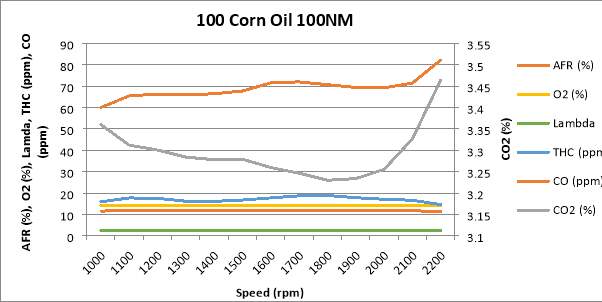 (Figure 2.8a 100 Corn Oil at 100NM)
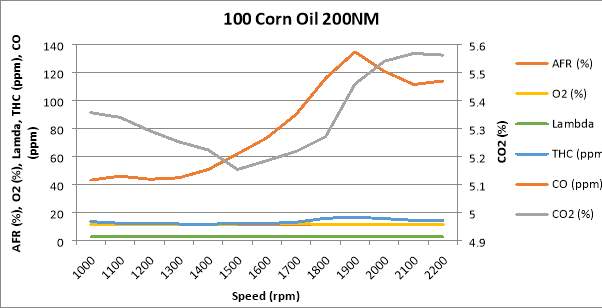 (Figure 2.8b 100 Corn Oil at 200NM)
 (Figure 2.8c 100 Corn Oil at 100NM)
The annotated graphs demonstrate the information about the emission test of 50 Sunflower Oil under different engine speed. When the engine speed was climbing, CO, CO2 and THC were increasing simultaneously. Compare with different torques (100NM, 200 NM and 300NM), CO increase dramatically at torque 100NM. When the torque value increase, CO, CO2 and THC value rise at the meantime. Thence, CO, CO2 and THC are directly proportional to engine torque and engine speed.CO2 emit in constant percentage under different torques. Although most of the chemical were increasing under different torque and engine speed, only NOx and O2 were declining. Consequently, NOx and O2 are inversely proportional to different engine speeds and torques.
9.5.4.7. 50 Corn Oil at 100NM, 200NM and 300NM
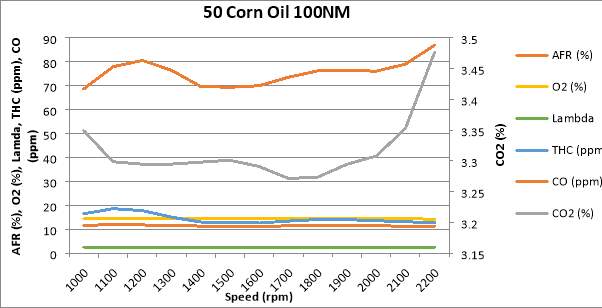 (Figure 2.9a 50 Corn Oil at 100NM)
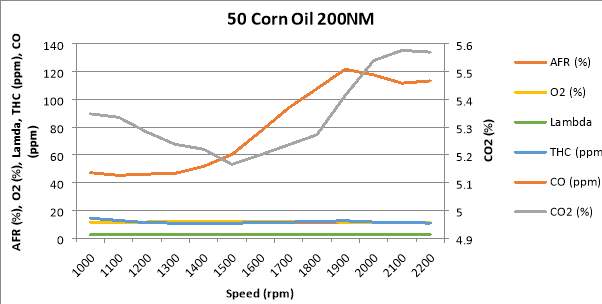 (Figure 2.9b 50 Corn Oil at 200NM)
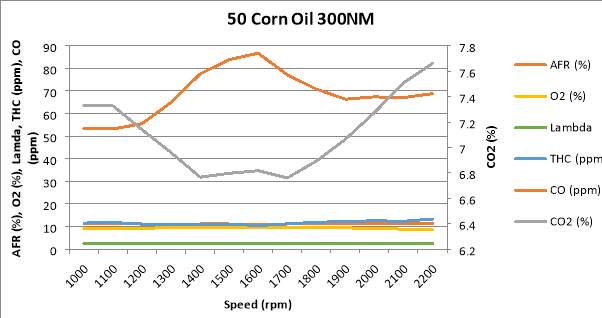 (Figure 2.9c 50 Corn Oil at 300NM)
9.5.4.8. Compressed Natural Gas
- NOx (0.01 g/mi)
- CO (1.70 g/mi)
- NMOG (0.04 g/mi)
10. COMPARISION BETWEEN COMPRESSED NATURAL GAS, BIOFUEL AND DIESEL FUEL
In comparison part, the work has been done to compare with efficiency, power, torque, mean effective pressure, emission, cost and fuel consumption between compressed natural gas, biofuel and diesel fuel.
10.5. Power
In power comparison section, the work has been done to compare alternative fuels, which includes CNG-Diesel, Gasoline-PI and CNG-BI.
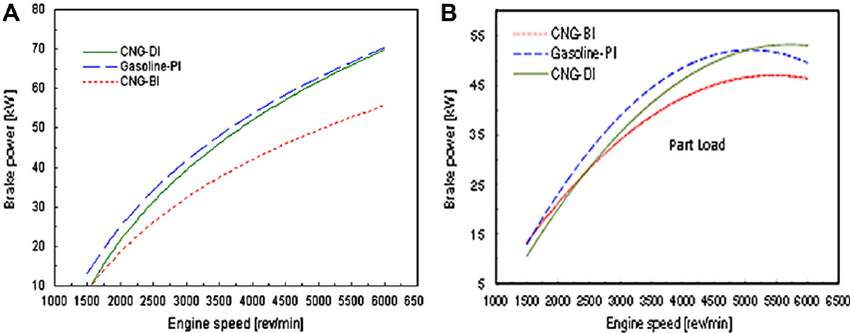
(Graph 3.0 Brake Power against engine speed under alternative fuels)
The annotated graphs (graph A and B) revels information about brake power against engine speed under different alternative fuels (CNG-DI, Gasoline-PI and CNG-BI). In graph A, we can see carefully that while the engine speed was increasing, brake power of these 3 fuels were rising at the same time. But we can see CNG-BI is the lowest brake has lower brake power than Gasoline-PI and CNG-DI. However, CNG-GI (dual- fuel) had lower brake power than Gasoline-PI at the beginning engine speed (from around 1500rpm- around 1600rpm). When engine speed was rising, the brake power of CNG-DI was increasing closer to Gasoline-PI. Although graph B shows same X and Y axis, it slightly different than graph A. This time is in under part load situation. In graph B, CNG-GI (dual- fuel) had lower brake power than Gasoline-PI at the beginning engine speed (from around 1500rpm- around 1600rpm). When engine speed was climbing, the brake power of CNG-DI was increasing over than to Gasoline-PI around 5100rpm. In addition, Gasoline-PI and CNG-DI have same value around 5000rpm. Moreover, we can see carefully that while engine speed at 2200 to 2800. CNG-BI and CNG-DI had same brake power. However, the same thing between graph A and B is CNG-BI have lower brake power under different engine speed. As a result, engine speed is directly proportional to the brake power under different alternative fuels.
10.6. Torque
In torque part, the work has been done to describe how engine speed affects the torque under different alternative fuels.
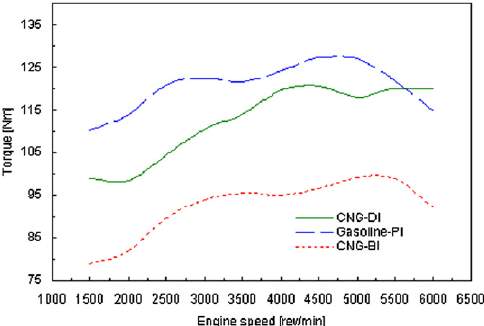
(Graph 3.1 Torque against Engine Speed under Different Alternative Fuels)
The annotated graph shows about torque against engine speed under different alternative fuels (CNG-DI, Gasoline-PI and CNG-BI). We can see that while engine speed was increasing, the torque under different alternative fuels was rising at same. Compare with Gasoline-PI and CNG-DI, CNG-BI has the lowest torque from 2000 rpm to 6000 rpm. Even though Gasoline-PI has higher torque than CNG-GI at the beginning, CNG-DI climb over than Gasoline-PI after 5500 rpm. Also, when the engine speed was increasing, Gasoline-PI and CNG-BI were declining from 4800 rpm-6000 rpm and decreased from 5200 rpm to 6000 rpm separately. Therefore, engine speed is directly proportional to the torque under different alternative fuels.
10.7. Thermal Efficiency
In thermal efficiency section, the work has been done to describe how engine speed affects thermal efficiency under different fuels. Thermal efficiency used to measure the efficiency and completeness of combustion of the fuel.
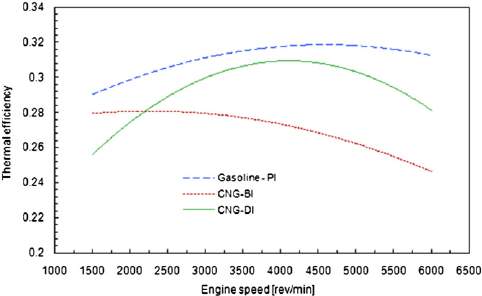
(Graph 3.2 Thermal Efficiency against Engine Speed under Different Alternative Fuel)
The annotated chart reveals information about thermal efficiency against engine speed under different alternative fuels. We can see that while engine speed was increasing, Gasoline-PI was increasing as well during 1500 rpm to 6000 rpm. But CNG-BI and CNG-DI were decreasing at the same time. We can see that CNG-DI start to decrease from 4800 rpm to 6000 rpm and CNG-BI start to drop from 2800 rpm to 6000 rpm. Thence, CNG-DI is inversely proportional to thermal efficiency while engine speed was increasing and Gasoline-PI is directly proportional to thermal efficiency while engine speed was climbing.
10.8. Emission
In emission part, the work has been done to compare CO2 emit with diesel fuel and natural gas, CNG-DI, Gasoline-PI and CNG-BI.
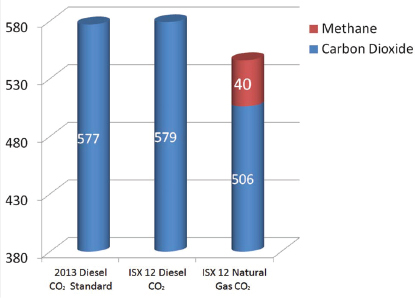
(Figure 3.3 Emission of CO2 between diesel fuel and natural gas)
In figure 3.0, the work has been showed the CO2 emission. We can see that natural gas had lower CO2 emit than diesel fuel. ISX 12 Natural Gas emit 506g CO2 and40 Methane. But ISX 12 Diesel emit 579g and 2013 Diesel Standard emit 577g. The emission of CO2 in these 2 diesel fuels higher than natural gas.
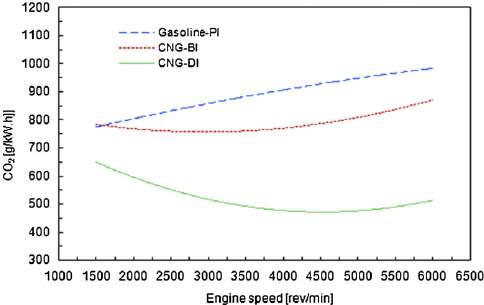
(Graph 3.4 Emission of CO2 against Engine Speed under Different Fuels)
The annotated graph illustrates emission of CO2 against engine speed under different alternative fuels. The overall trends is increasing. But we can see that Gasoline-PI emit the most CO2 overall. At engine speed 6500 rpm, Gasoline-PI emit the highest CO2 than CNG-BI and CNG-DI. CNG-DI emit the lowest CO2 than Gasoline-PI and CNG-BI. While engine speed at 2200 rpm, Gasoline-PI and CNG-BI emit same value of CO2.
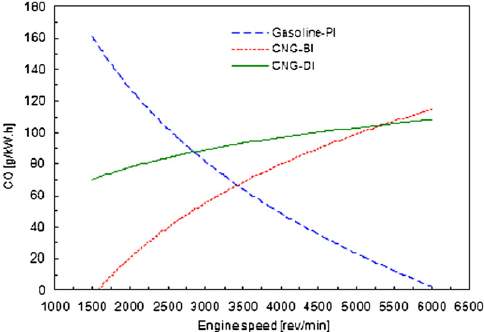
(Graph 3.5 Emission of CO against Engine Speed under Different Fuels)
The annotated chart demonstrates about CO against engine speed under different alternative fuels. We can see that while engine speed was climbing, the emission of CO under CNG-BI and CNG-DI were rising at the same time. Only Gasoline-BI was decreasing. At engine speed 6000 rpm, CNG-BI emit higher CO than CNG-DI. At 5500 rpm, CNG-DI and CNG-BI emit same CO value. Therefore, CNG-BI and CNG-DI are directly proportional to the engine speed and CO and Gasoline-PI is inversely proportional to the engine speed and CO.
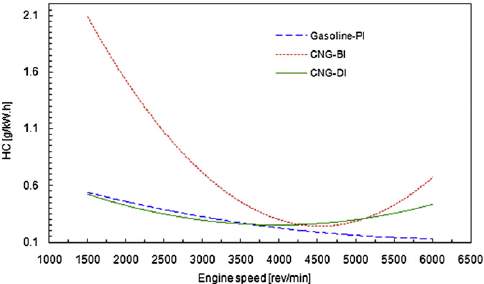
(Graph 3.6 Emission of HC against Engine Speed under Different Fuels)
The annotated chart reveals about HC against engine speed under different alternative fuels. We can see that while engine speed was increasing, HC of CNG-BI and CNG-DI were increasing at the same time. Although both HC value of CNG-BI and CNG-DI at 6000 rpm lower than 1500 rpm, the overall trend still climb. However, Gasoline-PI of HC was dropping while engine speed was increasing. Compare these 3 fuels, Gasoline-PI emit the lowest HC value than CNG-BI and CNG-DI. CNG-BI emit the highest HC than Gasoline-PI and CNG-DI.
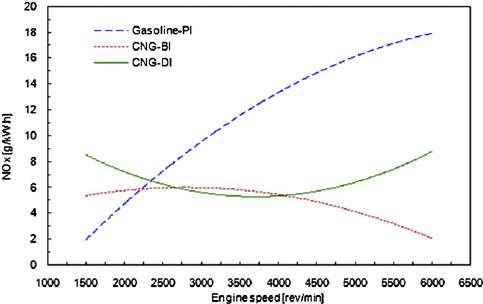
(Graph 3.7 Emission of NOx against Engine Speed under Different Fuels)
The annotated chart illustrates about NOx against engine speed under different alternative fuels. We can see that while engine speed was increasing, NOx of Gasoline-PI and CNG-DI were increasing as well. Although CNG-DI decrease slightly from 1500 rpm -3500 rpm, it increases slowly after 3500 rpm. However, CNG-BI of NOx was dropping while engine speed was increasing. Compare these 3 fuels, CNG-BI emit the lowest NOx value than CNG-BI and Gasoline-PI. Gasoline-BI emit the highest HC than CNG-BI and CNG-DI.
10.9. Cost
| National Average Retail Fuel Prices Conventional and Alternative Fuel, January 2017* | ||||
| Fuel Type | October 2016 | January 2017 | Change in Price October- January | Unit of Measurement |
| CNG | £1.65 | £1.69 | £0.04 | per GGE |
| Biodiesel (B20)[1] | £1.97 | £2.06 | £0.09 | per gallon |
| Biodiesel (B99/B100)[2] | £2.55 | £2.45 | £-0.10 | per gallon |
| Diesel | 1.99 | £2.07 | £0.08 | per gallon |
(Table 3.8 National Average Retail Fuel Prices) Retrieved from http://www.sciencedirect.com/science/article/pii/S0306261908001967
The table 1.3 shows the national average retail fuel price under conventional and alternative fuel by January of 2017. Compare with other alternative fuel, CNG is the lowest fuel prices during October 2016 and January 2017, which £1.65 per GGE in January 2016 and £1.69 per GGE in £1.69 respectively. Compare with diesel fuel and biodiesel of B20 and B99/B100, biodiesel (B20) has lower fuel prices per gallon during October 2016 and January 2017, which 1.97
*Includes public and private stations
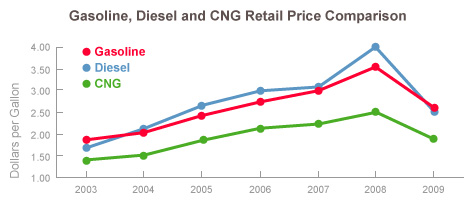
(Graph 3.9 The comparison of alternative fuels per gallon dollars) Retrieved from https://www.socalgas.com/for-your-business/natural-gas-vehicles/benefits
The annotated chart reveals information about the alternative of gasoline, diesel and CNG retail price comparison. Compare with gasoline, diesel and CNG, CNG is the lowest dollars per gallon than other alternative fuels. Even CNG increase steadily from 2003 to 2008 and 2008 is the highest dollars per gallon, but it still lower dollars per gallon than gasoline and diesel fuel. In 2008, diesel fuel is the highest dollars per gallon compare with other 2 fuels.
10.10. Specific Fuel Consumption
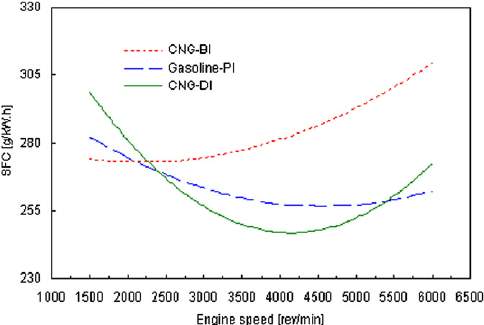
(Graph 4.0 The comparison of SFC against Engine Speed under different fuels)
The annotated graph shows the information about SFC against engine speed under alternative fuels. The overall trends of alternative fuels are increasing. But compare with different fuels, Gasoline-PI used less fuel than others because of increasing fuel conversion efficiency and then started to rising SFC due to climbing frictional effect with increasing engine speed However, CNG-BI used the highest fuel. Gasoline-PI is inversely proportional to SFC and engine speed.
11. RECOMMENDATION
In recommendation section, the work has been done to point out possible error that have made during experiments, suggest some method to increase the accuracy and recommend how to increase the efficiency by using compressed natural gas.
11.5. Possible Error Have Made During Experiments and Suggest Methods Reduce the Error
There have 3 errors affect the results.
The first error that have made is the percentage of mix fuel. In mix fuel experiment, the work has been done to use food waste oil mix with diesel fuel under different percentage. When we mix with different FWO, we can’t make sure the FWO mix with diesel fuel is 25%, 50%, 75% and 100% due to we didn’t use scale container. We only approximately the mix fuel percentage. This method may occur the error. To decrease the error, we can use the scale container.
The second error that have made is the experiment times. While we were doing mix fuel experiment, some of the experiment we did 2 times, some of the experiment we did 3 times. That may affect the accuracy of the results. To increase the accuracy, the work has been done to set the specific times of experiment.
The third error that have made is the significant figures. While we were using experimental result to do calculations, all the answer use 3 significant figures. If we base on significant answer and plot the graphs, it will affect the shapes of the graphs due to rounding significant figures. To decrease the errors. We can use all the significant figures.
11.6. Recommend how to Increase the Efficiency by using Compressed Natural Gas
12. CONCLUSION
12.5. Compressed Natural Gas is the Best Choice
12.6. How does Compressed Natural Gas Affect Our Daily Life
12.7. Prospect and Estimate Compressed Natural Gas in the Future
13. REFERENCE
Kanellos, Michael (2015). ‘’Another Reason Consumers Aren’t Buying Natural Gas Cars’’. Retrieved from https://www.forbes.com/sites/michaelkanellos/2015/05/22/another-reason-consumers-arent-buying-natural-gas-cars/#51a5192679bc
AA1Car. (2006). ‘’Alternative Fuels’’. Retrieved from http://www.aa1car.com/library/alternative_fuels.htm
Cummins. (2016). ‘’Cummins Dual Fuel Engines for Drilling’’. Retrieved from https://cumminsengines.com/dual-fuel
U.S DEPARTMENT OF ENERGY. (2017). ‘’Natural Gas Vehicle’’. Retrieved from http://www.afdc.energy.gov/vehicles/natural_gas.html
BBC NEWS. (2011). ‘’How does a Compressed Natural Gas Kit Work?’’ Retrieved from http://www.bbc.co.uk/news/business-13541930
ADERIBIGBE, ADEYINKA (2016). ‘’Natural Gas as Alternative Vehicular Fuel. Retrieved from http://thenationonlineng.net/natural-gas-alternative-vehicular-fuel/
Susan, Danseyar (2016). ‘’County Buys Diesel Buses as Compressed Natural Gas Sought’’. Retrieved from http://www.miamitodaynews.com/2016/10/18/county-buys-diesel-buses-compressed-natural-gas-sought/
Transport Topics. (2016). ‘’FedEx Recognized for Natural-Gas Fleet Program’’. Retrieved from http://www.ttnews.com/articles/basetemplate.aspx?storyid=43657
Union of Concerned Scientists. (2012) ‘’Uses of Natural Gas’’. Retrieved from http://www.ucsusa.org/clean-energy/coal-and-other-fossil-fuels/uses-of-natural-gas#.WLlZ6k1WKUl
Myths, Rob. (2015). ‘’Dispelling CNG Safety Myths’’. Retrieved from http://www.automotive-fleet.com/article/story/2015/09/dispelling-cng-safety-myths.aspx
Weaver, Lori (2016). ‘’Five Facts to Know About Compressed Natural Gas’’. Retrieved from http://alternativefuels.about.com/od/naturalgasvehicles/a/cngconversion.htm
ClimateTechWiki. (2009). ‘’Compressed Natural Gas (CNG) in Transport’’. Retrieved from http://www.climatetechwiki.org/technology/cng
CNG Fuel System L.P. (2016). ‘’IS CNG SAFE?’’. Retrieved from http://www.oringcng.com/is-cng-safe/
CLEAM AIR POWER. (2015). ‘’How Dual-Fuel Works.’’ Retrieved from http://www.cleanairpower.com/howitworks.html
CNG-ONE,LLC . (2016). ‘’The Benefits of Compressed Natural Gas (CNG) Vehicles.’’ Retrieved from http://www.cng-one.com/info/benefits.asp
QUESTAR Gas. (2017). ‘’The Advantages of Natural Gas Vehicles.’’ Retrieved from https://www.questargas.com/ngv/web/AdvantagesofCNG.php
Harris , William. (2016). ‘’How Natural-Gas Vehicles Work.’’ Retrieved from http://auto.howstuffworks.com/fuel-efficiency/alternative-fuels/ngv3.htm
REL. (2016). ‘’Conformable Compressed Natural Gas Tank.’’ Retrieved from http://www.relinc.net/advanced-materials/conformable-natural-gas-tank/
Gasfill. (2016). ‘’Gasfill.’’ Retrieved from http://gasfill.com/
Jeff , Youngs. (2012). ‘’How Natural Gas Fuel Powered Cars Work.’’ Retrieved from http://www.jdpower.com/cars/articles/safety-and-mpg/how-natural-gas-fuel-powered-cars-work
CNGCENTER. (2016). ‘’CNG Home Refueling Station.’’ Retrieved from http://cngcenter.com/cng-equipment/cng-home-refueling-station/
PGNiG. (2017). ‘’Natural gas as environmentally friendly fuel.’’ Retrieved from http://en.pgnig.pl/natural-gas-as-environmentally-friendly-fuel
Weaver, Lori. (2016). ‘’Five Facts to Know About Compressed Natural Gas.’’ Retrieved from http://alternativefuels.about.com/od/alternativefuels101/a/Five-Facts-To-Know-About-Compressed-Natural-Gas.htm
CHEMISTRY LibreTexts. (2016). ‘’Carnot Cycle ‘’.Retrieved from https://chem.libretexts.org/Core/Physical_and_Theoretical_Chemistry/Thermodynamics/Thermodynamic_Cycles/Carnot_Cycle
BBC News. (2011). ‘’Fractional distillation.’’ Retrieved from http://www.bbc.co.uk/schools/gcsebitesize/science/aqa_pre_2011/rocks/fuelsrev3.shtml
McKinsey (2016). ‘’What is the effect of the cut-off ratio on the thermal efficiency of a diesel engine?’’ Retrieved from https://www.quora.com/What-is-the-effect-of-the-cut-off-ratio-on-the-thermal-efficiency-of-a-diesel-engine
WONG (2005). ‘’COMPRESSED NATURAL GAS AS AN ALTERNATIVE FUEL IN DIESEK ENGINE’’ University of Sothern Queensland
SAE INTERNATIONAL (2011). ‘’Compressed Natural Gas.’’ Retrieved from http://topics.sae.org/compressed-natural-gas/papers/?pg=4
Evans Eliza. (2008). ‘’Compressed Natural Gas (CNG).’’ Retrieved from http://forecasting.tstc.edu/techbriefs/compressed-natural-gas-cng/
Wei Lijiang. & Geng Peng. (2016). ‘’A review on natural gas/diesel dual fuel combustion, emissions and performance.’’ Retrieved from https://www.researchgate.net/figure/283522119_fig3_Fig-2-The-schematic-diagram-of-high-pressure-direct-injection-system-Fig-3-The
JEFF YONGS (2012). ‘’How Natural Gas Fuel Powered Cars Work.’’ Retrieved from http://www.jdpower.com/cars/articles/safety-and-mpg/how-natural-gas-fuel-powered-cars-work
CNGS (2017) ‘’Compressed Natural Gas’’. Retrieved from http://www.cngas.co.uk/
VEOLIA (2017) ‘’Compressed Natural Gas Vehicles.’’ Retrieved from http://www.veolia.co.uk/sheffield/what-happens-your-waste/what-happens-your-waste/compressed-natural-gas-vehicles
Ben, Wijdyla (2012) ‘’Should You Convert Your Car to Natural Gas?’’ Retrieved from http://www.popularmechanics.com/cars/how-to/a7487/should-you-convert-your-car-to-natural-gas/
NGV SOLUTIONS. (2016). ‘’Frequently Asked Questions About Compressed Natural Gas.’’ Retrieved from http://www.ngvsolutions.com/faqs
NGVAMERICA (2014).’’ A Comparison of Compressed Natural Gas and Propane.’’ Retrieved from http://www.ngvamerica.org/pdfs/CNG_LPG_4.23.14.pdf
Jon Andersson (2011) ‘’BIOFUEL EFFECTS ON DIESEL PERFORMANCE EMISSIONS AND ECONOMY IN CONVENTIONAL AND ADVANCE TECHNOLOGIES’’ Ricardo UK Ltd
U.S DEPARTMENT OF ENERGY (2014) ‘’Case Study-Compressed Natural Gas Refuse Fleets’’. Retrieved from http://www.afdc.energy.gov/uploads/publication/casestudy_cng_refuse_feb2014.pdf
International Energy Agency. (2010). ‘’The Contribution of Natural Gas Vehicles to Sustainable Transport.’’ Retrieved from http://www.indiaenvironmentportal.org.in/files/natural_gas_vehicles.pdf
Argonne National Laboratory . (2010). ‘’Natural Gas Vehicles: Status, Barriers, and Opportunities’’. Retrieved from http://www.afdc.energy.gov/pdfs/anl_esd_10-4.pdf
http://www.greenfacts.org/en/biofuels/l-2/1-definition.htm
http://www.afdc.energy.gov/fuels/prices.html
http://www.worldwatch.org/biofuels-make-comeback-despite-tough-economy
http://inhabitat.com/new-biofuel-from-wastewater-slashes-vehicle-co2-emissions-by-80/
14. APPENDIX
14.5. Gantt Chart
14.6. Pictures of latest Compressed Natural Gas vehicles design
[1] Biodiesel B20 is a blend of 20% biodiesel and 80% petroleum diesel
[2] Biodiesel B99/B100 its pure from (B100) or blended with petroleum diesel
Cite This Work
To export a reference to this article please select a referencing stye below:
Related Services
View all


Related Content
All TagsContent relating to: "Sciences"
Sciences covers multiple areas of science, including Biology, Chemistry, Physics, and many other disciplines.
Related Articles

DMCA / Removal Request
If you are the original writer of this dissertation and no longer wish to have your work published on the UKDiss.com website then please: