Wind Turbine Site Feasibility Report
Info: 8749 words (35 pages) Dissertation
Published: 10th Dec 2019
Tagged: Civil EngineeringEnergy
Table of Contents
2.2.1 Wind Speed at Various Heights
2.3 Variation in wind speed with location
2.4 Variation of wind speed with time
3.2 Kingspan 6 kW turbine specifications
4.1.1 C&F 6kW turbine calculations
4.1.2 Kingspan 6kW turbine calculations
List of Figures
Figure 2‑1 Hook Lighthouse Satellite Image
Figure 2‑2 Proposed Turbine Location
Figure 2‑3 Height vs Wind speed at different heights
Figure 2‑6 Wind speed varying with location
Figure 2‑7 Wind Speed varying with location
Figure 2‑8 Wind Speed varying with location
Figure 2‑9 Wind Speed Frequency 20m
Figure 2‑10 wind Speed Frequency 30m
Figure 2‑11 Weibull vs Extract Data 20 m
Figure 2‑12 Weibull vs Extract Data 30 m
Figure 2‑13 Rosslare Wind Rose
Figure 2‑14 Roughness Class chart
Figure 2‑15 Obstacles near site
Figure 2‑16 Wind Speed Calculator
Figure 2‑17 Wind Energy Calculator
Figure 2‑19 Site location and wind rose
Figure 2‑20 Lighthouse effect on wind speed
Figure 2‑21 Lighthouse effect on wind energy
Figure 5‑2 C&F Power Coefficient
Figure 5‑3 Kingspan 6 kW Power Curve
List of Tables
Table 2‑1 Wind speed at various heights 400 metres
Table 2‑2 Tower height vs Wind speed 600 metres
Table 4‑1 C&F 6 kW turbine specifications
Table 4‑2 Kingspan 6kW specifications
Table 7‑2 Excel Data for 30 metres
Table 7‑3 SEAI Wind Atlas Extract Frequency
1 Introduction
This report focuses on the feasibility of a small-scale wind turbine at a specific site and the potential benefit installing the turbine would have on the energy demand. The turbine will produce electrical power which will run the instrumentation, lighting and other power consuming electronics at the site. In this report, there will be an evaluation of the wind resource and obstacles at a chosen location. This will help determine if it would make economic sense to erect a turbine, which would deliver a proportion of the site’s energy demand.
1.1 Site Location
The site evaluated was Hook Lighthouse which is located 1.5 km from Churchtown on the Hook peninsula in Co. Wexford.

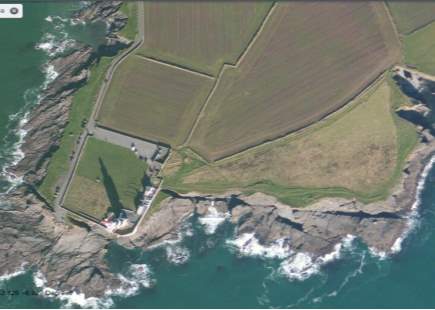
Hook Lighthouse & cafe
Figure 1‑1 Hook Lighthouse Satellite Image (SEAI, 2017)
Hook Lighthouse is vital to local marine traffic as it guides vessels passing in the shipping lanes between the tip of the Hook Peninsula and Dunmore East 5Km away. There was instrumentation within the lighthouse such as sonar technology which guides the passing ships. There was also a large rotating light at the top of the tower which flashes every 30 seconds with a range of 23 nautical miles. If there were to be a problem with the network, it could take hours for a technician to respond as the lighthouse is an hour from any major town. The lighthouse is in constant use, it is essential that it is in operation all year round. Therefore, the installation of a small turbine would be beneficial. The energy generated could be utilised for the visitor centre & café which are situated close to the base of the lighthouse.
1.1.1 Proposed sites
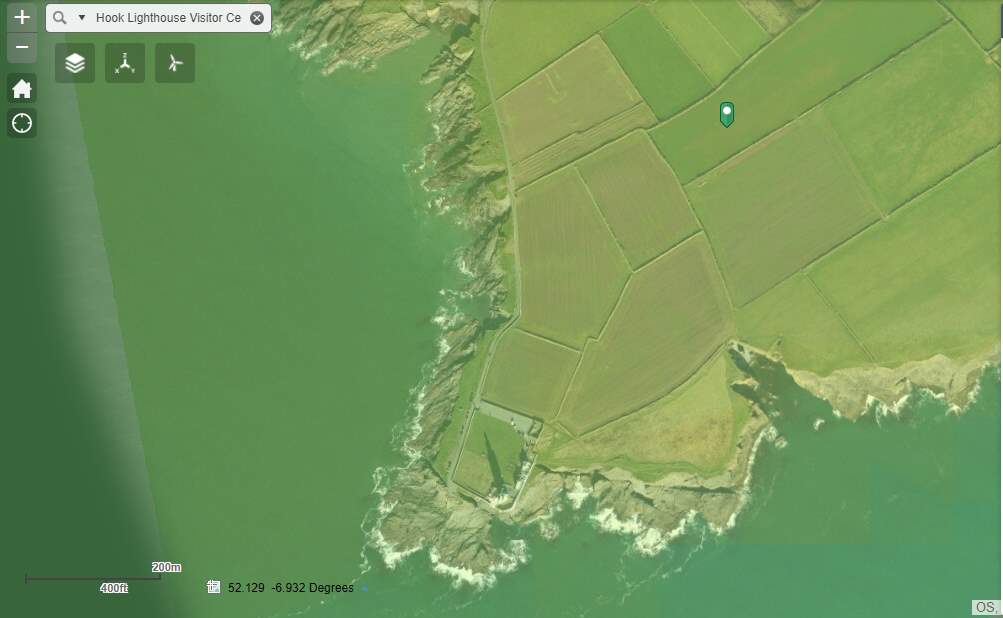
There was a very good wind resource at the selected location. There were two proposed sites for the turbine, both of which were further back from the lighthouse tower at 400 and 600 metres. This was to avoid turbulence caused from the lighthouse tower, and the cliffs. Also, the turbine would have had a visual impact on the lighthouse and surrounding scenery.
It may also have been met with objections from locals and the heritage office as Hook Lighthouse is a very popular tourist attraction and the turbine could have had impacted on this.


600m
400 m
Figure 1‑2 Proposed Turbine Location (SEAI, 2017)
The obstacles closest the turbine sites were the hedges which ran along the fields. These hedges were 3.5 metres wide and 3 metres in height, and ran 177 and 450 metres in length. The proposed site was 50 metres from either side of the hedge. This was to allow the turbine to overcome the turbulence of the hedge which would have affected the wind speed and power.
2 Wind Resource
At both sites there was an excellent wind speed which was above 8m/s. The roughness class of the area would be 2.5 as it was relatively flat with only a few trees. The wind speed was recorded over a range of 30 metres. There was very little variation in wind speed across the height range, the results are recorded in the table below.
Table 2‑1 Wind speed at various heights 400 metres
| Tower height (m) | Wind speed (m/s) |
| 20 | 8.10 |
| 30 | 8.40 |
| 40 | 8.60 |
| 50 | 8.80 |
Table 2‑2 Tower height vs Wind speed 600 metres
| Tower height (m) | Wind speed (m/s) |
| 20 | 8.20 |
| 30 | 8.40 |
| 40 | 8.60 |
| 50 | 8.80 |
(SEAI, 2017)
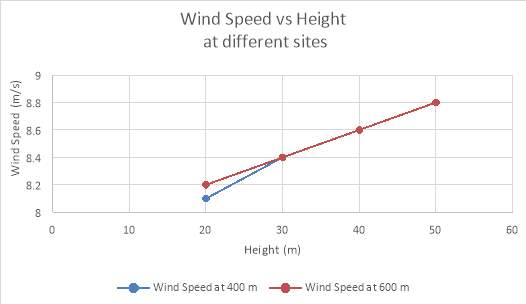
Figure 2‑1 Height vs Wind speed at different heights
As the table and graph above illustrate, there was little increase in wind speed at 600 metres compared to a large increase in height, for every 10m in height of the tower the wind speed rose linearly by 0.2 m/s. However, there was only a 0.1 difference in wind speed at 20 metres at a distance of 400 metres. For the other heights is was the same as 600 metres.
2.1.1 Wind Speed at Various Heights
The wind speed at 20 metres was very good at 8.2 m/s. Planning permission would be required however as the total height was above 20 metres.
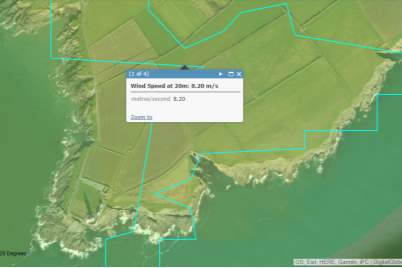
Figure 2‑2 Wind speed at 20m (SEAI, 2017)
As the height increased to 30 metres, the wind speed increased by 0.2m/s.The turbine was visible from a further distance which made it harder to obtain planning.
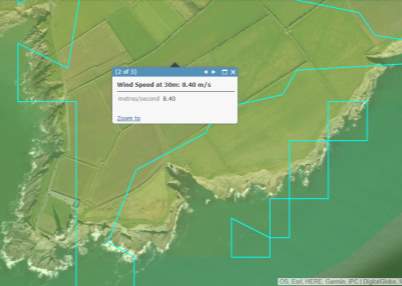
Figure 2‑3 Wind speed at 30m (SEAI, 2017)
Having also analysed heights of 40 and 50 metres, it was noted that the wind speed increased by 0.2m/s with each increase of 10metres in height.
From analysing the wind speeds across the various heights and distances, it would make sense to erect a turbine at 20 metre hub height. At this height planning permission would not be required. The 20 metre turbine height is also less visible from a distance which would lower the risk of objections from local residences.
2.2 Variation in wind speed with location
There was very little variation in the wind speed across three different locations. At a height of 20 metres the wind speed only varied by 0.2 m/s, each location was roughly 100 metres from each of the others. This variation of 0.2 m/s was very small change with respect to the distance. The wind speed slightly increased the closer to the cliff edge. However, the closer to the cliffs, the more the wind was affected by turbulence coming off the cliffs.
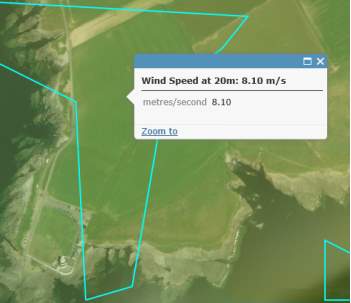
Figure 2‑4 Wind speed varying with location (SEAI, 2017)
This location was optimum as the 8.2 m/s wind speed was excellent at 20 metres and it was located further back from the cliff edge than the last location.
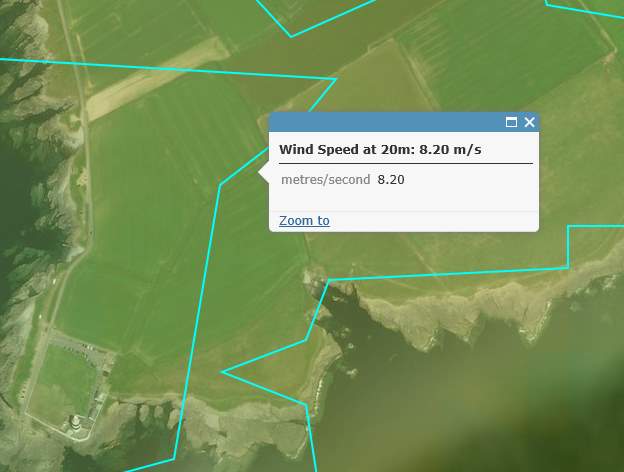
Figure 2‑5 Wind Speed varying with location (SEAI, 2017)
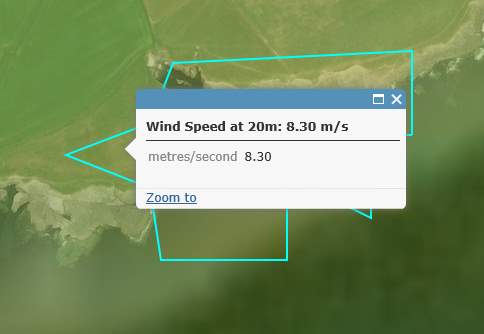
Figure 2‑6 Wind Speed varying with location (SEAI, 2017)
2.3 Variation of wind speed with time
The wind speed varied over the course of the year, some wind speeds occurred frequently where as others rarely occurred at all. The distribution below shows how frequently different wind speeds occurred at a height of 20 metres. The most frequent wind speeds occured between 5 and 8 m/s with the most recurrent wind speed at 6 m/s with a frequency of 874.80 hours per year. The higher the wind speed the less frequently it occurred, the amount of hours in which the wind speed was 25 m/s and above was practically zero.
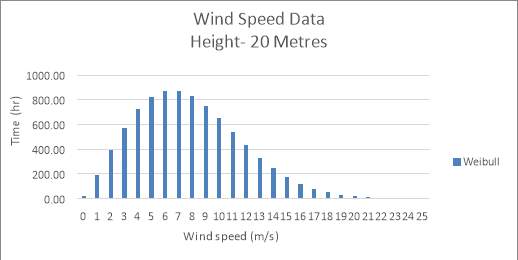
Figure 2‑7 Wind Speed Frequency 20m
The higher the hub height, the more frequent the higher wind speeds occurred. This was due to height, the closer to the ground the more the wind was affected by wind shear. By increasing the height of the turbine by 10 metres, it resulted in the lower wind speeds occurring less frequently as the effect of wind shear was reduced. At the height of 30 metres the wind speed between 5 and 8 m/s occurred less often. The most frequent wind speed is 7 m/s which occurred for 841.10 hours over the course of the year. The higher wind speed frequencies also occurred more frequently at 30 metres, 567.74 hours compared to 540.74 hours at 20 metres. However, 30 metres was not high enough to see wind speeds of 25 m/s occurring more frequently. Such wind speeds only occur during storm like conditions.
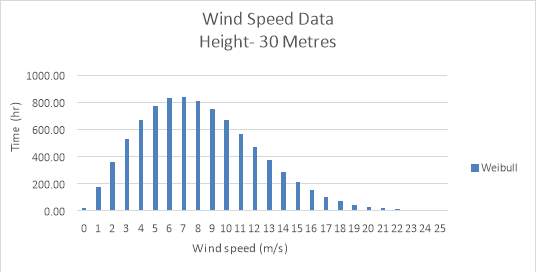
Figure 2‑8 wind Speed Frequency 30m
To get the exact wind speed frequency at 20 and 30 metres, the wind data was downloaded from the SEAI Wind Atlas. This allowed the exact frequency of the wind at the proposed sites to be graphed.
The SEAI Wind Atlas data shows that 6 m/s was still the most frequent wind speed at 20 metres but it occurred almost 200 hours more than the Weibull distribution estimated. The wind speeds of 7 & 8 m/s were also dramatically more frequent than their Weibull estimates. The lower wind speeds of 1-4 m/s occurred less frequently than that which occurred in the Weibull distribution. The higher speeds of 17-19 m/s saw a large increase compared to the Weibull and the higher wind speeds of 21-25 m/s slightly increased although they were still very rare to occur.
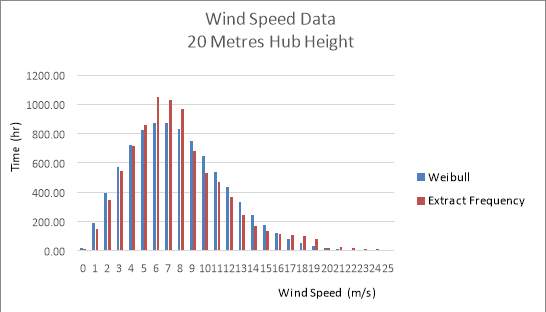
Figure 2‑9 Weibull vs Extract Data 20 m
There was a major difference between the exact frequency of the wind speeds between 20 and 30 metres. 6 m/s was the most frequent wind speed at 20 metres and 7 m/s occurred the most at 30 metres, the graph shows that 6 m/s occurred more frequently at 30 metres than 7 m/s. The Weibull distribution almost mirrored the exact frequency at the lower wind speeds of 1-4. Although the Weibull was generous in medium wind speeds, 9-16 m/s occurred much less than estimated.
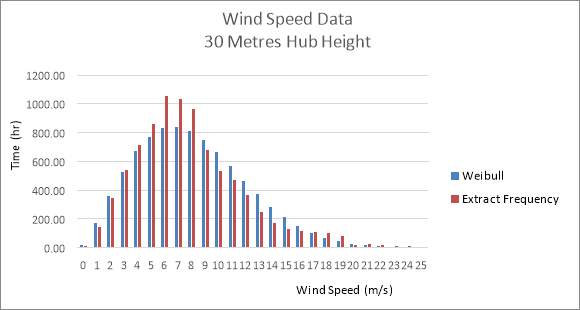
Figure 2‑10 Weibull vs Extract Data 30 m
2.4 Wind Rose
A wind rose is a visual representation of distributions of wind speeds and the frequency of the varying wind directions. The wedges give the relative frequency of each of the 12 wind directions, the percentage of the time is the wind blowing from that direction. The colours within the wedges give the percentage of time which the wind blew in each speed range in each direction. The closest met station to the proposed site is Rosslare, this was the wind rose for the station.
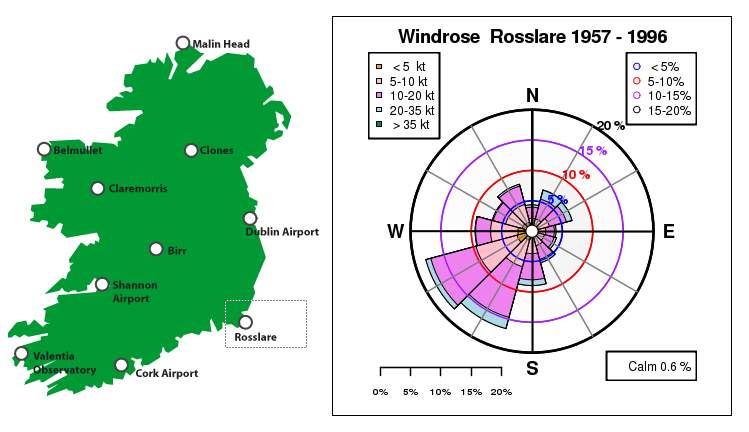
Figure 2‑11 Rosslare Wind Rose (Met Eireann , 2017)
The wind blew from south west 18% of the time. The wind blowing from the south west was between 20-35 kt for roughly 1% of the time and 10-20 kt 5% of the time. There was very little wind variation from south east. If there were obstacles in the south-east section they would have had little to no effect on the turbine whereas obstacles in the south west section would have had a heavy effect on the turbine as they would have caused turbulence of the wind.
2.5 Obstacles
There were numerous obstacles which would have affected the wind speed and the wind energy at the site. The obstacle which affected the wind speed the greatest was the lighthouse. The other obstacles were hedges and the costal cliffs which ran either side of the peninsula. The site was roughly 300 metres from either of the cliffs. Besides the small hedges, the land around the turbine site was relatively flat which, taking the chart below into consideration, gave both sites a roughness class of around 2.5. There were very little dwellings or structures around the proposed sites.
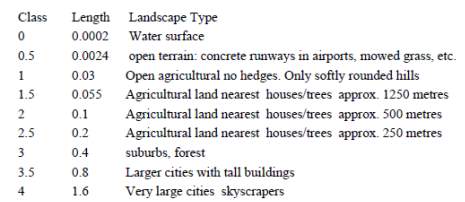
Figure 2‑12 Roughness Class chart
2.5.1 Hedges
The area around both turbine sites were largely flat fields which had small dense hedges separating each field. These hedges were roughly 3.5 metres thick and 2 metres in height. In each case the turbine was to be located approximately 50 metres away from each of the hedges which surrounded the fields. This gave enough distance for the wind speed and wind energy to not be affected by the turbulence caused by the hedge.


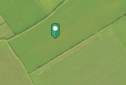
50 m
93 m
Figure 2‑13 Obstacles near site (SEAI, 2017)
The shade calculators below show that the hedges did not affect the wind speed and wind energy of the turbine at a hub height of 20 metres. The distance the turbine was situated from each of the obstacles reduced the effect on the wind speed. At 50 metres from the obstacle the wind speed is 100% of the wind speed if the obstacle was not there for both sites.
The turbine would need to be at a height of 11 metres and 50 metres, for any effect on the wind speed. 1% of the wind speed was lost had the obstacle not been there. You would have to be 18 metres and a height of 2 metres to see a change in wind speed, the wind speed would be 62% of the undisturbed wind speed.
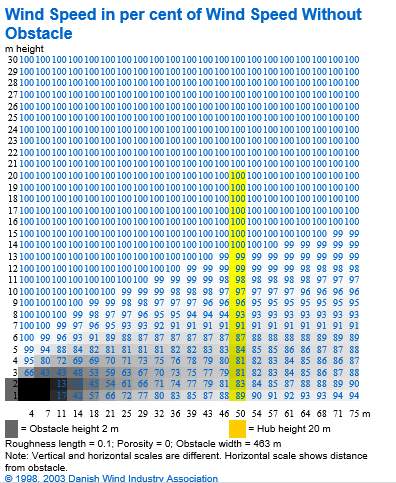
Figure 2‑14 Wind Speed Calculator (Danish Wind Industry Association, 2017)
Parameters:
Obstacle Height- 2 metres
Roughness Class- 2.5
Hub Height- 20 metres
Obstacle Width- 463 metres
Distance to turbine- 50 metres
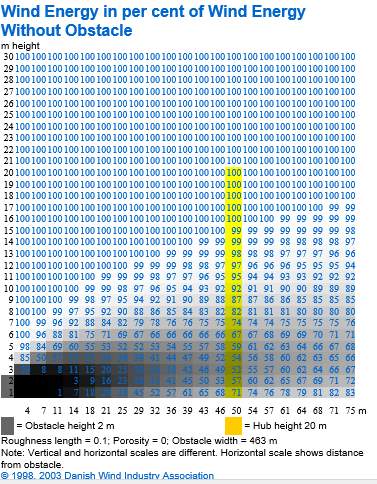
Figure 2‑15 Wind Energy Calculator (Danish Wind Industry Association, 2017)
Parameters:
Obstacle Height- 2 metres
Roughness Class- 2.5
Hub Height- 20 metres
Obstacle Width- 463 metres
Distance to turbine- 50 metres
2.5.2 Lighthouse
The closest object to the proposed turbine sites which affected the wind speed and energy was the lighthouse itself. The structure stands 35 metres high and is approximately 8 metres in width. As seen from the wind rose, the wind blows most frequently from south-west which in this case is the direction of the lighthouse.
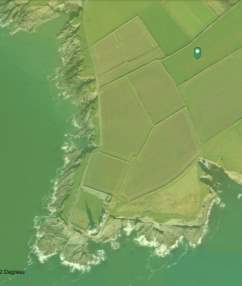
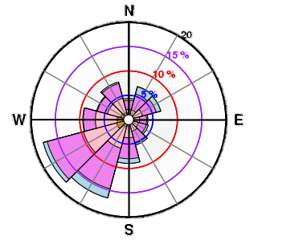
Figure 2‑16 Site location and wind rose
The obstacle was 35 metres in height, 15 metres higher than the turbine hub height. This resulted in there being a 1% loss in wind speed which would not have happened if the lighthouse was not there.
The loss in wind energy was also minute, for the same parameters there was only a 2% loss in energy due to the obstacle at 600 metres and a 4% loss in energy at the 400 metre site.
To recover the lost percentage in wind speed at a height of 20 metres, the turbine would need to be moved back 86 metres to overcome the turbulence coming off the lighthouse. The turbine site at 400 metres had the same percentage loss as the one at 600 metres. It made sense therefore to move and erect the turbine at the closer site of 400 metres from the lighthouse. Although this would reduce the cost of cabling, it does not improve the wind speed, 1% would still be lost.
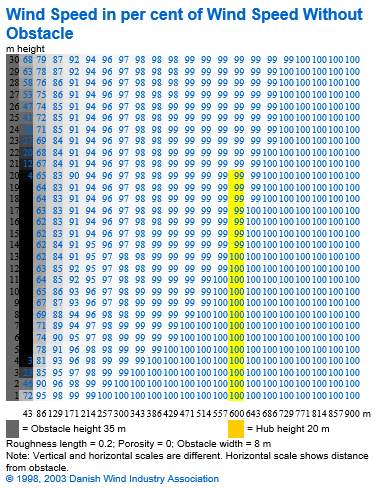
Figure 2‑17 Lighthouse effect on wind speed (Danish Wind Industry Association, 2017)
Parameters:
Obstacle Height- 35 metres
Roughness Class- 2.5
Hub Height- 20 metres
Obstacle Width- 8 metres
Distance from turbine- 600 metres
There was no practical way to recover the 2% energy lost due to the obstacle. Moving the turbine site back 300 metres only resulted in a 1% increase in energy. The turbine would have to be 900 metres back and a hub height of 11 metres to regain the other 1%. This was not a practical solution as the wind speed would be lower as the hub height decreased and there would be more wind shear. The 400 metre site suffers a 2% lower wind energy percentage than the 600 metre site.

Figure 2‑18 Lighthouse effect on wind energy (Danish Wind Industry Association, 2017)
Parameters:
Obstacle Height- 35 metres
Roughness Class- 2.5
Hub Height- 20 metres
Obstacle Width- 8 metres
Distance from turbine- 600 metres
2.5.3 Coastal Cliffs
The terrain around where the lighthouse and proposed site included coastal cliffs, roughly 7-10 metres in height. The distance for the wind to correct itself from the turbulence was between 70-100 metres. Therefore, the small cliffs had no effect on the wind speed and wind energy at the turbine sites. This was due to the distance back from the cliffs that both sites were located, they were approximately 20-300 metres back respectfully. The wind recovered from the turbulence caused by the cliffs by the time it reached either of the proposed sites.
2.6 Turbine Location
The best location to erect the wind turbine was 400 metres from the lighthouse. There was an excellent wind speed, the wind speed only decreased by 0.1 m/s at the height of 20 metres compared to 30 metres. There was no major benefit to increasing the height by 10 metres. Also, at the location, obstacles have very little effect on the wind. The turbine was far enough away from the lighthouse that it would not infringe on the tourist aspect or spoil the view. As the turbine was a reasonable distance from any existing dwellings or structure, there would be very few issues with noise from the turbine. There was a high natural background noise around the site as it was a coastal region. There was also less cable required for connection of the turbine. This reduced the cost of cable by almost €800 as 200 metres less was required.
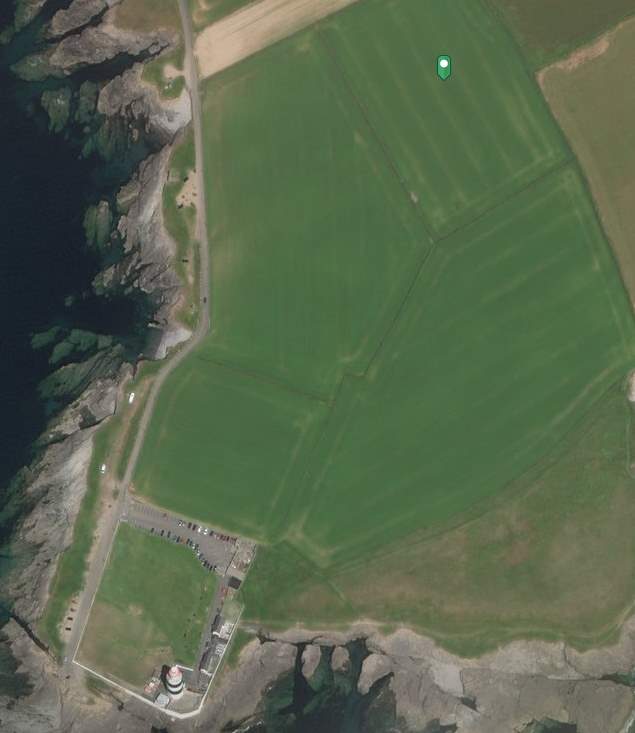
Figure 2‑19 Exact Turbine Location (SEAI, 2017)
3 Energy Demand
I contacted Hook Lighthouse Information Office & Irish Lights who kept record of all lighthouses in the country. I was informed that the cost per year of electricity at hook head was €3543.72. The most energy was consumed in the summer months between May and August as the café was busiest then. The least amount of energy was used in the height of winter between November and February as tourism was low in this time. The lighthouse energy usage was only the instrumentation. The electrical energy consumed per year was just over 27259 kWh.
3.1 C&F 6 kW turbine
Installation Cost: €36000 Inc. Inverter
The C&F 6 kW turbine is the only Irish manufactured turbine on the market. Located in Athenry, Co. Galway, transport to the site was relatively straight forward.
The main features of this model are:
- Active Blade Pitch
- Active Yaw Pitch
- Remote Monitoring
Turbine Specifications:
Table 3‑1 C&F 6 kW turbine specifications
| Specifications | KW6 |
| Rated Power | 6 kW |
| Peak Power | 6.1 kW |
| Reference Annual Energy | 17,000 kWh |
| Noise at 5m/s at 60 m | 42 dBA |
| Grid connection options | Single/ Dual/ Three phase |
| Rotor | 8m diameter |
| Rated Wind Speed | 8 m/s |
| Tower Heights | 9m/ 11.6m/ 15m /20m |
| Rated RPM | 220 rpm |
| Cut in speed | 1.2 m/s |
| Cut out speed | 25 m/s |
| Survival wind speed | Designed to 70m/sec, tested at 59.5 m/sec |
| Annual Carbon Savings | 8-14 Tonnes |
3.2 Kingspan 6 kW turbine specifications
Installation price: €32000
The big advantage of Kingspan 6 kW turbine is that they do not have a gearbox, this feature reduces operation and maintenance costs as there are less moving parts. The Kingspan turbine are not required to shut down at high wind speeds. This allows for continued energy generation in all wind speeds which in turn allows for a faster pay back rate and a greater return on the investment.
The main features of this model are:
- Self-Regulating
- Minimal Visual Impact
- No Gear Box
- Anti-Over Speed Control
Turbine Specifications:
Table 3‑2 Kingspan 6kW specifications
| Specifications | KW6 |
| Rated Power | 5.2kw (1 min average at 11m/sec) |
| Peak Power | 6.1kw |
| Reference Annual Energy | 8,949 kWh @ 5 m/s |
| Voltages Available | 48 V DC/300V DC |
| Grid connection options | Single/ Dual/ Three phase |
| Rotor | 5.6m diameter, 200 RPM at rated power |
| Generator type | Brushless Direct Drive Permanent magnet |
| Tower Heights | 9m/ 11.6m/ 15m /20m |
| Cut in speed | 3.5 m/s |
| Cut out speed | None – continuous operation |
| Survival wind speed | Designed to 70m/sec, tested at 59.5 m/sec |
| Warranty | 5 years |
3.2.1 Cable cost
Cable had to be run from the turbine site to the application which was 400 meters away. As there was such a long length of cable, a voltage drop occurred along the line. As a result, the cabling had to be correctly sized to reduce the loss in delivered power. The cable would be transported from the site to the application on standard telecom poles. These poles would be approximately €500 for the distance to be covered.
The correct cable size was determined by the following equation:
Resistance= 2ρLA
Rho (
ρ
) = 16.9nm L= length of cable in m A= size of cable in m2
Resistance= 2×16.9nx40016x10^-6=0.845Ω
Power(W)= Voltage(v) x Current(I)
6100= 230xI
I=6100230
I=26.521A
Volt drop=I x R
Volt drop=26.521 A x 0.845 Ω =22.41 volts
The cost of armoured cabling was €4.36 per metre on one site, there was 400 metres required to connect the turbine and application. Therefore, the cabling cost was €1744.
3.2.2 Energy Storage
The energy demand was highest in the summer and during the day. During the winter months the wind was highest although the energy demand was lower, this meant that some sort of energy storage was required. The best solution was to install battery storage, Kingspan had battery storage available. A rough price for this battery storage was €2500
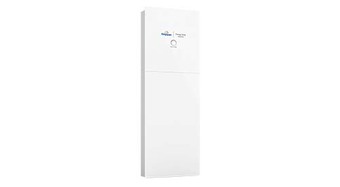
Figure 3‑1 Kingspan Battery Storage (Kingspan, 2017)
3.2.3 Inverter
The windy boy inverter gives a simple connection to a normal 230 V AC single phase domestic supply and allows connection of a small scale wind turbine to the grid. The inverter monitored and measured various parameters of the turbine including the voltage, mains voltage& frequency, input current & power, operating hours and the AEO in kWh.
The inverters are designed to automatically shut down should there be an event where high/low grid AC voltage, grid failure, malfunction of inverter or a high/low frequency. The approximate price for a windy boy inverter was €2250. The inverter was designed to function with a 6 kW turbine.
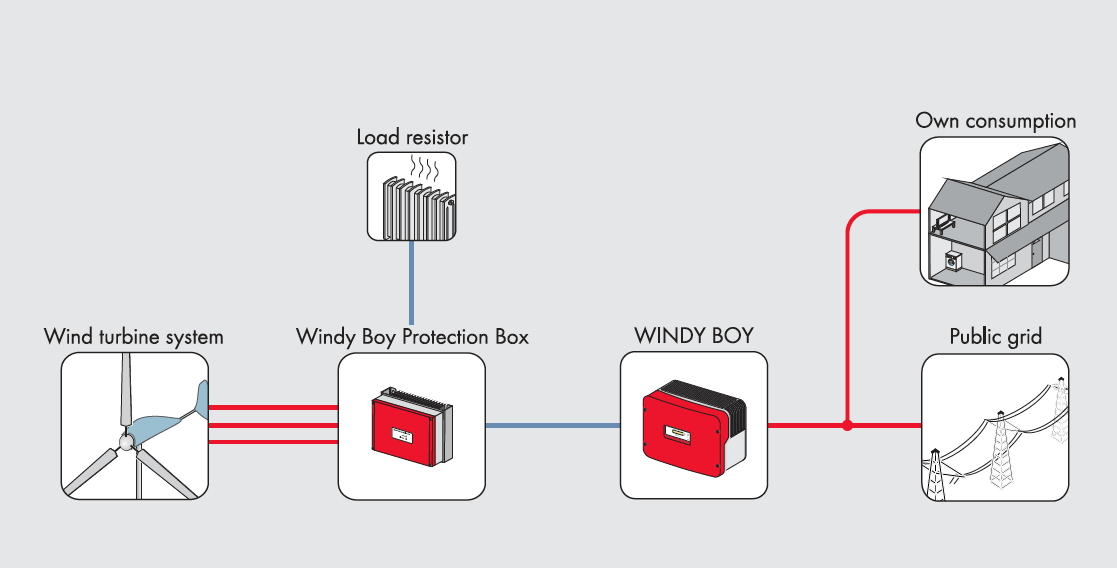
Figure 3‑2 Windy Boy Inverter (Piggott, 2012)
4 Turbine Calculations
To decide which turbine was best suited, the energy output and payback times were calculated for both turbines. It was assumed that both turbines had a run time of 95%. This equated to 8322 hours per year. The following factors were common for both turbines:
4.1.1 C&F 6kW turbine calculations
The rotor diameter on the C&F was much larger than the Kingspan, this meant that there was a much larger wind power input than the Kingspan.
Turbine price: €40744
AEO: 28275.46 kWh
O&M: 3% of cost = €1132
Payback: 9.8 years
Cost of Energy:
Turbine cost per year+OM per yearAEO
x 100
3600020+11322028275.46
x 100
COE= 10.36 c/kWh
If the electricity was to be sold to the grid the price was 9 c/kWh. The payback for the turbine was 16.6 years.
Table 4‑1 Electricity sold to the grid
| Euros € | |
| 9c/kWh | 2544.79 |
| Vat =13.5% | 343.55 |
| Total Saving | 2888.34 |
| Install cost | 36000.00 |
| Annual O&M (3%) | 720.00 |
| Net savings | 2168.34 |
| Payback Period (Yr) | 16.60 |
4.1.2 Kingspan 6kW turbine calculations
The Kingspan turbine had almost 2.4 metre smaller rotor diameter. This mean the power immediately before the rotors was significantly less than the C&F turbine.
Turbine price: €38000 Inc equipment
AEO: 28576 kWh
O&M: 3% of cost = €990
Payback: 8.8 years
Cost of Energy:
Turbine cost per year+OM per yearAEO
x100
3500020+17442028576
x100
COE= 6.29 c/kWh
If the electricity was to be sold to the grid the price was 9 c/kWh. The payback for the turbine was 16.3 years.
Table 4‑2 Electricity sold to the grid
| Euros€ | |
| 9c/kWh | 2571.83 |
| Vat =13.5% | 347.20 |
| Total Saving | 2919.02 |
| Install cost | 36000.00 |
| Annual O&M (3%) | 720.00 |
| Net savings | 2199.02 |
| Payback Period (Yr) | 16.37 |
4.2 Turbine Performance
The power curve and power coefficient were generated in excel for both the Kingspan and C&F turbines.
4.2.1 C&F 6kW turbine
Once the wind speed goes above 4 m/s the power output begins to increase rapidly. The power output almost doubles per m/s increase. The optimum wind speed for the C&F turbine from the graph is 9.8-10 m/s. Once the wind speed increases over 10 m/s the power output did not increase above the rated 6 kW as it was limited by the generator. Once the wind speed increases above 25 m/s the turbine cuts out to avoid damage, although it was rare for a wind speed of above 25 m/s.
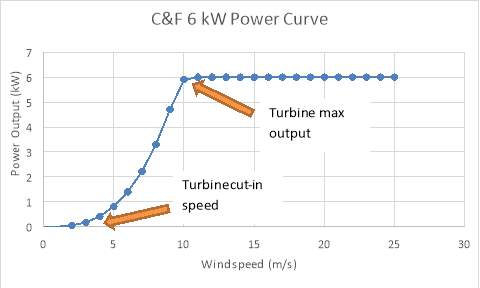
The power coefficient for the C&F turbine was quite poor peaking at about 0.21%. As the wind speed increased however, the Cp value decreased very rapidly. This was due to the power in the wind increasing with the wind speed but the turbine output being limited to the generator rated power of 6 kW. As seen in the graph, the Cp value began to decrease coming up to 10 m/s wind speed, the C&F turbine was producing its maximum output at roughly 10 m/s however the generator was limited to 6 kW.
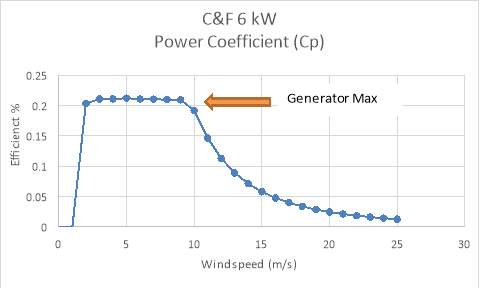
Figure 4‑2 C&F Power Coefficient
4.2.2 Kingspan 6kW turbine
Below a wind speed of 2 m/s there was little power produced by the turbine. Once the turbine saw wind speed above 3.5 m/s the power output increased. The optimum wind speed for the Kingspan turbine from the graph was between 9.5 and 10 m/s. The Kingspan turbine has a slightly higher maximum power output of 6.1 kW. However, as the wind speed increases and the wind power increase the output will only ever be 6.1 kW. The turbine output was limited by the generators rated power.

Figure 4‑3 Kingspan 6 kW Power Curve
The power coefficient for the Kingspan turbine was quite high as it peaked at .43%. The maximum limit which energy can be extracted is the Betz limit which is .596%. When the wind speed increased the Cp value dropped rapidly. This was due to the power in the wind increasing with the wind speed but the turbine output being limited by the generator.
As the turbine does not cut out at wind speeds over 25 m/s it was predicted that the Cp would continue to fall as the power steadily increase with the wind speed. As seen in the graph, the Cp value began to decrease coming up to 10 m/s wind speed.

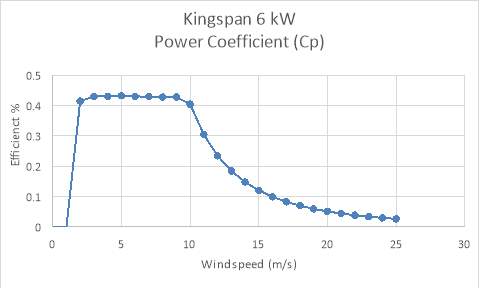
Generator Max
Figure 4‑4 Kingspan Power Coefficient
4.3 Turbine Selection
The turbine most suited for the application was the Kingspan 6 kW turbine, this was for numerous reasons:
- Higher max output
- Continuous operation
- Quicker payback
The big advantage of the turbine was its anti- over speed control design. The turbine did not require a gearbox and due to this, the turbine was not required to shut down at high wind speeds. The Kingspan also produced a higher AEO than the C&F which was more than enough to supply the lighthouse needs.
The turbine emits a decibel reading of 45 dB at a range of 60m. The site was well over this range from any existing structures. Also, due to the location, a coastal region, the noise would not have been reduced by the sound of the sea and wind.
The Kingspan would pay for itself 2 years quicker than the C&F turbine. The Kingspan would be repaid in 7.4.
4.4 Grid connection and planning
With regard to both domestic and industrial micro generation however, planning exemptions have been published by the Department of the Environment and have recently come into effect. These exemptions cover micro generation units with a maximum height of 13 metres for domestic turbines and units with a maximum height of 20 metres for businesses.
(IWEA, 2017)
No planning permission required if:
- Total structure height not greater that 20m(tower + rotor radius)
- Maximum rotor diameter 8m (rotor must be greater than 3m from ground at lowest point)
- A distance more than 50m from road A distance more 100m from nearest dwelling
- A distance more than 2 rotor diameters from overhead lines.
- Distance from nearest boundary greater than the height of total structure + 1metre i.e. (tower height + radius of rotor) + 1 metre
- Sound level less than 43dB (A) or 5dB(A) above back ground at nearest neighbour
- No advertising logos or reflective surfaces
(IWEA, 2014)
To connect a small scale wind turbine to the grid, ESB Networks must be informed of any planned installation and follow a formal application process. ESBN must respond to an application within 20 business days, if they do not respond then the planning application will be deemed to have been granted. No application fee will be required in respect of single installations. The total height of the Kingspan turbine was 23 metres. This meant that planning permission was required. However, as the area is a tourist attraction, it would have been very hard to obtain planning permission from Wexford County Council.
5 Conclusion
The location of Hook Lighthouse was chosen as a possible site to erect a small-scale wind turbine as according to the SEAI Wind Atlas there was an excellent wind speed in that area. There was also a large demand for electricity from both the lighthouse and the café.
Following a site survey and data collection from Irish Lights and Hook Lighthouse Information Office, it was decided a small-scale turbine in that location would be a viable option.
Based on the technical data and analysis of the most suitable small-scale turbines to service the site, it was decided that the Kingspan turbine was the most suitable option. The Kingspan turbine was able to deliver the energy required to completely remove Hook Lighthouse from the grid. It made economic sense to erect the turbine at 20 metres as the payback period was just over 8 years which was very good for a small scale wind turbine. The total cost of installing, connecting and storing the turbine was under €38000. The turbine produced a slightly larger AEO than required by the site, this meant around 300 kWh would be exported to the grid a year, but microgeneration does not receive any subsidies from ESBN.
The only major issue with the viability of the turbine was obtaining planning permission. The turbine was above the permissible height of 20 metres and planning was required. Although the turbine was far enough away from any dwellings not to cause shadow flicker or noise pollution, the Hook peninsula is a heritage site and popular tourist attraction.
6 References
Danish Wind Industry Association, 2017. Wind Shade Calculator. [Online]
Available at: http://xn--drmstrre-64ad.dk/wp-content/wind/miller/windpower%20web/en/tour/wres/shelter/index.htm
IWEA, 2014. IWEA. [Online]
Available at: http://www.iwea.com/index.cfm/page/microgeneration
[Accessed 22 Novemeber 2017].
IWEA, 2017. Planning, Regulations and Administration. [Online]
Available at: http://www.iwea.com/index.cfm/page/planning_regulationsandadminis?#q68
Kingspan, 2017. Kingspan.com. [Online]
Available at: https://www.kingspan.com/gb/en-gb/products/renewable-technologies
[Accessed 24 November 2017].
Met Eireann , 2017. Wind. [Online]
Available at: http://www.met.ie/climate-ireland/wind.asp#
[Accessed 12 October 2017].
Piggott, H., 2012. Scoraig wind. [Online]
Available at: http://scoraigwind.co.uk/2012/01/grid-connected-homebrew-wind-turbines/
[Accessed 20 November 2017].
SEAI, 2017. Wind Mapping System- Wind Atlas. [Online]
Available at: http://maps.seai.ie/wind/
7 Appendices
| C (Scale) | 8.8 | k (Shape) | 2.1 | |||
| Wind speed bin (m/s) | Interval upper limit | Weibull upper limit | Interval prob | Hours per year | Power Density W/m2 | Energy Density kWh/m2/yr |
| 0 | 0.5 | 0.002420 | 0.0024 | 21.20 | 0 | 0.00 |
| 1 | 1.5 | 0.024049 | 0.0216 | 189.47 | 1 | 0.12 |
| 2 | 2.5 | 0.068691 | 0.0446 | 391.06 | 5 | 1.92 |
| 3 | 3.5 | 0.134333 | 0.0656 | 575.02 | 17 | 9.51 |
| 4 | 4.5 | 0.216928 | 0.0826 | 723.53 | 39 | 28.36 |
| 5 | 5.5 | 0.311121 | 0.0942 | 825.14 | 77 | 63.17 |
| 6 | 6.5 | 0.410985 | 0.0999 | 874.80 | 132 | 115.74 |
| 7 | 7.5 | 0.510735 | 0.0997 | 873.81 | 210 | 183.58 |
| 8 | 8.5 | 0.605348 | 0.0946 | 828.81 | 314 | 259.91 |
| 9 | 9.5 | 0.690987 | 0.0856 | 750.20 | 447 | 334.98 |
| 10 | 10.5 | 0.765207 | 0.0742 | 650.17 | 613 | 398.23 |
| 11 | 11.5 | 0.826935 | 0.0617 | 540.74 | 815 | 440.83 |
| 12 | 12.5 | 0.876284 | 0.0493 | 432.29 | 1058 | 457.54 |
| 13 | 13.5 | 0.914251 | 0.0380 | 332.59 | 1346 | 447.56 |
| 14 | 14.5 | 0.942389 | 0.0281 | 246.48 | 1681 | 414.26 |
| 15 | 15.5 | 0.962488 | 0.0201 | 176.07 | 2067 | 363.97 |
| 16 | 16.5 | 0.976334 | 0.0138 | 121.29 | 2509 | 304.30 |
| 17 | 17.5 | 0.985536 | 0.0092 | 80.61 | 3009 | 242.58 |
| 18 | 18.5 | 0.991438 | 0.0059 | 51.70 | 3572 | 184.68 |
| 19 | 19.5 | 0.995092 | 0.0037 | 32.01 | 4201 | 134.47 |
| 20 | 20.5 | 0.997276 | 0.0022 | 19.13 | 4900 | 93.74 |
| 21 | 21.5 | 0.998536 | 0.0013 | 11.04 | 5672 | 62.63 |
| 22 | 22.5 | 0.999239 | 0.0007 | 6.15 | 6522 | 40.13 |
| 23 | 23.5 | 0.999617 | 0.0004 | 3.31 | 7452 | 24.68 |
| 24 | 24.5 | 0.999813 | 0.0002 | 1.72 | 8467 | 14.58 |
| 25 | 25.5 | 0.999912 | 0.0001 | 0.86 | 9570 | 8.27 |
Table 7‑2 Excel Data for 30 metres
| C (Scale) | 9.2 | k (Shape) | 2.1 | |||
| Wind speed bin (m/s) | Interval upper limit | Weibull upper limit | Interval prob | Hours per year | Power Density W/m2 | Energy Density kWh/m2/yr |
| 0 | 0.5 | 0.002205 | 0.0022 | 19.32 | 0 | 0.00 |
| 1 | 1.5 | 0.021930 | 0.0197 | 172.79 | 1 | 0.11 |
| 2 | 2.5 | 0.062765 | 0.0408 | 357.72 | 5 | 1.75 |
| 3 | 3.5 | 0.123131 | 0.0604 | 528.81 | 17 | 8.75 |
| 4 | 4.5 | 0.199674 | 0.0765 | 670.52 | 39 | 26.28 |
| 5 | 5.5 | 0.287856 | 0.0882 | 772.47 | 77 | 59.14 |
| 6 | 6.5 | 0.382533 | 0.0947 | 829.37 | 132 | 109.73 |
| 7 | 7.5 | 0.478549 | 0.0960 | 841.10 | 210 | 176.70 |
| 8 | 8.5 | 0.571252 | 0.0927 | 812.08 | 314 | 254.67 |
| 9 | 9.5 | 0.656891 | 0.0856 | 750.20 | 447 | 334.97 |
| 10 | 10.5 | 0.732840 | 0.0759 | 665.31 | 613 | 407.50 |
| 11 | 11.5 | 0.797650 | 0.0648 | 567.74 | 815 | 462.84 |
| 12 | 12.5 | 0.850956 | 0.0533 | 466.96 | 1058 | 494.23 |
| 13 | 13.5 | 0.893266 | 0.0423 | 370.63 | 1346 | 498.74 |
| 14 | 14.5 | 0.925702 | 0.0324 | 284.14 | 1681 | 477.55 |
| 15 | 15.5 | 0.949737 | 0.0240 | 210.55 | 2067 | 435.24 |
| 16 | 16.5 | 0.966961 | 0.0172 | 150.88 | 2509 | 378.52 |
| 17 | 17.5 | 0.978902 | 0.0119 | 104.60 | 3009 | 314.77 |
| 18 | 18.5 | 0.986913 | 0.0080 | 70.18 | 3572 | 250.70 |
| 19 | 19.5 | 0.992117 | 0.0052 | 45.58 | 4201 | 191.50 |
| 20 | 20.5 | 0.995389 | 0.0033 | 28.66 | 4900 | 140.45 |
| 21 | 21.5 | 0.997382 | 0.0020 | 17.45 | 5672 | 99.01 |
| 22 | 22.5 | 0.998557 | 0.0012 | 10.29 | 6522 | 67.13 |
| 23 | 23.5 | 0.999228 | 0.0007 | 5.88 | 7452 | 43.81 |
| 24 | 24.5 | 0.999599 | 0.0004 | 3.25 | 8467 | 27.54 |
| 25 | 25.5 | 0.999798 | 0.0002 | 1.74 | 9570 | 16.68 |
Table 7‑3 SEAI Wind Atlas Extract Frequency
| Wind speed bin (m/s) | Interval upper limit | Frequency |
| 0 | 0.5 | 13 |
| 1 | 1.5 | 147 |
| 2 | 2.5 | 343 |
| 3 | 3.5 | 541 |
| 4 | 4.5 | 712 |
| 5 | 5.5 | 858 |
| 6 | 6.5 | 1053 |
| 7 | 7.5 | 1032 |
| 8 | 8.5 | 967 |
| 9 | 9.5 | 679 |
| 10 | 10.5 | 534 |
| 11 | 11.5 | 472 |
| 12 | 12.5 | 366 |
| 13 | 13.5 | 246 |
| 14 | 14.5 | 169 |
| 15 | 15.5 | 132 |
| 16 | 16.5 | 113 |
| 17 | 17.5 | 106 |
| 18 | 18.5 | 102 |
| 19 | 19.5 | 80 |
| 20 | 20.5 | 20 |
| 21 | 21.5 | 24 |
| 22 | 22.5 | 19 |
| 23 | 23.5 | 14 |
| 24 | 24.5 | 13 |
| 25 | 25.5 | 3 |
Table 7‑4 Kingspan Turbine Data
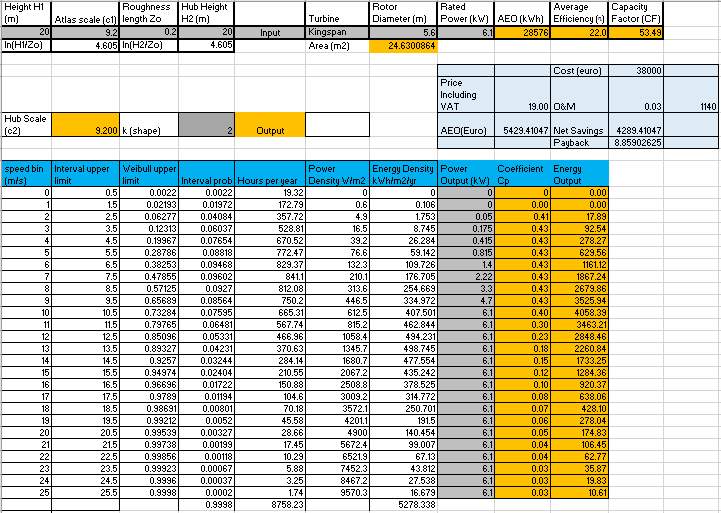
Table 7‑5 Kingspan electricity export
| Euros | |
| 9c/kWh | 2571.83 |
| Vat =13.5% | 347.20 |
| Total Saving | 2919.02 |
| Install cost | 36000.00 |
| Annual O&M (3%) | 720.00 |
| Net savings | 2199.02 |
| Payback Period (Yr) | 16.37 |
Table 7‑6 C&F Turbine data
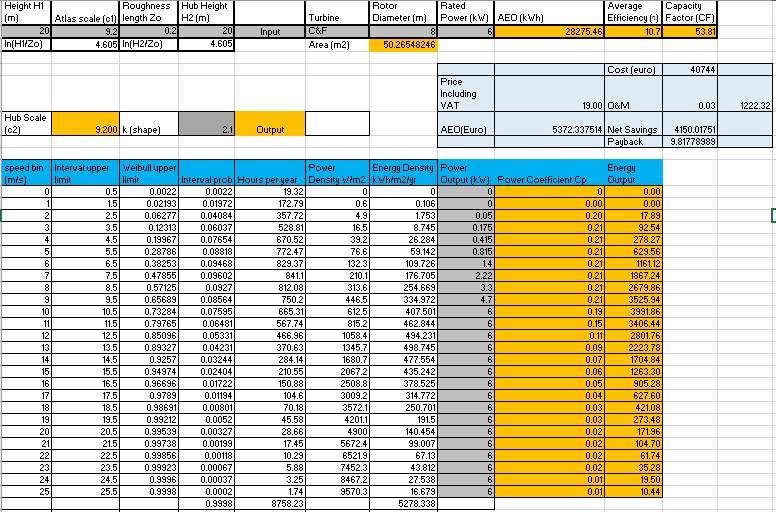
Table 7‑7 C&F Electricity export
| Euros | |
| 9c/kWh | 2544.79 |
| Vat =13.5% | 343.55 |
| Total Saving | 2888.34 |
| Install cost | 36000.00 |
| Annual O&M (3%) | 720.00 |
| Net savings | 2168.34 |
| Payback Period (Yr) | 16.60 |
Cite This Work
To export a reference to this article please select a referencing stye below:
Related Services
View all


Related Content
All TagsContent relating to: "Energy"
Energy regards the power derived from a fuel source such as electricity or gas that can do work such as provide light or heat. Energy sources can be non-renewable such as fossil fuels or nuclear, or renewable such as solar, wind, hydro or geothermal. Renewable energies are also known as green energy with reference to the environmental benefits they provide.
Related Articles

DMCA / Removal Request
If you are the original writer of this dissertation and no longer wish to have your work published on the UKDiss.com website then please: