How WIAT-III Scores Operationalize the Authorial and Secretarial Aspects of Essay Writing
Info: 10199 words (41 pages) Dissertation
Published: 25th Jan 2022
Abstract
Competent writing reflects the use of both mechanical and higher order planning skills, sometimes referred to as the ‘secretarial’ and ‘authorial’ functions of writing. We evaluated the usefulness of this organizational framework for interpreting the Wechsler Individual Achievement Test, 3rd Edition (WIAT-III) writing measures in the normative sample and in an independent sample of students referred for special education evaluation. To do this, we regressed two scores derived from the Essay Composition subtest on expressive language subtest-component and spelling subtest scores. We expected the expressive language measures to more strongly explain Theme Development/Text Organization scores (authorial performance), and spelling to more strongly explain Grammar and Mechanics scores (secretarial performance). Results indicate that scores from the WIAT-III operationalize this framework, but there are important differences between normative and referred samples. Implications for the evaluation of writing difficulties are discussed.
Introduction
Though writing can be defined simply as the means through which individuals express themselves and/or communicate in print (Bromley, 2007), effective writing is a complex, multifaceted process involving the interaction of cognitive, physical, social, and cultural factors (Hayes & Berninger, 2014; Fisher, 2012). This complexity poses significant challenges for researchers and diagnosticians attempting to understand writing’s constituent components, the variables that influence its development, and how to best assess its global and constituent skills (Mackenzie, Scull, & Munsie, 2013). Numerous theories of writing exist (Hayes & Flowers, 1980; Kellogg, 1996; Juel, 1998), and most make a distinction between higher-order planning and lower-order mechanical skills. Peters and Smith (1993) described this distinction as reflecting ‘authorial’ and ‘secretarial’ functions. This distinction is particularly important when discussing developing and struggling writers because of the sequence in which these skills develop (Hayes & Berninger, 2009), and also because it provides a useful framework for the assessment of writing dysfunction.
Authorial and Secretarial Functions
When engaging in authorial functions, the author must effectively plan what will be written by generating ideas, organizing his or her thoughts, and selecting and arranging words and phrases in order to effectively communicate with an audience (Daffern & Mackenzie, 2015; Isaacson, 1989;). In reviewing his or her work, the author attends most closely to the clarity, logic, and/or sequence of the ideas as to their communication effectiveness. Stated succinctly, the author “thinks about the message, the organization of ideas, and the language in which to express those ideas” (Isaacson, 1997, p. 188).
In contrast, the secretarial function of writing refers to writers’ ability to pay close attention to spelling, handwriting, grammar rules, capitalization and punctuation in hearing and recording sounds in words on paper. According to Isaacson (1989), the secretary is most concerned with the mechanical aspects of the writing task (Isaacson, 1997) in either his or her role as a transcriber (effectively recording in writing what is heard) or as a reviewer (effectively editing the writing of others).
Developmental Aspects of Writing
Authorial and secretarial writing skills develop alongside other language areas. The development of four language systems, speaking, listening, reading and writing may begin sequentially, but nevertheless can be characterized as overlapping processes (Berninger, 2000; Berninger & Abbott, 2010). Listening comprehension skills emerge initially, followed by speaking skills. When students begin formal instruction within the context of schooling, reading and writing skill emerge. Berninger and Abbott (2010) noted that although many believe that writing acquisition depends first on the acquisition of reading skills, the reading-writing relationship is more reciprocal. Kindergarten children have been shown to express ideas in writing even without explicit reading instruction (Berninger, 2009; Berninger & Chanquoy, 2012), and kindergarten writing contributes to kindergarten and first grade reading (Berninger, 2009; Shatil, Share, & Levin, 2000).
Berninger and Swanson (1994) described learning to write as a broad developmental sequence that merges authorial and secretarial functions. Basic transcription skills appear before the ability to generate text, and the ability to plan what will be written appears before the ability to revise what one has already written. During the intermediate grades, transcription skills become more automatic, and more advanced text generation and planning skills begin to develop. Consistent with this developmental sequence, mechanical skills like spelling and handwriting are related to the quality and length of writing in children (Hayes & Berninger, 2009) and thus, mechanical skills can constrain higher-order authorial functions. As a case in point, children often perform better when dictating their thoughts to another party who does the writing, presumably because removing the need for spelling and handwriting reduces the load on working memory (De La Paz & Graham, 1995). Thus, secretarial and authorial functions are not independent (Isaacson, 1997). Their interdependence creates ‘tension’ throughout the writing process of planning, editing, and drafting. Problems fulfilling one role will interfere with performance in the other role. Students with learning problems tend to be less likely to understand the intended purpose and genre for writing, think about the needs of the reader, and/or effectively organize their thoughts (authorial function). They will also tend to make more spelling, capitalization, and punctuation errors – as well as have less legible handwriting (secretarial function; Isaacson, 1997).
Processes That Influence Authorial and Secretarial Functions
Previous psychoeducational investigations have suggested a number of processes that explain authorial and mechanical/secretarial functions (Cormier, Bulut, McGrew, & Frison, 2016; Decker, Roberts, Roberts, Stafford, & Eckert, 2016; Floyd, McGrew, & Evans, 2008; McGrew & Wendling, 2010; McGrew & Knopik, 1993). Most all have employed the Woodcock-Johnson batteries analyzed within the framework of the Cattell-Horn-Carroll intelligence model (CHC; Schneider & McGrew, 2012). These studies have suggested that vocabulary, aspects of working memory, processing speed and phonological skills explain individual differences in mechanical skills. Alternatively, oral language skills, executive and fluid reasoning skills have been linked to higher-order authorial functions. These results are generally constrained to the Woodcock-Johnson series of tests, as exchangeability across batteries is not absolute (Beaujean & McGlaughlin, 2016; Floyd, Bergeron, McCormack, Anderson, & Hargrove-Owens, 2005).
WIAT-III as an Assessment of Writing
There are many different individually administered writing measures are available for clinicians; the Wechsler Individual Achievement Test – Third Edition (WIAT-III; Wechsler, 2009) is one of the more popular measures (Burns, 2010). The WIAT-III, published in 2009, is a comprehensive and psychometrically sound academic battery (Burns, 2010) that includes 16-subtests. Measures within the WIAT-III appear to effectively assess both authorial and secretarial functions. The Essay Composition subtest requires examinees to write an essay on a universal topic for which most all examinees would have strong background knowledge. From the essay, examiners can generate multiple scores: a Word Count score, a Theme Development/Organization score, a Grammar/Mechanics score, and a score aggregating Word Count and Theme Development/Organization.
The WIAT-III Theme Development/Organization and Grammar/Mechanics scores appear to reflect the authorial/secretarial distinction. The Theme Development/Organization score (authorial function) is derived through a rubric and reflects the quality, completeness and organization of the essay (Breaux, 2009). The Grammar/Mechanics score (secretarial function) is the difference between correct and incorrect writing sequence scores, which includes spelling, punctuation, capitalization and awareness of language syntax (Breaux, 2009).
The WIAT-III also includes multiple measures that may be predictive of performance on these tasks, namely oral language and spelling skills. It includes a number of oral language subtest-components that practitioners have been encouraged to consider in evaluation (Breax & Lichtenberger, 2016). Collectively, these oral language measures tap expressive and receptive vocabulary, listening comprehension, sentence repetition and rapid word retrieval skills. Initial psychometric information for these subtest-components was not included in the test manual (Breaux, 2009), but were provided later in a technical report (Breaux & Frey, 2009). These subtest-components have not been investigated extensively by researchers, though in an earlier investigation Parkin (2016) described their relationship to various reading skills.
Purpose of the Study
While theorists suggest that a distinction between higher order authorial and basic secretarial skills provides a useful framework for writing assessment (Isaacson, 1989; Daffern & Mackenzie, 2015), it is not known how effectively the WIAT-III captures this distinction, particularly via the Theme Development/Organization and Grammar/Mechanics scores, because they are naturally correlated describing different aspects of the same essay. The purpose of this study is to add to the validity evidence of the WIAT-III by operationalizing and validating this distinction. If this distinction is supported in the WIAT-III, than the expressive language subtest-components and spelling measures should differentially explain performance on authorial and secretarial measures. Specifically, we hypothesize that the Expressive Vocabulary, Sentence Repetition and Oral Word Fluency measures should be statistically significant predictors of performance on the Theme Development/Organization Essay Composition score (authorial task), but be relatively less related to Grammar/Mechanics Essay Composition score (secretarial task). We investigated these relationships in two samples, the WIAT-III normative sample of typically developing youth, and in an independent sample of students referred for school-based special education evaluations. Effect differences across samples can highlight differences in the explanation of writing performance between typically developing and struggling learners.
Method
Participants
WIAT-III standardization sample. The WIAT-III standardization sample was stratified to approximate the U.S. population in 2005, as reflected in the U.S. Bureau of the Census on the basis of grade, age, sex, race/ethnicity, parent education level and geographic region (Breaux, 2009). Because these analyses focus on explanation of essay writing performance, we analyzed the performance of students in grades 3 through 12 from the aggregated age and grade samples (n = 2030), as students in grades K-2 do not complete the essay writing subtest. Additionally, we did not include the Alphabet Writing Fluency subtest because students in grades 4 and higher do not complete that measure.
Referral sample. We gathered a sample of students from a large, suburban school district in the Pacific Northwest who completed WIAT-III oral language and writing subtests as part of an initial special education evaluation or reevaluation. All participants completed the battery during the same school year. We screened for outliers via Mahalanobis distance, which identified two students (df = 6, p < .001). We deleted those students listwise from subsequent analyses (n = 343).
Demographic information from these samples are shown in Table 1. Table 1 also lists the areas of special education services or specially designed instruction that students received. Socioeconomic status data is not available for the referral sample, though approximately 12 percent of students who attend the school district qualify for Free or Reduced Lunch.
Measures
These analyses used WIAT-III standard scores from Theme Development/Organization, Grammar/Mechanics, Expressive Vocabulary, Oral Word Fluency, Sentence Repetition and Spelling measures calculated from age-based norms. We briefly describe subtests and their psychometric information, as reported in the WIAT-III technical manual (Breaux, 2009) and a supplemental technical report (Breaux & Frey, 2010), in Table 2.
Procedure
We obtained permission from the publisher to use the WIAT-III standardization sample for our analyses. We gathered the referral sample from a single school district with students in 30 elementary schools, 12 middle schools, and 10 high schools. Forty-seven certified special education teachers trained in the administration of the test battery administered the WIAT-III to participants as part of a special education eligibility evaluation process during the 2015-16 school year. Evaluators administered between one and 35 assessments with a mean of 10.16. Subtest administration order is not known. The WIAT-III was administered during the standard school day, and not in a single session. The specific number of sessions for each student is not known. We gathered student demographic data from a district database and gathered test scores from the test publisher’s online scoring system.
Analyses
We conducted all analyses in R (R Development Core Team, 2015) using the lavaan package (Rosseel, 2012). Analyses included path analyses on age-based standard score manifest variables, analogous to multiple regression. The model is illustrated in Figure 1. First, we analyzed the model with the normative sample, and then with the referral sample. As approximately 25 percent of the available referral sample did not speak English and the degree of their English proficiency is unknown, we analyzed the referral sample twice. Here, we conducted an analysis once with the whole sample, and then again without including English Language Learners, to determine if their presence substantially altered path coefficients. Next, we aggregated both samples together for a multigroup analysis, and then constrained all path coefficients to be equal across groups to assess invariance across groups.
Model Evaluation
We evaluated path models based on both unstandardized and standardized path coefficients, and for the constrained models, a number of fit statistics. We interpreted path models according to Kline’s (1998) guidelines: values lower than .10 suggest small effects, values between .10 and .30 suggest moderate effects, and standardized path coefficients greater than .50 suggest strong effects. To determine fit for the restrained model, we include multiple fit indices. We provide χ2 and probability (p) values, a high p value suggests an adequate model fit (Barrett, 2007), the root mean square error of approximation (RMSEA), where values below .075 represent an appropriate fit (Chen, Curran, Bollen, Kirby, & Paxton, 2008), the comparative fit index (CFI), which indicates appropriate fit when it is greater than .96 (Yu, 2002), the standardized root mean square residual (SRMSR) where values less than .08 reflect an appropriate model fit (Hu & Bentler, 1999) . We also provide the Akaike’s Information Criterion (AIC), where a lower value suggests a better model fit, compared to alternative models (Beaujean, 2014). To assess invariance in the standardization sample, we provided Δχ2 and associated probability (p) values,and the difference between models’ CFI values. Cheung and Rensvold (2002) indicated that a CFI change of -.01 or less indicates no difference between nested models.
Results
Because we used data from the WIAT-III standardization sample, means and standard deviations approximated values in the test manual (Breaux, 2009; M = 100; SD = 15). Data from the referral sample including means, standard deviations and subtest correlations are provided in Table 3. As might be expected from a referred sample, means were somewhat lower and standard deviations were slightly larger than the population means and standard deviations. The zero-order correlations between dependent variables were relatively high in both samples, .62 in the normative sample and .53 in the referral sample. High correlations are to be expected given that both dependent variables are derived from the same test stimuli.
Effects of Language Variables and Spelling on Authorial and Secretarial Writing in the Normative Sample
We provide path and R2 coefficients for each sample in Table 4. In the normative sample, the expressive language subtest-components and spelling explained more variance in Grammar/Mechanics than in Theme/Development. Spelling was the strongest predictor. Oral Word Fluency and Sentence Repetition had small effects on each writing score; Expressive Vocabulary had no effect.
Effects of Language Status in the Referral Sample
We tested the referral sample twice to ensure that the inclusion of students who spoke a second language was not impacting results. As evident in Table 4, path coefficients did not change significantly when non-English speakers were removed. When we used language as a grouping variable (English vs. non-English) and constrained path coefficients to be equal across groups, there was no difference between English and non-English speakers. Fit statistics are reported in Table 5. Given this lack of variability, we focused our analysis of the referral sample on the entire group.
In contrast to the normative sample, predictor variables explained an equivalent amount of variance across Theme Development/Organization and Grammar/Mechanics in the referral sample. As in the normative sample, Spelling was the strongest predictor for both writing variables, explaining more variance in Grammar/Mechanics, and Expressive Vocabulary had no effect on either variable. The greatest difference between samples included the effects of Oral Word Fluency on the writing variables and an apparent greater effect for Sentence Repetition on Theme Development/Organization in the referral sample.
Normative/Referral Sample Effects Comparison
To evaluate whether the referral sample’s effects were different from the normative sample’s effects, we conducted a multi-group analysis to establish a baseline. We then constrained all regression paths to be equal across samples for comparison. As noted in Table 5, the Δχ2 test, ΔCFI and difference between AIC suggested the constrained model fit worse than the free model, indicating that our predictor variables demonstrated different effects on the writing variables across samples. We unconstrained each of the differential effects we described above sequentially. Allowing Oral Word Fluency’s effect on Grammar/Mechanics to vary across samples did not result in an equivalent fit with the initial model, though releasing its effects on both writing variables did. Releasing Sentence Repetition’s effect on Theme Development/Organization improved the model further (Δχ2 = 5.66(1), p < .05; see Figure 1).
Post-hoc analyses. We did not expect Expressive Vocabulary to have a negligible relationship with both aspects of writing. Because other scholars have reported that secretarial skills can constrain the authorial function (Hayes & Berninger, 2009), we calculated partial correlations including Expressive Vocabulary and Spelling with each dependent variable. Indeed, Spelling appears to account for all of the authorial/secretarial variance Expressive Vocabulary might explain in the normative sample. After partialling out spelling, Expressive Vocabulary correlated .04 with both Theme Development/Organization and Grammar/Mechanics. In the referral sample, Spelling also accounts for most all variance Expressive Vocabulary might explain in Grammar/Mechanics, as the partial correlation is only -.01, but did not explain away variance between Expressive Vocabulary and Theme Development/Organization. That correlation remained at .22. Including the other oral language measures with Spelling reduced Expressive Vocabulary’s relationship with Theme Development/Organization to .05.
Discussion
The purpose of these analyses was to investigate how WIAT-III scores operationalize the authorial and secretarial aspects of essay writing. We regressed Theme Development/Organization (authorial) and Grammar/Mechanics (secretarial) scores on expressive language subtest-components (measures of expressive vocabulary, sentence repetition and efficient word retrieval) and spelling. We expected expressive language skills to explain performance in the authorial measure to a greater degree than the secretarial measure. We applied this model to two samples: the WIAT-III normative sample and an independent sample of students referred for special education evaluation.
Authorial and secretarial writing measures are highly correlated in the WIAT-III – they are derived from the same stimuli, which is a written essay. Despite this association, these results suggest they represent different skills, at least for struggling learners. Variance explained by these measures differed by sample from a different pattern of predictive variables. In the normative sample, these two skills do not appear particularly distinct. Expressive language and spelling measures explained more variance in secretarial than authorial performance. Spelling explained most all variance in both writing variables. In this sample, oral language skills appear generally unrelated to writing performance after controlling for spelling effects. Spelling accounted for most all variance that would be explained by expressive vocabulary skills, in particular. It is important to note that the Spelling subtest has the greatest reliability of all predictors, which may also account for its stronger relationships with other variables. This pattern of explanation is consistent with the notion that mechanical skills can constrain higher order skills in writing (Hayes & Berninger, 2009).
In the referral sample, the predictors explained an equivalent amount of variance across authorial and secretarial scores, and spelling skill also accounted for the effects of expressive vocabulary skills. The difference across samples came from the effects of Oral Word Fluency on both writing variables, and Sentence Repetition on Theme Development/Organization, as described in Figure 1. Oral Word Fluency and Sentence Repetition demonstrated small to moderate levels of effects on authorial skills. The only language measure to explain secretarial performance was the Sentence Repetition task. It is possible that an understanding of grammar and language syntax facilitates examinee performance on this task and those skills are also reflected in the secretarial aspect of writing. Sentence Repetition also appears to tap verbal memory skills, which might support both aspects of writing. In summary, our hypothesis (expressive language skills would explain authorial skill to a greater degree than the secretarial) held true in the referral sample, but not in the normative sample.
The findings from the normative sample are consistent with other investigations with contemporary psychoeducational batteries. Regressing writing skills on CHC-based abilities’ with the WJ-IV, Cormier et. al. (2016) noted effects for Crystalized Intelligence, an ability closely related to oral language skills, on basic, mechanical writing performance, but not for higher-order written expression skills, at least when simultaneously regressed with other CHC abilities. Similarly, we found no major effects for language skills on authorial functions in the normative sample, when controlling for spelling ability.
The results here suggest that there may be differing relationships between typically developing students and those demonstrating learning challenges. Models designed to explain academic performance in typically developing students may not apply to those struggling with writing skills.
Implications for Practice
The analyses suggest multiple practice implications. First, there are meaningful distinctions in the WIAT-III oral expression subtest-components and in supplemental essay scores like Theme Development/Organization and Grammar/Mechanics, at least for struggling learners (Breaux & Lichtenberger, 2016). Compared to typically developing learners, it is more likely that struggling learners have larger discrepancies between authorial vs. secretarial writing functions. Of course, it is critical to point out that clinicians must consider the reliabilities and standard error of measurement in all interpretations (Breaux & Frey, 2010). As befit their ‘component’ status, many of the reliability coefficients of these measures fall below the .80 value recommended for individual assessment (Sattler, 2001). Scores from all psychoeducational batteries should be integrated into multiple data sources to support findings (American Educational Research Association, American Psychological Association, & National Council on Measurement in Education, 2014).
Second, clinicians should measure a wide range of skills when evaluating examinee writing performance. As noted earlier, WIAT-III expressive language and spelling measures explained 20% of variance in authorial performance in the referral sample; there is a significant amount of variance left to be explained. While the lower reliabilities of the measures we used might be implicated in smaller effects, other skills might explain additional writing variance (e.g. Cormier et. al., 2016; Decker et. al., 2016). Relatedly, results indicate more research in spelling intervention may be necessary (Bramlett, Cates, Savina, & Lauinger, 2010).
Third, because Theme Development/Organization and Grammar/Mechanics scores are derived from the same task on the WIAT-III, the correlation between these scores might be spuriously higher than if they came from different test batteries. Clinicians should consider the pros and cons of measuring numerous written composition skills with a single task, versus separate tasks.
Study Limitations
There are a number of limitations associated with this study. First, results are primarily applicable to use with the WIAT-III. These results should be replicated with other batteries to determine consistency across measures. Second, given the contrast between normative and referral groups, it would be useful to replicate these results with a different group of referred students to determine if these results are consistent in other struggling learners. Third, given the difference in reliabilities of our variables, it is possible that these relationships might change with more reliable measures. Finally, Cormier et. al. (2016) stressed the importance of considering specification errors, a failure to include all important predictors in analysis, when explaining academic performance. In our analyses, we only included measures of oral language we deemed were consistent with the authorial functions of writing and spelling. However, undoubtedly other variables are necessary in a comprehensive model of writing. Some of these might include planning, executive skills and other problem-solving skills (Cormier et. al., 2016; Decker et. al., 2016). Others might argue that a lack of a general cognitive ability measure reflects an important specification error (McGill, 2017). We note, however, that our purpose was to investigate the relationship of subtest-components/spelling on authorial and secretarial skills specifically, and not develop a comprehensive model of writing.
References
American Educational Research Association, American Psychological Association, & National Council on Measurement in Education. (2014). Standards for educational and psychological testing (4th Ed.). Washington, DC: Authors.
Barrett, P. (2007). Structural equation modeling: Adjudging model fit. Personality and Individual Differences, 42, 815-824. doi: 10.1016/j.paid.2006.09.018
Beaujean, A.A. Latent variable modeling using R: A step-by-step guide. New York: Routledge.
Beaujean, A.A., & McGlaughlin, S.M. (2016). Comparing test scores using information from criterion-related validity studies. Applied Neuropsychology: Child, 5, 56-66. doi: 10.1080/21622965.2014.976863
Berninger, V. (2009). Highlights of programmatic, interdisciplinary research on writing. Learning Disabilities Research and Practice, 24, 68–79.
Berninger, V., & Chanquoy, L. (2012). What writing is and how it changes across early and middle childhood development: A multidisciplinary perspective. In E. Grigorenko, E. Mambrino, & D. Preiss (Eds.), Writing: A mosaic of perspectives and views (Ch. 5, pp. 65-84). New York: Psychology Press.
Berninger, V.W. (2000). Development of language by hand and its connections with language by ear, mouth, and eye. Topics in Language Disorders, 20, 65-84.
Berninger, V.W., & Abbott, R.D. (2010). Listening comprehension, oral expression, reading comprehension, and written expression: Related yet unique language systems in grades 1,3,5, and 7. Journal of Educational Psychology, 102, 635-651.
Berninger,V.W., & Swanson, H. L. (1994).Modifying Hayes and Flower’s model of skilled writing to explain beginning and developing writing. In E. Butterfield (ed.), Children’s writing: Toward a process theory of the development of skilled writing (pp. 57–81). Greenwich, CT: JAI Press.
Bramlett, R., Cates, G.L., Savina, E., & Lauinger, B. (2010). Assessing the effectiveness and efficiency of academic interventions in school psychology journals: 1995-2005. Psychology in the Schools, 47(2), 114-125.
Breaux, K.C. (2009). Wechsler Individual Achievement Test-3rd Edition: Technical Manual. San Antonio, TX: Pearson.
Breaux, K. C., & Frey, F. E. (2010, April). Reliability coefficients and standard errors of measurement for subtest component scores (Technical Report #2). Retrieved from http://images.pearsonclinical.com/images/assets/WIAT-III/WIAT3_TechReport2_Fnl.pdf
Breaux, K.C. & Lichtenberger, E.O. (2016). Essentials of KTEA-3 and WIAT-III Assessment. Hoboken, NJ: John Wiley & Sons, Inc.
Burns, T.G. (2010). Wechsler Individual Achievement Test-III: What is the ‘Gold Standard’ for measuring academic achievement? Applied Neuropsychology, 17, 234-236. doi: 10.1080/09084282.2010.499803
Chen, F., Curran, P.J., Bollen, K.A., Kirby, J., & Paxton, P. (2009). An empirical evaluation of the use of fixed cutoff points in RMSEA test statistic in structural equation models. Sociological Methods Research, 36, 462-494. doi: 10.1177/0049124108314720
Cheung, G.W., & Rensvold, R.B. (2002). Evaluating goodness-of-fit indexes for testing measurement invariance. Structural Equation Modeling, 9, 233-255.
Cormier, D.C., Bulut, O., McGrew, K.S., & Frison, J. (2016). The role of Cattell-Horn-Carroll (CHC) cognitive abilities in predicting writing achievement during the school-age years. Psychology in the Schools, 53, 787-803. doi: 10.1002/pits.21945
Cormier, D.C., Bulut, O., McGrew, K.S., & Frison, J. (2016). The role of Cattell-Horn-Carroll (CHC) cognitive abilities in predicting writing achievement during the school-age years. Psychology in the Schools, 53, 787-803. doi: 10.1002/pits.21945
Daffern, T. & Mackenzie, N. (2015). Building strong writers: Creating a balance between the authorial and secretarial elements of writing. Literacy Learning: The Middle Years, 23(1), 23-32.
Decker, S.L., Roberts, A.M., Roberts, K.L., Stafford, A.L., & Eckert, M.A. (2016). Cognitive components of developmental writing skill. Psychology in the Schools, 53(6), 617- 625.
De La Paz, S., & Graham, S. (1995). Dictation: Applications to writing for students with learning disabilities. Advances In Learning and Behavioral Disorders, 9, 227-247.
Fisher, R. (2012). Teaching writing: A situated dynamic. British Educational Research Journal, 38(2), 299–317.
Floyd, R.G., Bergeron, R., McCormack, A.C., Anderson, J.L., & Hargrove-Owens, G.L. (2005). Are Cattell-Horn-Carroll broad ability composite scores exchangeable across batteries? School Psychology Review, 34, 329-357.
Floyd, R.G., McGrew, K.S., & Evans, J.J. (2008). The relative contributions of the Cattell-Horn-Carroll cognitive abilities in explaining writing achievement during childhood and adolescence. Psychology in the Schools, 45, 132-144.
Hayes, J., & Berninger, V. (2014). Cognitive processes in writing: A framework. In B. Arfe, J. Dockrell, & V. Berninger (Eds.), Writing development in children with hearing loss, dyslexia, or oral language problems: Implications for assessment and instruction (pp. 3-15). London, UK: Oxford University Press.
Hayes, J.R., & Flower, L.S. (1980). Identifying the organization of writing processes. In L.W. Gregg & E.R. Steinberg (Eds.), Cognitive Processes in Writing (pp. 3-30). Hillsdale, NJ: Lawrence Erlbaum Associates.
Hays, R.J. & Berninger, V.W. (2009). Relationships between idea generation and transcription: How act of writing shapes what children write. In C. Bazerman, R. Krut, K. Lunsford, S. McLeod, S. Null, P. Rogers, & A. Stansell (Eds.), Traditions of Writing Research (pp. 166-180). New York, NY: Taylor & Frances/Routledge.
Hu, L., & Bentler, P.M. (1999). Cutoff criteria for fit indexes in covariance structure analysis: Conventional criteria versus new alternatives. Structural Equation Modeling, 6, 1-55. doi: 10.1080/10705519909540118
Isaacson, S. (1989). Role of secretary vs. author: Resolving the conflict in writing instruction. Learning Disability Quarterly, 12(3), 209-217.
Isaacson, S. (1997). Mechanical obstacles to writing: What can teachers do to help students with learning problems? Learning Disabilities Research & Practice, 12, 188-194.
Juel, C. (1988). Learning to read and write: a Longitudinal study of 54 children from first through fourth grades. Journal of Educational Psychology, 80, 437-447. doi: 10.1037/0022-0663.80.4.437
Kellogg, R.T. (1996). A model of working memory in writing. In C.M. Levy and S. Ransdell (Eds)., The Science of Writing: Theories, methods, individual differences, and applications (pp. 57-71). Mahwah, NJ: Lawrence Erlbaum Associates.
Kline, R.B. (1998). Principles and practices of structural equation modeling. New York: Guilford.
McGill, R.J. (2017). Re(examining) relations between CHC broad and narrow cognitive abilities and reading achievement. Journal of Educational and Developmental Psychology, 7, 265-282. doi: 10.5539/jedp.v7n1p265
McGrew, K.S., & Knopik, S.N. (1993). The relationship between the WJ-R Gf-Gc cognitive clusters and writing achievement across the life span. School Psychology Review, 22, 687-695.
McGrew, K.S., & Wendling, B.J. (2010). Cattell-Horn-Carroll cognitive-achievement relations: What have we learned from the past 20 years of research. Psychology in the Schools, 47, 651-675.
Mackenzie, N.M., Scull, J., & Munsie, L. (2013). Analysing writing: The development of a tool for use in the early years of schooling. Issues in Educational Research, 23(3), 375-393.
Parkin, J.R. (2016). Wechlser Individual Achievement Test-Third Edition oral language and reading measures effects on reading comprehension in a referred sample. Journal of Psychoeducational Assessment. Advance online publication. doi: 10.1177/0734282916677500
Peters, M. L. & Smith, B. (1993). Spelling in context: Strategies for teachers and learners. Windsor, Berks: NFER-Nelson.
Sattler, J.M. (2001). Assessment of Children: Cognitive approaches(4th ed.). San Diego, CA: Jerome M. Sattler.
Schneider, W.J., & McGrew, K.S. (2012). The Cattell-Horn-Carroll model of intelligence. In D.P. Flanagan & P.L. Harrison (Eds), Contemporary intellectual assessment: Theories, tests, and issues (pp. 99-144). New York, NY: Guilford Press.
Schrank, F.A., McGrew, K.S., Mather, N., & Woodcock, R.W. (2014). Woodcock-Johnson IV. Rolling Meadows, IL: Riverside Publishing.
R Development Core Team. (2015). R: A language and environment for statistical computing. Vienna, Austria: R Foundation for Statistical Computing.
Rossell, Y. (2012). lavaan: An R package for structural equation modeling. Journal of Statistical Software, 48, 1-36. Retrieved from http://www.jstatsoft.org/article/view/v048i02.
Shatil, W., Share, D., & Levin, I. (2000). On the contribution of kindergarten writing to Grade 1 literacy: A longitudinal study in Hebrew. Applied Psycholinguistics, 21, 1–21.
Spandel, V. (2004). Creating writers through 6-trait writing assessment and instruction. Upper Saddle River, NJ: Pearson Education.
Wechsler, D. (2009). Wechsler Individual Achievement Test – Third Edition. San Antonio, TX: NCS Pearson.
Yu, C.Y. (2002). Evaluating cutoff criteria of model fit indices for latent variable models with binary and continuous outcomes. (Doctoral dissertation). Available from ProQuest Dissertations & Theses database. (UMI No. 3066425).
Appendices
Table 1
Referral Sample Demographic Information
| Referral Sample | Norm Sample | ||||||||
| Variable | n | % | n | % | |||||
| Sex | |||||||||
| Male | 211 | 61 | 1002 | 49 | |||||
| Female | 132 | 38 | 1028 | 51 | |||||
| Grade | |||||||||
| 3 | 44 | 13 | 204 | 10 | |||||
| 4 | 75 | 22 | 202 | 10 | |||||
| 5 | 55 | 16 | 202 | 10 | |||||
| 6 | 37 | 11 | 204 | 10 | |||||
| 7 | 33 | 10 | 210 | 10 | |||||
| 8 | 37 | 11 | 197 | 10 | |||||
| 9 | 30 | 9 | 201 | 10 | |||||
| 10 | 22 | 6 | 208 | 10 | |||||
| 11 | 9 | 3 | 200 | 10 | |||||
| 12 | 1 | 0 | 202 | 10 | |||||
| Race/Ethnicity | |||||||||
| American Indian | 2 | 1 | – | – | |||||
| Asian | 41 | 12 | 77 | 4 | |||||
| Black | 6 | 2 | 277 | 14 | |||||
| Hispanic | 71 | 21 | 379 | 19 | |||||
| Multi-racial | 23 | 7 | – | – | |||||
| White | 200 | 58 | 1236 | 61 | |||||
| Other | 61 | 3 | |||||||
| Language | |||||||||
| English | 257 | 75 | 2030 | 100 | |||||
| Spanish | 44 | 13 | – | – | |||||
| Other | 42 | 12 | – | – | |||||
| Evaluation Type | |||||||||
| Initial | 149 | 43 | – | – | |||||
| Reevaluation | 194 | 56 | – | – | |||||
| Evaluation Outcome | |||||||||
| 504 | 18 | 5 | – | – | |||||
| Autism | 35 | 10 | – | – | |||||
| Comm Disorder | 8 | 2 | – | – | |||||
| No Eligibility | 27 | 8 | – | – | |||||
| Emotionally Disabled | 9 | 3 | – | – | |||||
| Health Impairment | 109 | 32 | – | – | |||||
| Intellectual Disability | 4 | 1 | – | – | |||||
| Multihandicapped | 1 | 0 | – | – | |||||
| Specific Learning Disability | 132 | 38 | – | – | |||||
| Areas of Specially Designed Instruction | |||||||||
| Basic Reading | 96 | 28 | – | – | |||||
| Reading Comprehension | 131 | 38 | – | – | |||||
| Reading Fluency | 97 | 28 | – | – | |||||
| Listening Comprehension | 55 | 16 | – | – | |||||
| Oral Expression | 43 | 13 | – | – | |||||
| Written Expression | 172 | 50 | – | – | |||||
| Math Calculation | 140 | 41 | – | – | |||||
| Math Problem-Solving | 164 | 48 | – | – | |||||
| Social/Emotional/Behavior | 112 | 33 | – | – | |||||
| Organization | 142 | 41 | – | – | |||||
| Adaptive Skills | 24 | 7 | – | – | |||||
| Physical Therapy | 4 | 1 | – | – | |||||
| Occupational Therapy | 27 | 8 | – | – | |||||
| Speech/Language Therapy | 77 | 22 | – | – | |||||
Table 2
WIAT-III Subtest-Component Descriptions
| Subtest Component Name | Description | Average Reliability | ||
| Theme Development/Text Organization | Score is the total number of rubric points summed across categories of Introduction, Conclusion, Paragraphs, Transitions, “Reasons Why”, and Elaborations. | .79 Test/Retest | ||
| Grammar and Mechanics | Score is the total number of Correct Word Sequences in the essay minus the total number of Incorrect Word Sequences in the essay. | .84 Test/Retest | ||
| Expressive Vocabulary | Examinee views a picture on a page and must verbalize the word shown on the page when prompted by the examiner. | .71 Split-half | ||
| Oral Word Fluency | The examiner asks the examinee to say as many words as s/he can within a certain category in one minute. | .73 Split-half | ||
| Sentence Repetition | The examinee repeats verbatim a sentence read by the examiner. | .85 Split-half | ||
| Spelling | The examinee writes a word after hearing it in a sentence. | .95 Split-half | ||
Table 3
Referral Sample Correlation Matrix
| TD | GM | EV | OWF | SR | SP | M | SD | skew | kurtosis | |
| TD | 1.00 | 93.99 | 17.69 | .25 | .15 | |||||
| GM | .53 | 1.00 | 93.43 | 17.17 | .20 | 1.08 | ||||
| EV | .33 | .19 | 1.00 | 89.10 | 16.76 | -.06 | -.06 | |||
| OWF | .35 | .16 | .41 | 1.00 | 101.82 | 17.18 | .13 | .42 | ||
| SR | .38 | .27 | .61 | .45 | 1.00 | 89.45 | 15.48 | -.20 | .63 | |
| SP | .35 | .46 | .42 | .23 | .42 | 1.00 | 89.64 | 14.68 | -.09 | .22 |
Note. TD = Theme Development/Organization; GM = Grammar/Mechanics; EV = Expressive Vocabulary, OWF = Oral Word Fluency; SR = Sentence Repetition; SP = Spelling.
Table 4
Path Coefficients and Effects on Theme Development and Grammar/Mechanics
| Referral | ||||||||||||||||||
| Norm Sample | Total Referral | English (without ELL) | ||||||||||||||||
| n = 2030 | n = 343 | n = 257 | ||||||||||||||||
| B | se | p | β | R2 | B | se | p | β | R2 | B | se | p | β | R2 | ||||
| Effects on TD | – | – | – | – | .09 | – | – | – | – | .23 | – | – | – | – | .20 | |||
| EV | .00 | .03 | .99 | .00 | – | .07 | .07 | .31 | .06 | – | .10 | .08 | .21 | .09 | – | |||
| OWF | .10 | .02 | .00 | .09 | – | .21 | .06 | .00 | .21 | – | .22 | .06 | .00 | .23 | – | |||
| SR | .06 | .03 | .02 | .06 | – | .18 | .07 | .01 | .16 | – | .17 | .08 | .04 | .15 | – | |||
| Spelling | .24 | .03 | .00 | .23 | – | .25 | .07 | .00 | .21 | – | .20 | .08 | .01 | .16 | – | |||
| Effects on GM | – | – | – | – | .26 | – | – | – | – | .23 | – | – | – | – | .22 | |||
| EV | -.01 | .03 | .66 | -.01 | – | -.09 | .06 | .15 | -.01 | – | -.11 | .07 | .13 | -.10 | – | |||
| OWF | .14 | .02 | .00 | .13 | – | .05 | .05 | .38 | .05 | – | .08 | .06 | .17 | .08 | – | |||
| SR | .06 | .02 | .01 | .06 | – | .14 | .07 | .06 | .12 | – | .12 | .08 | .14 | .10 | – | |||
| SP | .46 | .03 | .00 | .44 | – | .51 | .06 | .00 | .44 | – | .56 | .08 | .00 | .44 | – | |||
Note. TD = Theme Development/Organization; GM = Grammar/Mechanics; EV = Expressive Vocabulary, OWF = Oral Word Fluency; SR = Sentence Repetition; SP = Spelling.
Table 5
Model Fit Statistics for Norming and Referral Groups
| RMSEA | ||||||||||||||
| 90% conf | ||||||||||||||
| χ2 | df | p | Δχ2 | df | p | est | p | lower | upper | SRMR | CFI | ΔCFI | AIC | |
| 1) Multigroup (Norm/Referral) | 0 | 0 | .00 | – | – | – | .000 | .000 | .000 | .000 | .000 | 1.000 | – | 113610 |
| 2) Constrain Regression Coef | 35.39 | 8 | .00 | 35.390 | 8 | .000 | .054 | .340 | .036 | .072 | .018 | .985 | .015 | 113629 |
| 3) Release OWF on GM | 23.04 | 7 | .00 | 23.037 | 7 | .002 | .044 | .656 | .025 | .064 | .019 | .991 | .009 | 113619 |
| 4) Release OWF on GM & TD | 10.69 | 6 | .10 | 10.689 | 6 | .098 | .026 | .948 | .000 | .050 | .009 | .997 | .003 | 113609 |
| 5) Release OWF on GM & TD, SR on TD | 5.03 | 5 | .41 | 5.030 | 5 | .412 | .002 | .989 | .000 | .040 | .004 | 1.000 | .000 | 113605 |
| 6) Difference Between 4 and 5 | – | – | – | 5.660 | 1 | .017 | – | – | – | – | – | – | – | – |
| Effects of Language in Referral Sample | ||||||||||||||
| 7) Multigroup (English/non-English) | 0 | 0 | .00 | – | – | – | .000 | .000 | .000 | .000 | .000 | 1.000 | – | 16806 |
| 8) Constrain Regression Coef | 5.70 | 8 | .68 | 5.698 | 8 | .681 | .000 | .870 | .000 | .070 | .015 | 1.000 | .000 | 16796 |
Note. OWF = Oral Word Fluency; GM = Grammar/Mechanics; TD = Theme Development/Organization; SR = Sentence Repetition
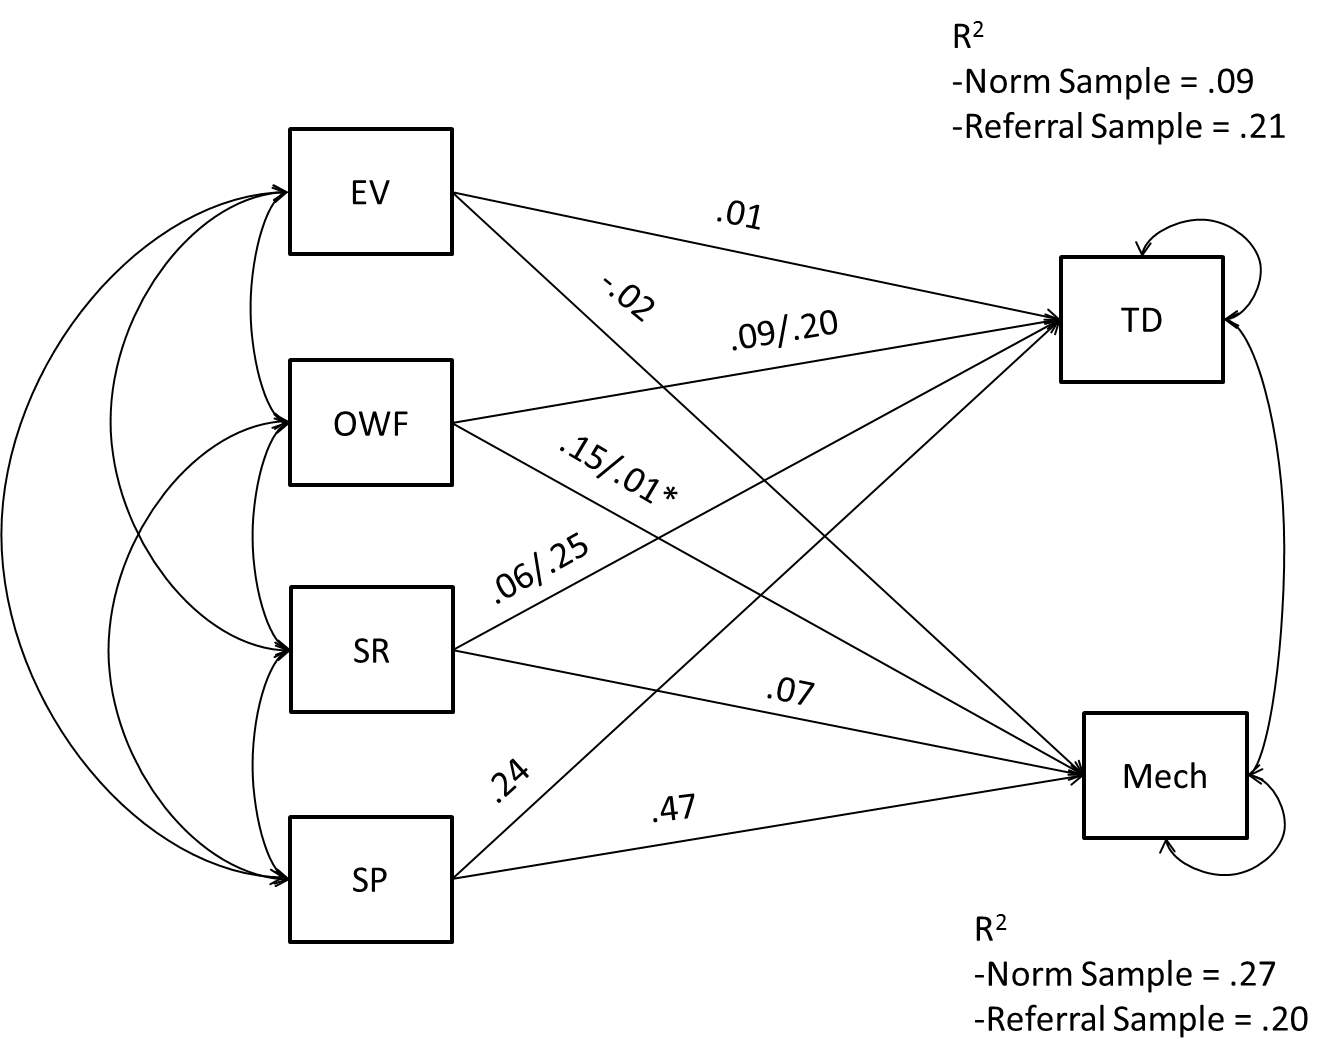
Figure 1. Unstandardized values for normative/referral samples in the partially constrained model. EV = Expressive Vocabulary, OWF = Oral Word Fluency, SR = Sentence Repetition, TD = Theme Development/Organization, GM = Grammar/Mechanics. * p > .05; Variance/Covariance coefficients not shown to ease readability.
Cite This Work
To export a reference to this article please select a referencing stye below:
Related Services
View all


DMCA / Removal Request
If you are the original writer of this dissertation and no longer wish to have your work published on the UKDiss.com website then please: