Water Waste Management in the Brewery Industry
Info: 8261 words (33 pages) Dissertation
Published: 16th Dec 2019
Tagged: Engineering
2.0 Literature Review and Theoretical Framework
The production of beer involves the blending of the extracts of malt, hops and sugar with water, followed by its subsequent fermentation with yeast (Wainwright, 1998). Water is an essential resource in man’s daily activities which makes it impossible to go a day without the use of water. In the brewing industry water and waste water constitutes a practical problem despite substantial improvement over the years, water consumption and disposal remain critical from an environmental and economic standpoint (Luc, et al., 2006).
This chapter will provide a theoretical framework for understanding of both water conservation, and a technical description of the brewery process, in order to understand the existing literature on manufacturing water conservation, as it relates to the brewery process more thoroughly. This will be used as the foundation of the larger study, and will create clear definitions for the related terms, allowing themes in the qualitative research to be identified in the following aspects.
2.1 Water Conservation as an Element of Corporate Social Responsibility
2.2 Theories of Conservation
2.3 Water Conservation and Management practices in manufacturing
- Water Use in the Brewery Process
- Trends in quantity of water utilized in manufacturing a litre of beer
- Differences between Mainstream Brewing and Craft Brewing Processes.
- Waste water or effluent treatment options
- combination. Of treatment options.
2.1 Water Conservation as an Element of Corporate Social Responsibility
Corporate Social Responsibility (CSR) is theoretically defined as “a form of corporate self-regulation integrated into a business model” (Fontaine, 2013). As such, it includes all the elements of the business plan, or structure, which ensure that the business is acting responsibly, or monitoring the impact of the business on the community. This comprises all activities that help the business meet the social and ethical expectations of the business’s target audience or stakeholders. The company’s CSR plan are thereby designed to have a positive impact on the social, environmental and economic performance of the company (Fontaine, 2013; McWilliams & Siegel, 2001). This would directly include reducing the company’s water footprint (Lambooy, 2011).
The framework for developing a CSR plan, were established by Carroll (1991), as a scaffold, or hierarchy. Further, while CSR is almost certainly philanthropic in nature, it also has significant financial and reputational benefit for the company. As with any plan implemented within a company, it must support fiscal solvency first, as such economic responsibilities must be met, at the foundation of the hierarchy, with philosophical responsibility must be fulfilled last. As such, when considering water conservation efforts within the company, how it benefits the brewery fiscally and legally, should be determined, before considering the social and philosophical aspects. A more detailed visual representation of these scaffolded relationships can be seen below, in Figure 1.
Figure 1: Carroll’s pyramid of social responsibility
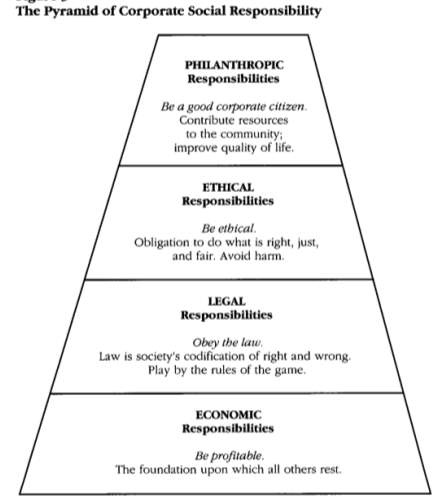
Source: (Carrol, 1991).
Bearing this scaffold in mind, the relationships between water conservation efforts, and theoretical concept of CSR is clearer. First, reducing water meets the businesses economic responsibilities, by increasing the overall profitability of the company, or reducing cost. There is “strong evidence of higher financial return among those businesses that choose to be reduce their ecological footprint (Seneviratne, 2007).
Secondarily, it will meet the legal responsibilities or the growing policy demands related to treating, and recycling waste water. There was a time when there was not a legal demand for the conservation of water, however, as the world becomes more globally concerned with the availability of freshwater (Lambooy, 2011). So, the CSR approach must also meet the legal responsibilities of the brand.
Then, when economic and legal responsibilities are met, ethical and philanthropic responsibilities can be met. Ethical responsibilities are those that meet the business’s obligation to do what is right and good. Similarly, the philosophical responsibility is to make the world a better place. As such, water conservation planning meets the ethical responsibility to provide for the environmental welfare, human rights, and health and safety, and improves the ecological health and sustainability as whole, among other benefits (Maloni & Brown, 2006).
2.2 Theories or Methods of Conservation
Given the significance of water conservation to the CSR plan of a business, and the business’s ability to meet its responsibilities, it is important to understand the existing theories of water conservation, or ways in which water footprint can be reduced. More specifically, according to the EPA there are three primary modes of conserving water: reducing, reusing, and recycling (Burchette, 2016). Each of these approaches offers distinct benefits, while also posing limitations.
Reduction is the process which is easiest to define. Reducing water use is as simple as implementing policies and technologies that lower the total litres of water used by a company. This includes not only water used in the manufacturing process, but also water used in employee bathrooms, lunchrooms, and other similar uses (Vickers, 2002). This also includes both reduction in use, and reduction in loss (Scott & Scott, 1988). The primary benefit of reduction is an immediate cost savings. By implementing policies, and altering practices to reduce water use, the cost of the water is saved, and the economic outlook of the company improved. The average cost of water in the U.S., for example is in the U.S. is $2.81/1,000 gal., so reducing water use in this way can bring substantial savings (Bachman, 2012). In Australia, its $3.08 per thousand litres. and it is expected to rise as time goes on. The greatest limitation, however, is that how much water use can be reduced is typically limited. For example, in the beer process, the total amount of water in the beer recipe cannot be reduced, and so, there is a natural limit to how much this method, alone, can be used to decrease a brand’s total water footprint.
The second approach used to decrease water footprint is reuse. Reuse is, most simply defined, as using the same water twice. For example, water that was lost to evaporation or condensation can be recaptured, and reused, to cool equipment in the manufacturing process. Also, freshwater may be required at one stage of the process, resulting in the creation of greywater, but that greywater can be used, for a second time, at another stage in the process where freshwater is not a requirement (Bachman, 2012). This, generally, has the benefit of allowing the same water to be used multiple times and at multiple stages of the process, which can result in a greater water savings overall, and reduced production of wastewater as well. It has the disadvantage, however of being limited by policies or laws, as it relates to where greywater can safely be used, especially as it relates to the manufacturing of beverage products (EPA, 2012). As such, it is not surprising that the EPA (2012) has strict guidelines regarding these types of reuse
Recycling is a process of turning something used, into something new. However, you cannot technically turn water into a new substance. As such, recycling, as it relates to the theory of water conservation, is the process of cleaning and reusing water (McGovern & Bastian, 2009). In the manufacturing process, this typically occurs on site, through the use of cleaning technologies (McGovern & Bastian, 2009). The benefit of this process, is that it allows the majority of water to be cleaned and reused. In contrast, however, the greatest disadvantage is the cost and time that must be committed to reclamation and treatment in order for water to be recycled and reused within the process (McGovern & Bastian, 2009).
Each of these methods of conservation can be practiced within the manufacturing process, either in combination, or in isolation. This allows the company to use the water conservation approaches that are most well suited to their specific manufacturing process, their space, and their distinct needs. This varies from manufacturer to manufacturer, based on their unique circumstances.
2.3 Water Conservation and Management Practices in Manufacturing
Water is used in a variety of processes within the manufacturing industry, resulting in a very high level of water use. However, legal expectations, like those enforced by the EPA and other similar global agencies are increasingly working to control the discharge of effluents from the industrial processes, and expecting businesses to increase their use of new technologies to increase the recycle and reuse processes (Klemes, 2012). As such, it is important to understand exactly what ways that water is used in manufacturing.
The basic water use processes are the same in all manufacturing as seen in Figure 2, below, and is made up of a cycle of water use. In the first stage water goes into both the product and the production process, in the second stage, operations are carried out, creating wastewater. Three things can happen to this water, it can be immediately reused, it can be regenerated, or recycled, through a cleaning process, and reused, or it can exit the cycle, as waste water (Klemes, 2012).
Figure 2: The Industrial Recycle and Reuse process
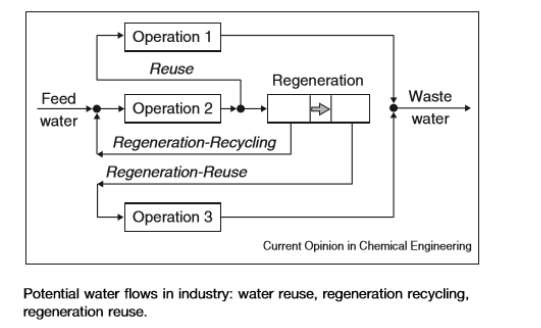
Source: (Klemes, 2012).
The primary goals of this cycle, as depicted are to minimize the feed water, as well as minimizing the waste water. Another important part of water economy, however, is using the recovery and recycling process to heat and cool the water, in order to simultaneously improve the overall energy efficiency of the manufacturing process (Klemes, 2012). These basic constructs can be used to explore water conservation in the beer brewery process.
Conservation of water resources and lowering of wastewater discharge volumes are among several environmental and economic benefits expected to be reaped from the reduction of the water usage in brewery or winery (Olajire, 2012). Brewers Association manual on “Water and waste water: treatment/volume reduction” highlighted five strategies that can be adopted to achieve the best water management practices and they are classified from simple to complex actions. However, three of these strategies will be examined to review previous research studies on water management practices of the brewing industry, the three include:
- Adjust water flow
- Modify existing equipment
- Reuse or recycle water (treat if needed)
2.3.1. Adjust water flow
Corporate Social Responsibility (CSR) of private entities considers adopting policies on sustainable water use as a result of water stress being increasingly sighted as a threat to promote social justice and preserve healthy ecosystems and as well a potential constraint to economic growth (Lambooy, 2010). It was further explained that adopting sustainable water use policies are important as any disruption in the supply of water can undermine industrial and manufacturing operations where water usage is necessary for production, irrigation, material processing, cooling and/or washing and cleaning.
Industrial operations like the brewing process of different breweries make use of different strategies to control water flow during production. Brewers Association revealed the water flow control strategies adopted by some of the breweries to be mentioned below:
Bells brewery in Michigan tracks water use in their brew house, cellar and on both the bottling and kegging lines using sub-meters while their Clean-in-place (CIP) system reduces the amount of water to clean brewery tanks by about 65%, all with the goal of decreasing the brewery’s water intensity.
Standing stone brewery, Oregon, have a high-temperature dishwasher in their kitchen that reduces the amount of water and chemicals needed for rinsing and sanitation. This not only control the use of water but also experience reduction in the amount of energy needed for waste water management with the use of fewer chemicals.
2.3.2. Modify existing equipment
This involves the installation of water-saving devices by breweries. Bell’s brewery will save over 9 million litres of water associated with their filling operation as a result of the newly installed filler vacuum pump design meant to reduce water that passes through the drain from 56.8 litres per minute to 7.6 litres per minute (Brewers Association, 2017).
The same manual that that revealed that of Bell’s brewery also disclosed that new technologies have been installed by Sierra Navada in California to replace bathroom faucet aerators and nearly 800,000 litres of water were saved in 12 months with an immediate payback. Flush valve toilers were retrofitted with dual flush handles and it saved the brewery almost 300,000 litres in one year for a 0.7-year payback. When Air-Cooled Ice Machine was installed over 3 million litres of water a year for a 1.5-year payback was saved. An immediate payback was also experience when their pre-rinse spray valves were changed and it saved them almost 1 million litres a year.
2.3.3. Reuse or recycle water (treat if needed)
(Olajire, 2012) stated in his research on “the brewing industry and the environmental challenges” that the recycling of all materials and by-products generated in the whole operations of the brewing processes should be a major target of the brewing industry. He further disclosed that production and the specific water usage in breweries will determine the quantity of wastewater to be disposed and (Kanagachandran and Jayaratne, 2006) revealed that per litre of beer produced, an estimate of approximately 3 – 10 litres of waste effluent is generated even with substantial technological improvements made in the past.
The possibility to reuse the effluent water within the plant and enhance Biochemical Oxygen Demand (BOD) removal were among the reasons given by Stone Brewing Company, California, for their decision to replace the Dissolved Air Flotation (DAF) with a Membrane Bioreactor (MBR) system, which was mainly geared by the guarantee in Total Suspended Solid (TSS) removal via membrane filtration. Soon after the commissioning of the MBR system in January 2010, the benefits began show casing during stabilization of the system and they include the drastic reduction of TSS in the effluent and the improvement in the removal of Chemical Oxygen Demand (COD) but the moment the MBR system got stabilized, an RO system was commissioned to further treat the effluent for reuse purposes (Brewers Association, 2017).
Huge quantities of wastewater effluent are often generated during the beer brewing process and treated in cost-effective and safest way in line with the strict discharge regulations set by government entities to protect human and animal life and their environment (Simate et al., 2011). This shows the necessity to treat wastewater effluent either for reuse or disposal purpose.
2.4 Water Use in the Brewery Process
In order to understand water conservation in the brewery process, it is first important to understand where water is used. Figure 3 depicts the basic brewing process, which uses water at nearly every stage
Figure 3: The Beer Brewing Process
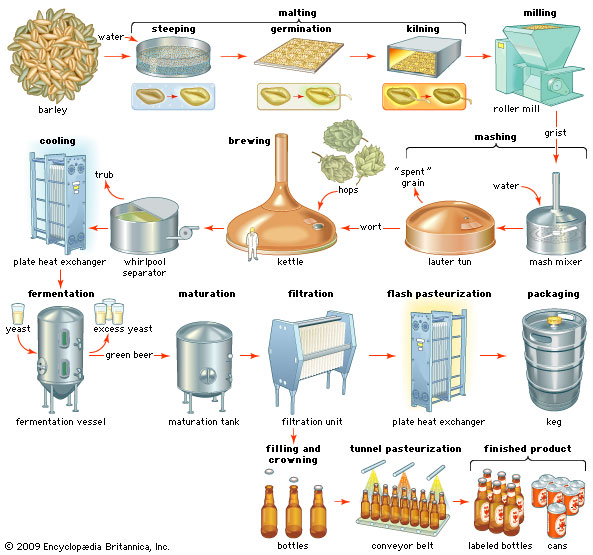
The first point at which water is used in the beer brewing process is steeping. At this stage, the grains are placed together, and steeped in water, which time they swell. This leads to germination, or the point at which individual seeds of grain begin to split open and sprout. At this point the kernels begin to break down, and the producer can begin to work with the grain mixture. This leads to heating, to stop germination, and cleaning. Often the cleaning process includes washing the grain, with water, before it is milled. During milling, the malted grain is ground, and then placed in water for hydrating. When it has absorbed an appropriate amount of water in can be milled, and turned into mash. Water, yeast, and sugar are then added to speed the fermentation process. After ketteling, brewing, cooling, and fermentation, it can be watered to the appropriate strength, and placed in kegs or bottles for distribution (Pitock, 2015). Each of these stages, which require water to be added directly to the mixture for the beverage, require the use of fresh-drinkable water.
However, these are not the only ways that water is used in the process. Water is needed to cool equipment, is lost to condensation during brewing, is used in the bathrooms of corporate facilities, and more. This water can often be recaptured, and reused for other non-food related tasks to decrease emulsion.
More specifically, evidence demonstrates that breweries use various rates of water consumption ranging from four to 11 litres of water, per litre of beer produced. Of the water consumed, two-thirds is directly used in processing, with the remainder used in cleaning and sanitation (Moll, 1991; Perry & De Villers, 2003). Correspondingly, waste is created by both production, and sanitation.
2.5 Trends in quantity of water utilized in manufacturing a litre of beer
Large quantities of water are often utilized in the production of beer as a result of the batch-type operations employed by breweries to process the raw materials to the final beer product, as well as for washing, cleaning and sterilizing of various units after each batch is completed (Van der Merwe and Friend, 2002). The brewing industry has recorded high ratios of water used to beer produced for many years and it can be as high as 10:1 in sites with a large proportion of small pack production, and as low as 5:1 on some traditional brewing sites (Crispin, 1996).
It was further revealed that between 65% and 70% of incoming water forms part of the effluent leaving a brewery (Binnie and Partners, 1986) which denotes a huge amount of water is disposed off as waste after the brewing process. A study on water usage in the operational areas of the brewing process was embarked upon by the Brewers Association in one of their manuals on “water usage and waste water generated by craft brewers”, which disclosed that at the brewing house 25% of total water used in producing beer is being utilized while 17% is used by the cellar, 38% during packaging and 20% water usage for utilities (general water), as in figure 1 below (Brewers Association, n.d.).
Figure 4: Typical brewery water use per area
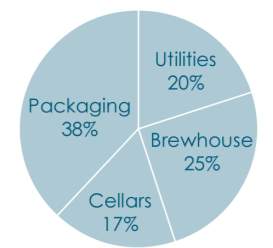
Water use per department h1 water / Total beer
Source: Brewers Association manual, Segment Profile: Water Usage & Wastewater Generated by Craft Brewers.
The Brewers Research and Education Fund, BREF (2006) and the European Brewery Convention, EBC publication (1990), disclosed the usage of water as distributed within a typical brewery in Figure 2 where we can express the volume ratio of water consumed per volume of the produced beer or the sold beer which is a function of the technical standard of each unit or department, making up the overall brewery process (Tokos & Glavič, n.d.).
Table 1: Water consumption for different brewery process
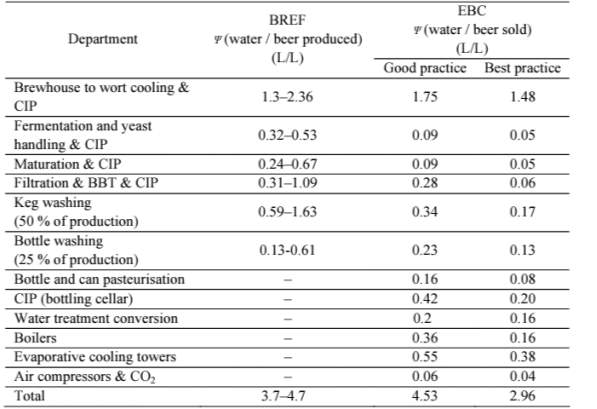
Source: Tokos & Glavič (n.d.).
The volume of water usage in breweries for the production of beer ranges from 4 – 8 (m3/m3) while the consumption of water for each operation during the brewing process is related in Figure 3 below as revealed by the German brewing industry (World bank group, 1998).
Table 2: Water Consumption Reported for the German Brewing Industry
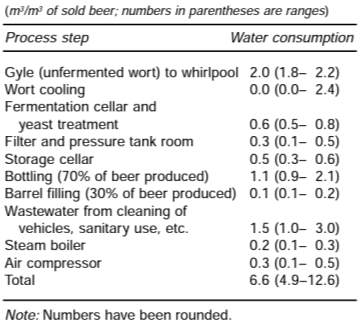
Source: World Bank group (1998).
In 2002, a research embarked upon by AI Van der Merwe and JFC Friend unravelled the fact that based on the overall water balance, it was found that 5m3 of water was used to produce 1m3 of beer at the brewery studied. Among the objectives of this investigation done 15 years ago was to assess water management at a South African brewery. The research work further stated that while storm water is not considered as part of the overall water balance as there are no uncovered holding facilities at the plant, water used by the brew house, the cellars, packaging, general users and CIP stations are what can be regarded as the overall water balance at the relevant brewery (Van der Merwe and Friends, 2002).
Therefore, a careful review of each composition of the overall water balance will be unleashed further below.
2.5.1. Water usage by the brew house:
As figure 3 illustrated, the (World Bank group 1998), disclosed a report for the German brewing industry which stated the volume of water utilized during the operations at the brew house for the production of beer. The operations were labelled process steps and in the brew house, it was revealed that from unfermented wort (also known as Gyle) to the whirlpool, 2 cubic meters of water per cubic meter of beer produced or sold is used which also falls within the range of 1.8 to 2.2 (in m3/m3) (World Bank Group, 1998).
In 2002, Van der Merwe and Friends had a different record of 1.36 hectolitre of water per hectolitre of beer produced as the overall water balance ratio used at the brew house as shown in Figure 4 with a breakdown of the consumption of water used by each component of the brew house at the brewery. These components consist of the Mills, Mash tun, Lauter tun, Underback, Wort kettle, Whirlpool and relevant storage vessels meant for the addition of hops and syrup. In order to optimize the extraction of soluble substances like starch and protein from the malt, the malted barley, which has water in its composition, is milled and now termed grist.
Furthermore, water is mixed with the grist (after exiting the milling chamber), before being transferred to the Mash tun for conversion to a fermentable extract and later moved to Lauter tun which has water in its content already (a process described as Underletting) while in the Later tun a process known as Sparging gulps 41,760 hl of water. Thereafter, while in a vessel called Underback which accommodates the extracted mash liquor temporarily, some quantity of blending water is added to the Wort. An amount of water is then used to transfer between the vessels the resultant product derived from the wort kettle and also during the Clean-in-place (CIP) cycle (Van der Merwe and Friends, 2002).
Figure 5: Overall water balance for the brew house (flows averaged over a period of one week)
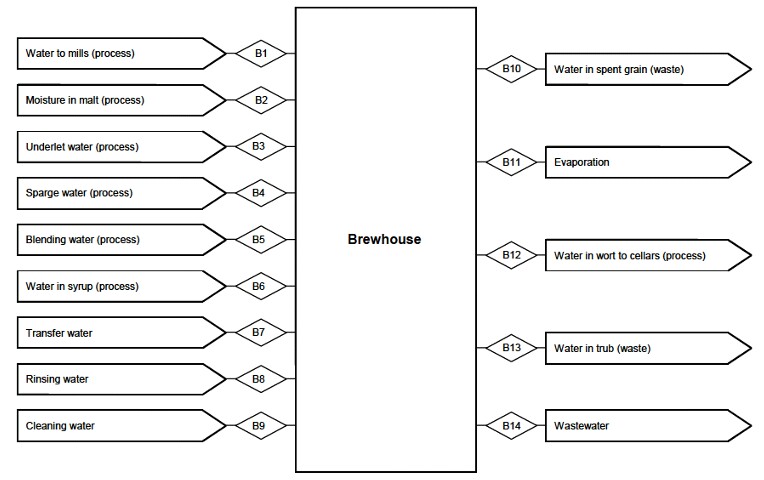
Source: Van der Merwe and Friends, 2002.
Tokos & Glavič had a similar discovery in his research as recorded by Brewers Research and Education Fund, BREF (2006), revealing the water usage in litres per litre of beer produced at the department from the Brew house to wort cooling and CIP to be within the range of 1.3 – 2.36 (L/L) (Tokos & Glavič, n.d.).
2.5.2. Water usage in the cellar
The cellar is a component of operations during the brewing process which is a continuation of the process accomplished at the Brew house. In this department, fermentation and yeast handling with CIP, maturation with CIP, and thirdly, filtration and BBT with CIP experienced water usage ratios per litre of beer produced within the range of 0.32 – 0.53 (L/L), 0.24 – 0.67 (L/L) and 0.31 – 1.09 (L/L) respectively as revealed by the BREF (2006) (Tokos & Glavič, n.d.).
After wort cooling, yeast pitching is the next operation in the cellar where water is added to the wort while fermentation follows and at the end of fermentation, a product termed green beer is derived and sent to the storage vessels for maturation via the racking process (which involves centrifugal separation, chilling and carbonation steps). This process prompts an addition of a cooling water transferred through the shell of the centrifuge and discharged to the drains in order to avoid the damage of the centrifuge (Van der Merwe and Friends, 2002).
Water is also used during the precoating process and backwashing and a quantity of deaerated carbonate water is also added to correct the alcoholic content of the high-gravity beer which is later stored in bright beer tanks (BBT) till when it will be packed into containers for distribution and consumption. For cleaning the vessels and transferring between the vessels a quantity of 38,010 hl and 14,912 hl of water is utilized respectively and at the end of the cellar operations, 0. 89 hl water/ hl packed beer was used (Van der Merwe and Friends, 2002).
Figure 6: Overall water balance for the Cellar (flows averaged over a period of one week)
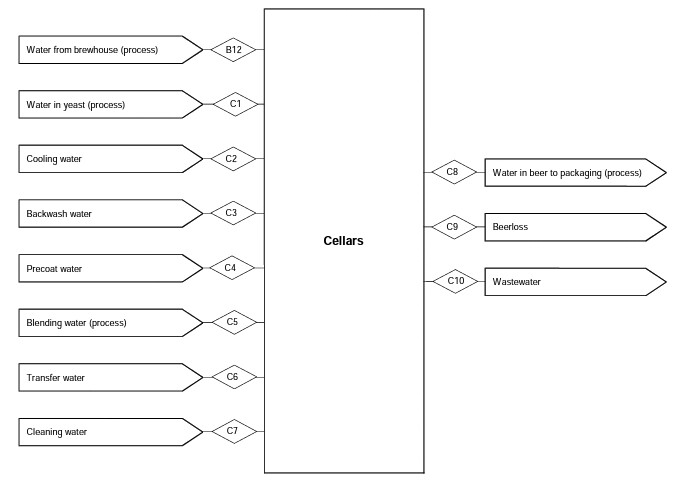
Source: Van der Merwe and Friends, 2002.
The German brewery industry reported that the process steps of wort cooling, fermentation cellar and yeast treatment, filter and pressure tank room and finally, storage cellar recorded water consumption per sold beer, as stated in figure above, of 0.0 within a range of 0.0 – 2.4 (m3/m3), 0.6 with a range of 0.5 – 0.8 (m3/m3), 0.3 with a range of 0.1 – 0.5 (m3/m3) and 0.5 within a range of 0.3 – 0.6 (m3/m3) respectively (World Bank Group, 1998). This shows from the compared research works that a reduction in water usage during cellar operation was experienced per volume of beer produced or sold by the breweries.
2.5.3. Water usage during packaging
In 1998, the World Bank Group “Pollution prevention and abatement” handbook revealed that during the packaging operations, bottling consumes 1.1 cubic meters of water per cubic meter of beer sold while barrel filling used 0.1 (m3/m3).
In Van der Merwe and Friends (2002) research work it was discovered that the packaging operations consume an overall of 153,290 hl water to pack 104,016 hl of beer with a water ratio at the packaging section as 1.47 (hl/hl). The sections of these operations that consumed water include; water used by the vacuum pump, the amount used to flush broken glass or cullet from the filler, to make-up the levels within the pasteurizer and to the cooling towers, the quantity utilized in washing and rinsing containers and crates and in transferring the beer to the filler up to the water used for wash down of equipments used in production as disclosed in figure 6 below (Van der Merwe and Friends, 2002).
Figure 7: Overall water balance for the packaging section (flows averaged over a period of one week)
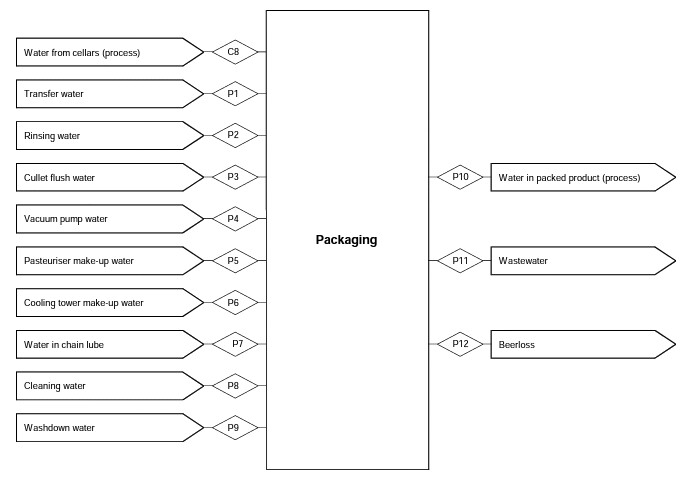
Source: Van der Merwe and Friends, 2002.
According to the Brewery Research and Education Fund (2006), Bottle washing and keg washing utilized a range of 0.59 – 1.63 (L/L) and 0.13 – 0.61 (L/L) respectively, as per water usage in packaging the beer produced (Tokos & Glavič, n.d.) which is a remarkable improvement in conserving water during brewing process.
2.5.4. General Water usage
The quantity of water used for wash down and other losses are considered as part of general water. General water is an additional water for production with a total of 104,413 hl used to supply 10,702 hl water to the brew house, 6,250 hl to the cellars and 26,250 hl to the packaging section with 40,476 hl evaporated at the engine room and boiler house as well as 20,735 hl discharged to the drain which eventually resulted into 1.00 (hl/hl) water used in these operations for beer production (Van der Merwe and Friends, 2002).
The water consumption reported for the German Brewing Industry revealed the general water usage and their ranges per cubic meter of beer sold (m3/m3) to include; 1.5 (1.0 – 3.0) for wastewater from cleaning of vehicles, sanitary use etc., 0.2 (0.1 – 0.3) for steam boiler and 0.3 (0.1 – 0.5) for air compressor (World Bank Group, 1998).
2.5.5. Comparing water usage trends
The research by World Bank Group in 1998 had a total of 6.6 overall water consumption ratio for cubic meter of water usage per cubic meter of beer sold which also falls within a range of 4.9 – 12.6 (m3/m3). A significant improvement was recorded in 2006 by the Brewer Research and Education Fund (BREF) when a ratio within the range of 3.7 – 4.7 (L/L) overall water usage ratio was experienced for a litre of water used per litre of beer produced as shown in figure 2.
However, the reviewed research work of Van der Merwe and Friends in 2002 also showed that 491,723 hl volume of water was used to produce 104,016 hl of packed beer per week and the result disclosed the overall water balance ratio to be 4.73 (hl/hl) in the South African brewery investigated. Figure 7 compared two research studies on the same subject matter embarked upon in 1986 and 1987 by Binnie & Partners and Pollution Research Group respectively which unveiled that the overall water ratio used in the manufacturing of beer at two different breweries were 6.65 (in 1986) and 6.28 (1987) which means a reduction in water usage was experienced 15 years later on beer production (in another brewery site) with 4.73 overall water ratio in 2002 as obtained Van der Merwe and Friends (2002).
Table 3: The calculated water ratio per section for the brewery, compared to other sites
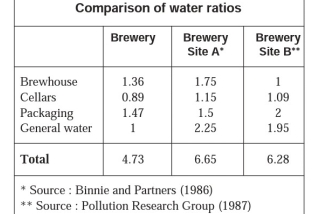
Source: Van der Merwe and Friends, 2002.
A consistent improvement in water use ratio by breweries was discovered in 2011 during a research performed by Beverage Industry Environmental Roundtable (BIER), comprising of mostly larger breweries, for the purpose of benchmarking water usage for production in beverage industry and identifying the trends. The study compared water use ratio (L/L) trends in three consecutive years (from 2008 to 2010) and found that 4.74, 4.52 and 4.28 respectively were the ratio of water usage for production to total quantity of produced beverages as illustrated in figure 8 below.
Figure 8: Beverage Industry Environmental Roundtable (BIER) Brewery Water Use Ratios.
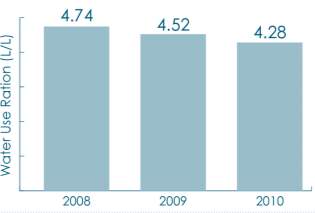
N = 211
Range (2010) – 3.26 – 7.44 (L/L)
Improvement = 10%
Source: Brewers Association manual, Segment Profile: Water Usage & Wastewater Generated by Craft Brewers.
Those three years investigated by BIER also experienced a similar research study on “the Environmental Performance of the European Brewing Sector” which was commissioned by the Brewers of Europe, a trade confederation for the brewing sector in Europe. The study indicated specific water consumption ratio per hectolitre of beer produced for 2008, 2009 and 2010 to be 4.4, 4.4, and 4.2 respectively with a “change” of -4.5% denoting that the amount of water used per hectolitre of beer experienced a depreciation by 4.5% with a corresponding decrease in wastewater produced while an average of 4.2 litres of water was used in the production of a litre of beer (Donoghue, et al., 2012).
Beverage Industry Environmental Roundtable (BIER) proceeded with a beer only beverage study on 296 breweries in 2012 which revealed the water use ratios of the breweries from 2009 to 2011 consecutively as illustrated in figure 9. Some factors were however attributed to the recorded water use ratios and they include package type and facility size. The BIER study then explicitly explained the former to be the difference between the water use for small packaging (12 oz. Bottles or Cans) and bulk packaging (kegs or tanks) and the later involves the lower water use ratios reported on facilities with larger volumes of production (Beverage Industry Environmental Roundtable, 2012). It was further stated that 83% of the breweries understudy showed an improvement of 12% on the water use ratio for the three consecutive years (2009, 2010 and 2011) on the breweries that produce beer which was said to be remarkable (Beverage Industry Environmental Roundtable, 2012).
Figure 9: Brewery (beer only) performance
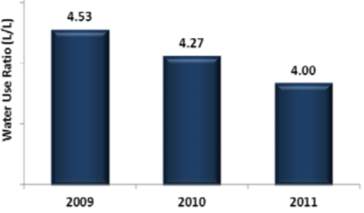
N = 296
Range (2011) – 3.17 – 6.62 (L/L)
Improvement = 12%
Source: Beverage Industry Environmental Roundtable (2012).
The reviewed research works have unleashed that, quite number of factors could influence the water usage trends to favour the breweries in production and profit maximization in the production of beer. The reduction experienced over time in water usage by the brewing sector can be attributed to efficiency improvement, cost reduction, risk minimization, brand marketing and image enhancement (Brewers Association, n.d.). All these factors came into existence with the aid of the water management practices adopted by the breweries to enhance their production and sales.
2.6 Differences between Mainstream Brewing and Craft Brewing Processes.
It has previously been notice that craft beers use significantly less water than large-scale breweries in trying to create their product. As such, in order to understand the difference between these two water use levels, it is important to understand that the basic process used to create the two kinds of beer are very different.
Most notably the differences can be seen in their production. A brewery that produces less than 15,000 barrels per year, and which sells 75% of its total stock off-site, is microbrewery, and would be considered a “craft” beer maker (Brewers Association, 2016). Somewhat similarly, a contract brewing company is typically set up to make a large number of total barrels, but in small batches. In these cases, craft beers, made in small, highly controlled batches, are made within a site created to store and brew multiple lines of beers at a time. However, the actual brewing process is in many ways still more similar to craft beer, because of the type of equipment used, in order to obtain these small batches (Brewers Association, 2016).
The process used to do these small-brew beers is markedly different than region breweries, or large-scale breweries, which create batches of between 15,000, and 6,000,000 barrels per year, with a few, like Anhauser Bush, having an annual production rate of even more than 6 million barrels per year (Brewers Association, 2016). This is significant, in that the two use very different processes, with large- scale breweries using a more mechanized or animated, less hands-on approach, in order to use an assembly-line like scenario to create a very large total production, of a few lines of beer.
These very different processes also result in a very different amount of water use. Generally industrial breweries use between 5 and 6 litres of water, per litre of beer (Perry & De Villers, 2003). However, craft breweries use individualized production processes, to create beers that are unique in flavour and texture, and are les closely regulated than large-scale breweries, and so vary within a much wider range than industrial processes.
2.7 Waste water or effluent treatment options
Water recycling has gain more interest as regulations have become more stringent with the increment in the cost of water (Braeken, et al., 2004). This raised the need to treat wastewater/effluent for reuse in the breweries. Effluent treatment is an end-of-pipe means of controlling water pollution for reuse in the brewery or for disposal to the environment.
The treatment of brewery wastewater effluent is a costly and relatively complex activity most especially when it demands meeting up with governmental regulations and environmental friendliness (Reed & Henderson, 1999; Kanagachandran & Jayerantene, 2006). The reclamation and reuse of wastewater have become an important option since industrialization and urbanization have increased the water pollution in our environment thereby making it a limited resource for water supply (Seo et al., 1996). In essence, wastewater can be an alternative water source that can beneficially and costs effectively decrease the demand for freshwater, when treated properly and recycled (Simate et al., 2011).
Table 4: Characteristics of brewery wastewater
| PARAMETER | VALUE |
| pH | 3–12 |
| Temperature (°C) | 18–40 |
| COD (mg L−1) | 2000–6000 |
| BOD (mg L−1) | 1200–3600 |
| COD: BOD ratio | 1.667 |
| VFA (mg L−1) | 1000–2500 |
| Phosphates as PO4 (mg L−1) | 10–50 |
| TKN (mg L−1) | 25–80 |
| TS (mg L−1) | 5100–8750 |
| TSS (mg L−1) | 2901–3000 |
| TDS (mg L−1) | 2020–5940 |
Source (Simate et al., 2011)
some wastewater treatment options which are being utilized by breweries will be reviewed below:
2.7.1. Physical treatment
This option of effluent treatment may involve a passive process where naturally suspended pollutants are allowed to float to the top as sedimentation while the physical treatment is mainly for removing coarse solids and other large materials rather than dissolved pollutant. The first sequence of a physical treatment option is the flow equalization and it is a technique used to consolidate wastewater effluent in holding tanks for “equalizing” before introducing wastewater into downstream brewery treatment processes or even directly into the municipal sewage system (Olajire, 2012).
Screening is typically the sequence where the wastewater is first screened to extract out glass, labels, and bottle caps, floating plastic items and spent grains. After this process, the grit chamber receives the effluent where sand, grit and small stones settle to the bottom, a sequence known as grit removal. Gravity sedimentation comes up thereafter as wastewater still contains dissolved organic and inorganic constituents along with suspended solids which consist of minute particles of matter that can be removed from the wastewater with further treatment such as sedimentation or chemical flocculation.
2.7.2. Chemical treatment
pH adjustment and flocculation are the most commonly used method of chemical treatment in breweries to removing toxic materials and colloidal impurities. For the former, it is said that in order to protect organisms the pH of the wastewater needs to remain between 6 and 9 as low pH indicates increasing acidity and increasing alkanity means high pH and 7 denotes neutral. Therefore, the acidity or alkalinity of wastewater affects both wastewater treatment and the environment. Flocculation which is second most used method is the stirring of chemically-treated water to induce coagulation while it enhances sedimentation performance by increasing particle size resulting in increased settling rates (Olajire, 2012).
2.7.3. Biological treatment
This treatment can be either aerobic or anaerobic treatment method and it comes after the effluent had passed through physical and chemical treatment discussed above.
The aerobic is performed in the presence of air/oxygen by aerobic microorganisms which are majorly bacteria that metabolize the organic matter in the wastewater, thereby producing more microorganisms and inorganic end-products. These microorganisms convert nonsettleable solids to settleable solids after which sedimentation come up to settle out the settleable solids.
However, for the treatment of a brewery wastewater type called Industrial Process Wastewater (PWW) there are common types aerobic wastewater treatment plant (WWTP) systems used. They include: Activated sludge process, Attached growth (biofilm) process and Lagoons. Furthermore, the biofilm process is of three types known as Trickling filter process, Biofiltration towers and Rotating biological contactor process.
The anaerobic wastewater treatment involves no use of air or elemental oxygen for treatment and it is characterized by biological conversion of organic compounds by anaerobic microorganisms into biogas which can be used as a fuel-mainly methane 55-75 vol% and carbon dioxide 25-40 vol.% with traces of hydrogen sulfide (Briggs et al., 2004 cited from Olajire, 2012). Upflow anaerobic sludge blanket and Fluidized bed reactor are the two methods of anaerobic wastewater treatment.
2.7.4. Microbial fuel cell technology
A valuable alternative to energy generation and wastewater treatment are offered by the microbial fuel cell (MFC) technology (Bennetto, 1984). The new approaches to reduce cost and produce side products in waste water treatment have gotten high recognition recently. A side product produced by MFC device is electricity while simultaneously the device is also used to treat wastewater (Habermann and Pommer, 1991).
MFC noticeably having characteristics of anaerobic and aerobic combined system can be regarded as an anaerobic treatment process in anode chamber while in the cathode chamber it is known as a complete unit with an aerobic treatment process (Olajire, 2012).
2.7.5. Nanofiltration
In 2004, a research study on “Regeneration of brewery waste water using nanofiltration” was embarked upon to investigate the possibilities of nanofiltration for the treatment of brewery wastewater streams with the aim of recycling in order to decrease the amount of fresh water needed (Braeken, Van der Bruggen & Vandecasteele, 2004). The research further disclosed the four water streams that were filtered using the four nanofiltration membranes which are; the waste water after biological treatment, bottle rinsing water, rinsing water of the brewing room and rinsing water of the bright beer reservoir.
It is required that the drinking water standards are complied with as it is inappropriate to recycle regenerated water for brewing water without compliance with the standard and Nanofiltration, in broad of applications, has shown good outcomes for the removal of organic compounds in water and effluents (Braeken, Van der Bruggen & Vandecasteele, 2004).
Figure 7.
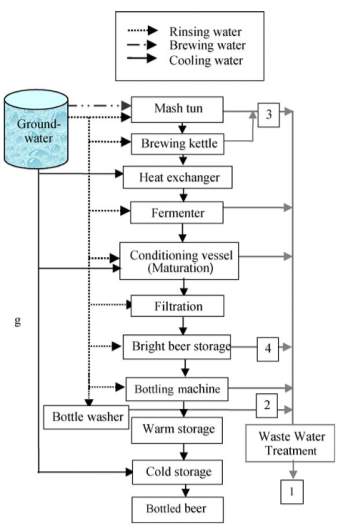
Source: Braeken, et al., 2004.
The Schematic representation of the brewing process. The selected streams for nanofiltration are the biologically treated waste water (1), the bottle rinsing water (2), the rinsing water of the brewing room (3) and the rinsing water of the bright beer reservoirs (4).
The four different membranes revealed earlier for the nanofiltration experiment are UTC-20 and UTC-60 which was manufactured by Toray Ind. Inc. in Shiga, Japan and likewise Desal-HL-51 and Desal-5-DK produced by Osmonics SA in Vista, United States of America while the experimentations were performed in a cross-flow equipment on laboratory scale (Braeken, Van der Bruggen & Vandecasteele, 2004).
In order to remove the protective coating, the membranes were washed with distilled water and soaked in the water for 24 hours, prior the start of the experiments. Thereafter, the pure water flux of the membranes was measured with distilled water (pH7) denoting the first step of the experiment while the subsequent step involved the use of nanofiltration membranes to filter the brewery wastewater stream for 3 hours.
The outcome of this research unveiled the fact that only biologically treated waste water out of other waste water streams is suitable for recycling using nanofiltration while the removal of Chemical Oxygen Demand (COD), Sodium (Na+) and Chloride (Cl) with nanofiltration was sufficient for the biologically treated wastewater.
2.7.6. Electrochemical treatment method
This method of wastewater treatment was first used to treat sewage generated onboard by ships (Bockris, 1977) and there after it fetched for itself great acceptance in treating industrial wastewater that are rich in refractory organics and chloride content (Vijayaraghavan et al., 2006; Barrera-Díaz et al., 2009). Electrochemical methods of treatment are neither subject to failure due to variation in wastewater strength nor due to the presence of toxic substances and require less hydraulic retention time (Simate et al., 2011).
The oxidizing agent that destroyed organic compounds present in the brewery wastewater is hypochlorous acid and was generated using a graphite anode and stainless-steel sheet as a cathode in undivided electrolytic reactor (Vijayaraghavan et al., 2006). The generation was known from a novel brewery wastewater treatment method developed by Vijayaraghavan et al.
2.8 Integration of processes and technologies
2.9 Summary
The current chapter has provided an overview of the theoretical basis for reduction of water in the brewing process. This provides a framework for understanding changes in the manufacturing process which have resulted in the reduction of water use overall. More specifically, it has provided a basic scope for the ways that water conservation is carried out, and to see how water is reduced, reused and recycled within the larger manufacturing setting. In the next chapter, the specific methodology which will be used to gather data related to changes in the use of water in beer brewing over the last 20 years.
Cite This Work
To export a reference to this article please select a referencing stye below:
Related Services
View all


Related Content
All TagsContent relating to: "Engineering"
Engineering is the application of scientific principles and mathematics to designing and building of structures, such as bridges or buildings, roads, machines etc. and includes a range of specialised fields.
Related Articles

DMCA / Removal Request
If you are the original writer of this dissertation and no longer wish to have your work published on the UKDiss.com website then please: