Radar Based Traffic Monitoring System Development
Info: 11675 words (47 pages) Dissertation
Published: 21st Dec 2021
Tagged: EngineeringTransportation
Abstract
Contained in this report are the complete details of progress and developments of the year long M.Eng project at UCL Electronics and Electrical Engineering department for the development and design of a Radar based traffic monitoring system for developing countries. The system designed here operates by means of small unitary radar hubs mounted alongside the road all working independently to monitor traffic speed and to relay the information gathered to a “master” database by GSM. During the course of working on the project, a lot of emphasis was placed on the feasibility and cost of implementation with relation to the target environment and so in many cases compromise had to be made after long deliberation as to whether using a more complex, advanced technology was as good as a cheaper, less specialized solution in the current socio-environemtal context. Such deliberations included but weren’t limited to; the medium of long distance communication, and accuracy of certain radar methodologies and infrastructure etc.
Introduction
Developing cities are urbanising at impressive rates with trends set to continue. This is often well received as urbanisation has a strong correlation with prosperity and economic growth. Despite the potential to drive growth, one cannot ignore the considerable downsides that come with it. Opportunities of work and good education has caused an influx of people to these cities increasing population density and strain on the city’s infrastructure. A commonly known effect of this is traffic congestion. Traffic congestion has become a major concern for these cities as productive hours are wasted, queuing on roads to and from work. Without any intervention, this problem will ensue and will become even more of a threat to economic growth. Tackling these downsides require effective urban governance with a better understanding of the scope and magnitude of the gaps and limitations of existing infrastructure and public service delivery. However, developing cities usually do not have installed technologies that can allow government bodies to directly strategize and invest.
In this report, we will develop an integral tool to solve this problem. By first understanding the background of traffic congestion in developed countries and attaining what measures have been taking to address this, we can begin to understand the shortcomings of developing countries. To research this we use Lagos, Nigeria as a case study. Lagos is one of the world’s most populated cities with little to no alternative mode of travelling from road use presenting a good city to research. The impacts of these conditions are analysed and from this, we find the opportunity to bring an engineering solution to this problem. To do this we will look at the existing technologies that currently monitor traffic. In the analysis of these technologies we will uncover limitations and reasons why such technologies cannot be used in developing cites like Lagos. With this knowledge, we will begin to discuss the theory and ways in which we can monitor traffic. Through careful analysis we will filter down the ideas into one defined system design. This system design will be broken down into two sections. Beginning with the hardware implementation we document the circuitry behind the system. The software implementation follows after, with detailed discussions of the programming behind the system and explanations of segments of code which are developed across several platforms. From this, we show the results of the system using the output databases and maps we created and discuss how we have incorporated edge cases into the design. Finally, we discuss ways in which the Traffic Monitoring System can be developed further for the end users and for use in other developing cities.
Background
Transport systems form a critical construct of a country’s development and economic productivity, essential for community, industry and wellbeing. The ability for individuals to freely access different parts of the country allows for the structure that countries hold today, with city centres, suburbs and rural areas. Mobility across these areas is critical as many people flow from the outskirts to the city, contributing to the sustenance of the country by working for its many industries and outlets. Furthermore, transport improves our quality of life by improving safety, security and access to sources of livelihood. On a larger scale, transport allows for greater globalisation which can also improve economic ventures including trade, international investment and tourism.
For these reasons cities and other urban areas started to grow in the early 1900’s. Cities like London grew from 6.5 million to 11 million in 30 years. With this population growth also came the introduction of automobiles, a revolution to transportation which will allow people to travel further distances than before in the same period of time. This development of vehicles, road use and population growth created a challenge to these cities. An increased use of road networks, caused slower speeds and longer commute times. Essentially, the demand for roads – the number of individuals driving vehicles on roads – outweighs the available infrastructure. This is what is now known as traffic congestion.
Traffic congestion became a common feature to urban cities. It tends to occur when there are particularly popular routes connecting several key areas, for example, the morning rush of commuters on their way to work in the city and on their way back home in the evening. With most work hours being from 9am to 5pm, this occurs around 8-9am and 5-6pm coining the term “Rush Hour”. Congestion was initially concentrated in city centres and their immediate surroundings however, after the development of the automobile and railway systems, congestion spread beyond metropolitan areas* into the suburbs where many inhabitants require access to the city
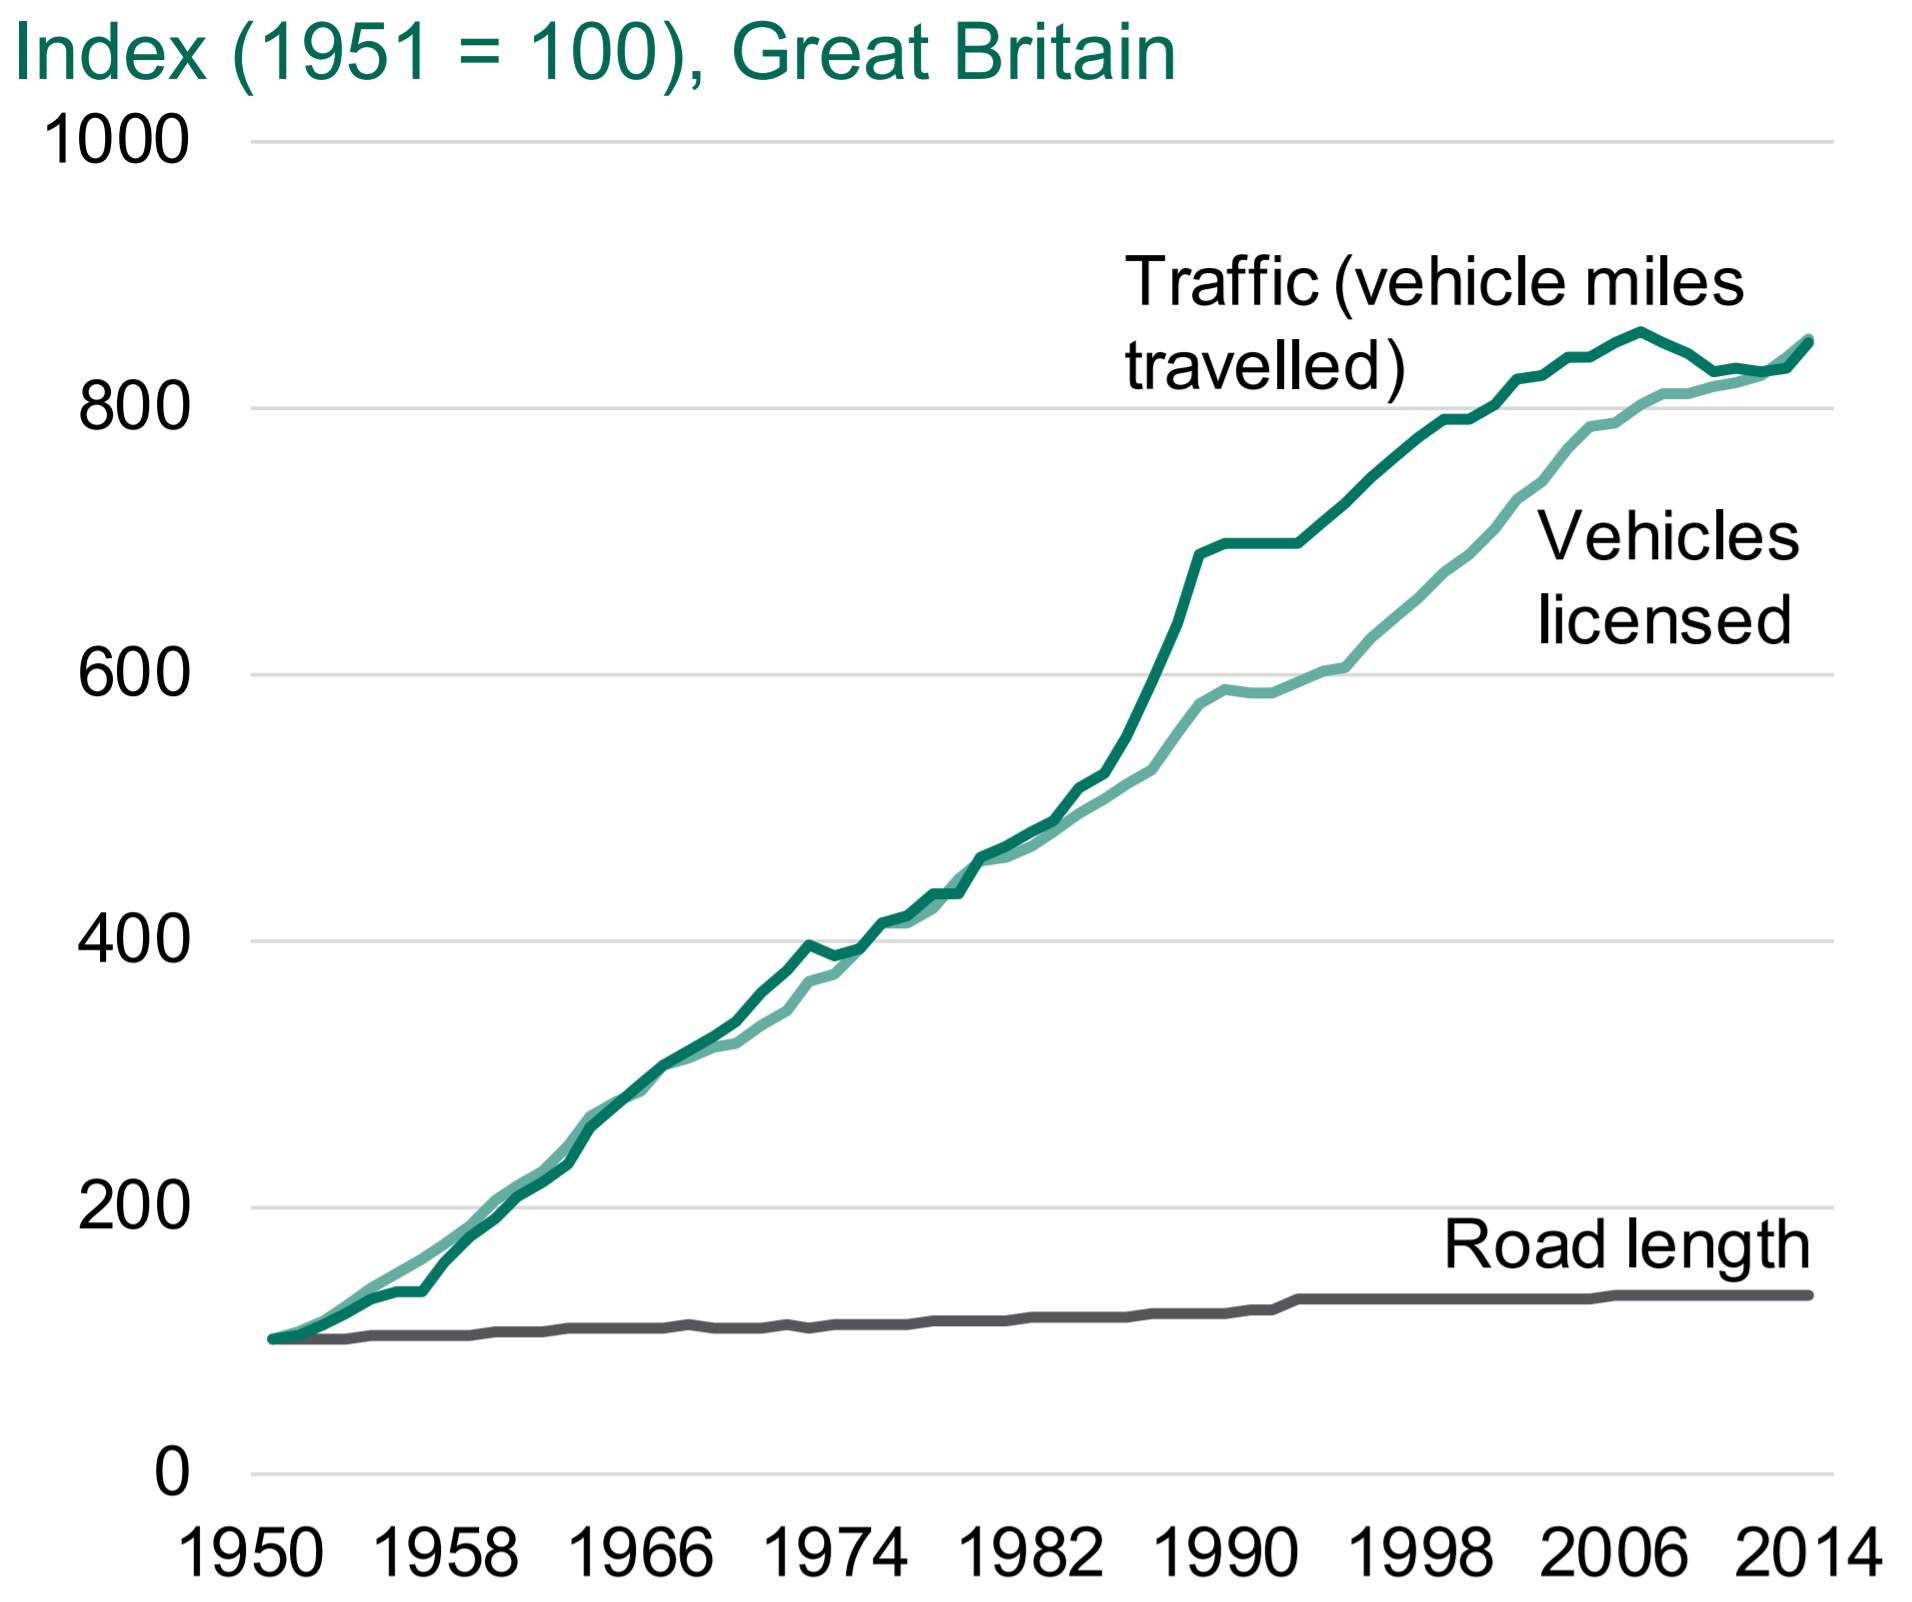
Traffic in the UK increased by 7 times from 1950 to 2014.
Traffic Congestion – Developed Countries
Today, congestion has become a global challenge. Optimising and improving transport links is increasingly at the forefront of government agendas worldwide, particularly with the ever-increasing immergence of mega cities with fast-growing populations. These rapidly expanding cities places a strain on existing transport infrastructure, resulting in the congestion on roads, trains and buses.
There have been several ways in which developed countries have attempted to reduce traffic congestion. Many cities, including Copenhagen in Denmark and Montreal in North America, have generously invested in developing cycle friendly transport systems as a healthy, environmentally conscious solution to congestion. Other cities like London have incorporated road policy such as the congestion charge to persuade people to use other means of transport to the city centre.
However, even with these advances congestion persists to be a problem. According to INRIX drivers spent 9% of their driving time stuck in congestion and traffic congestion cost UK more than £30 billion in 2016.
Traffic Congestion – Developing countries
Developing countries are urbanising at impressive rates with trends set to continue. Urbanisation is an instrumental stepping stone for countries moving from poverty to prosperity. While urbanisation may be the reason for economic growth in these countries, we cannot ignore the negative impacts such as increasing density, public health, environmental challenges and increasing congestion
These cities throughout the world have found themselves at the brink of massive traffic inflation, hence restricting their ability to manage traffic. The situation has worsened for developing regions due to the following reasons:
- Unplanned cities: Roads tend to be narrow and poorly built. As cities grow in an ad-hoc manner, no provision is made towards scaling road capacities, eventually resulting into several bottleneck roads, which remain congested for extended periods of time. Furthermore, many developing countries have witnessed an explosive growth in their vehicular population resulting in a failure of conventional traffic management strategies.
- Poor discipline: Drivers often are not trained sufficiently to follow lane discipline. The impact of poor lane discipline, especially at traffic junctions, deteriorates the already overcrowded junction situation. Furthermore, drivers frequently jump red lights and block the intersection, causing further traffic congestion. These problems are compounded by the fact that traffic law enforcement is poor, thereby providing no incentive for drivers to follow the rules.
- Alternate traffic means: Countries with fast growing economies have witnessed a surge in the number of vehicles across major cities. These cities seldom have efficient mass transit systems, forcing people to operate private vehicles. This problem is compounded by the social stigma, where people view operating a private vehicle as a sign of prosperity, while public transport is viewed as being used by the lower echelons of society.
- Archaic management: Traffic junctions are often unmanned, thereby allowing drivers to drive in a chaotic manner. Even if a junction is controlled by a warden or a traffic light, the traffic junctions are largely independent of any traffic management strategy, only optimizing the respective junction traffic flow, in the direction of maximum traffic build up. Furthermore, these approaches enhances traffic mismanagement in already congested roads, accelerating congestion collapse.
- Tighter budgets: A significant amount of investment is required to set up a traffic management infrastructure which can scale with the increasing traffic. Such an infrastructure not only involves measuring and analyzing real-time traffic data but also focuses towards enhancing congestion detection, solving real time congestion and forecasting congestion scenarios. In developing countries, ravaged by corruption and bureaucracy, there are multiple hurdles before the money actually progresses towards such large initiatives.
Tackling these downsides require effective urban governance with a better understanding of the scope and magnitude of the gaps and limitations of existing infrastructure and public service delivery.
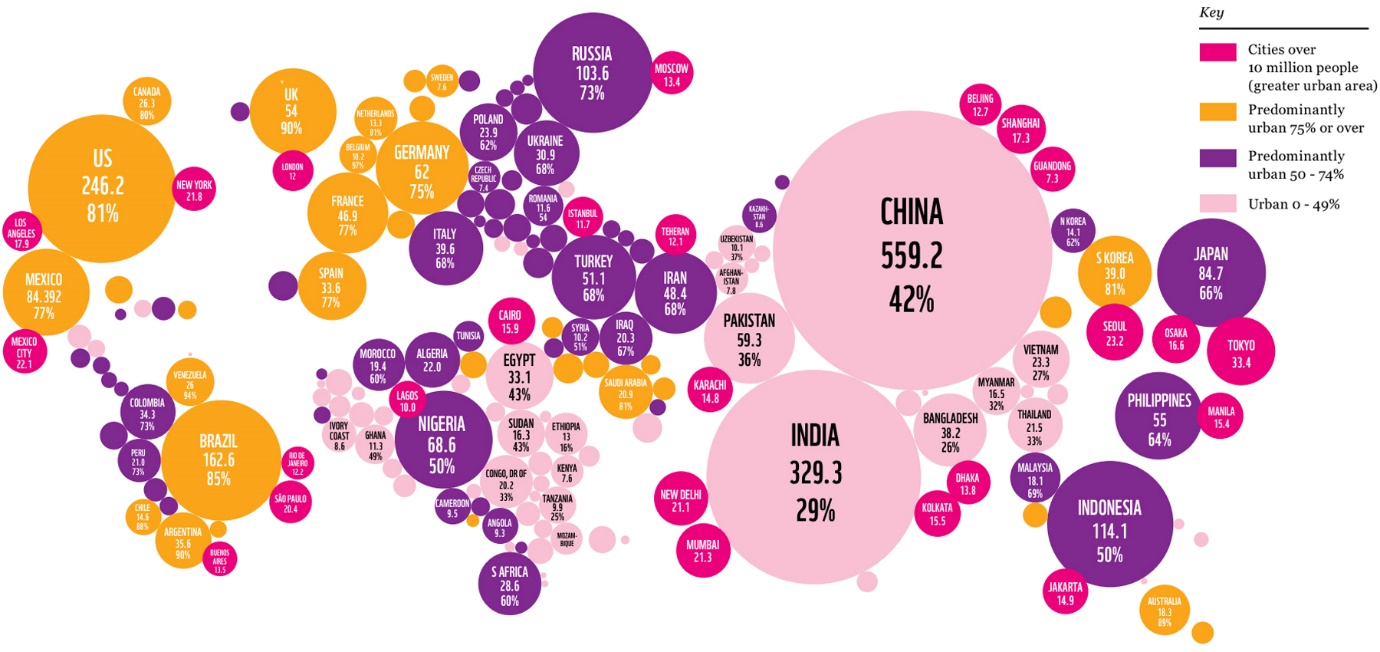
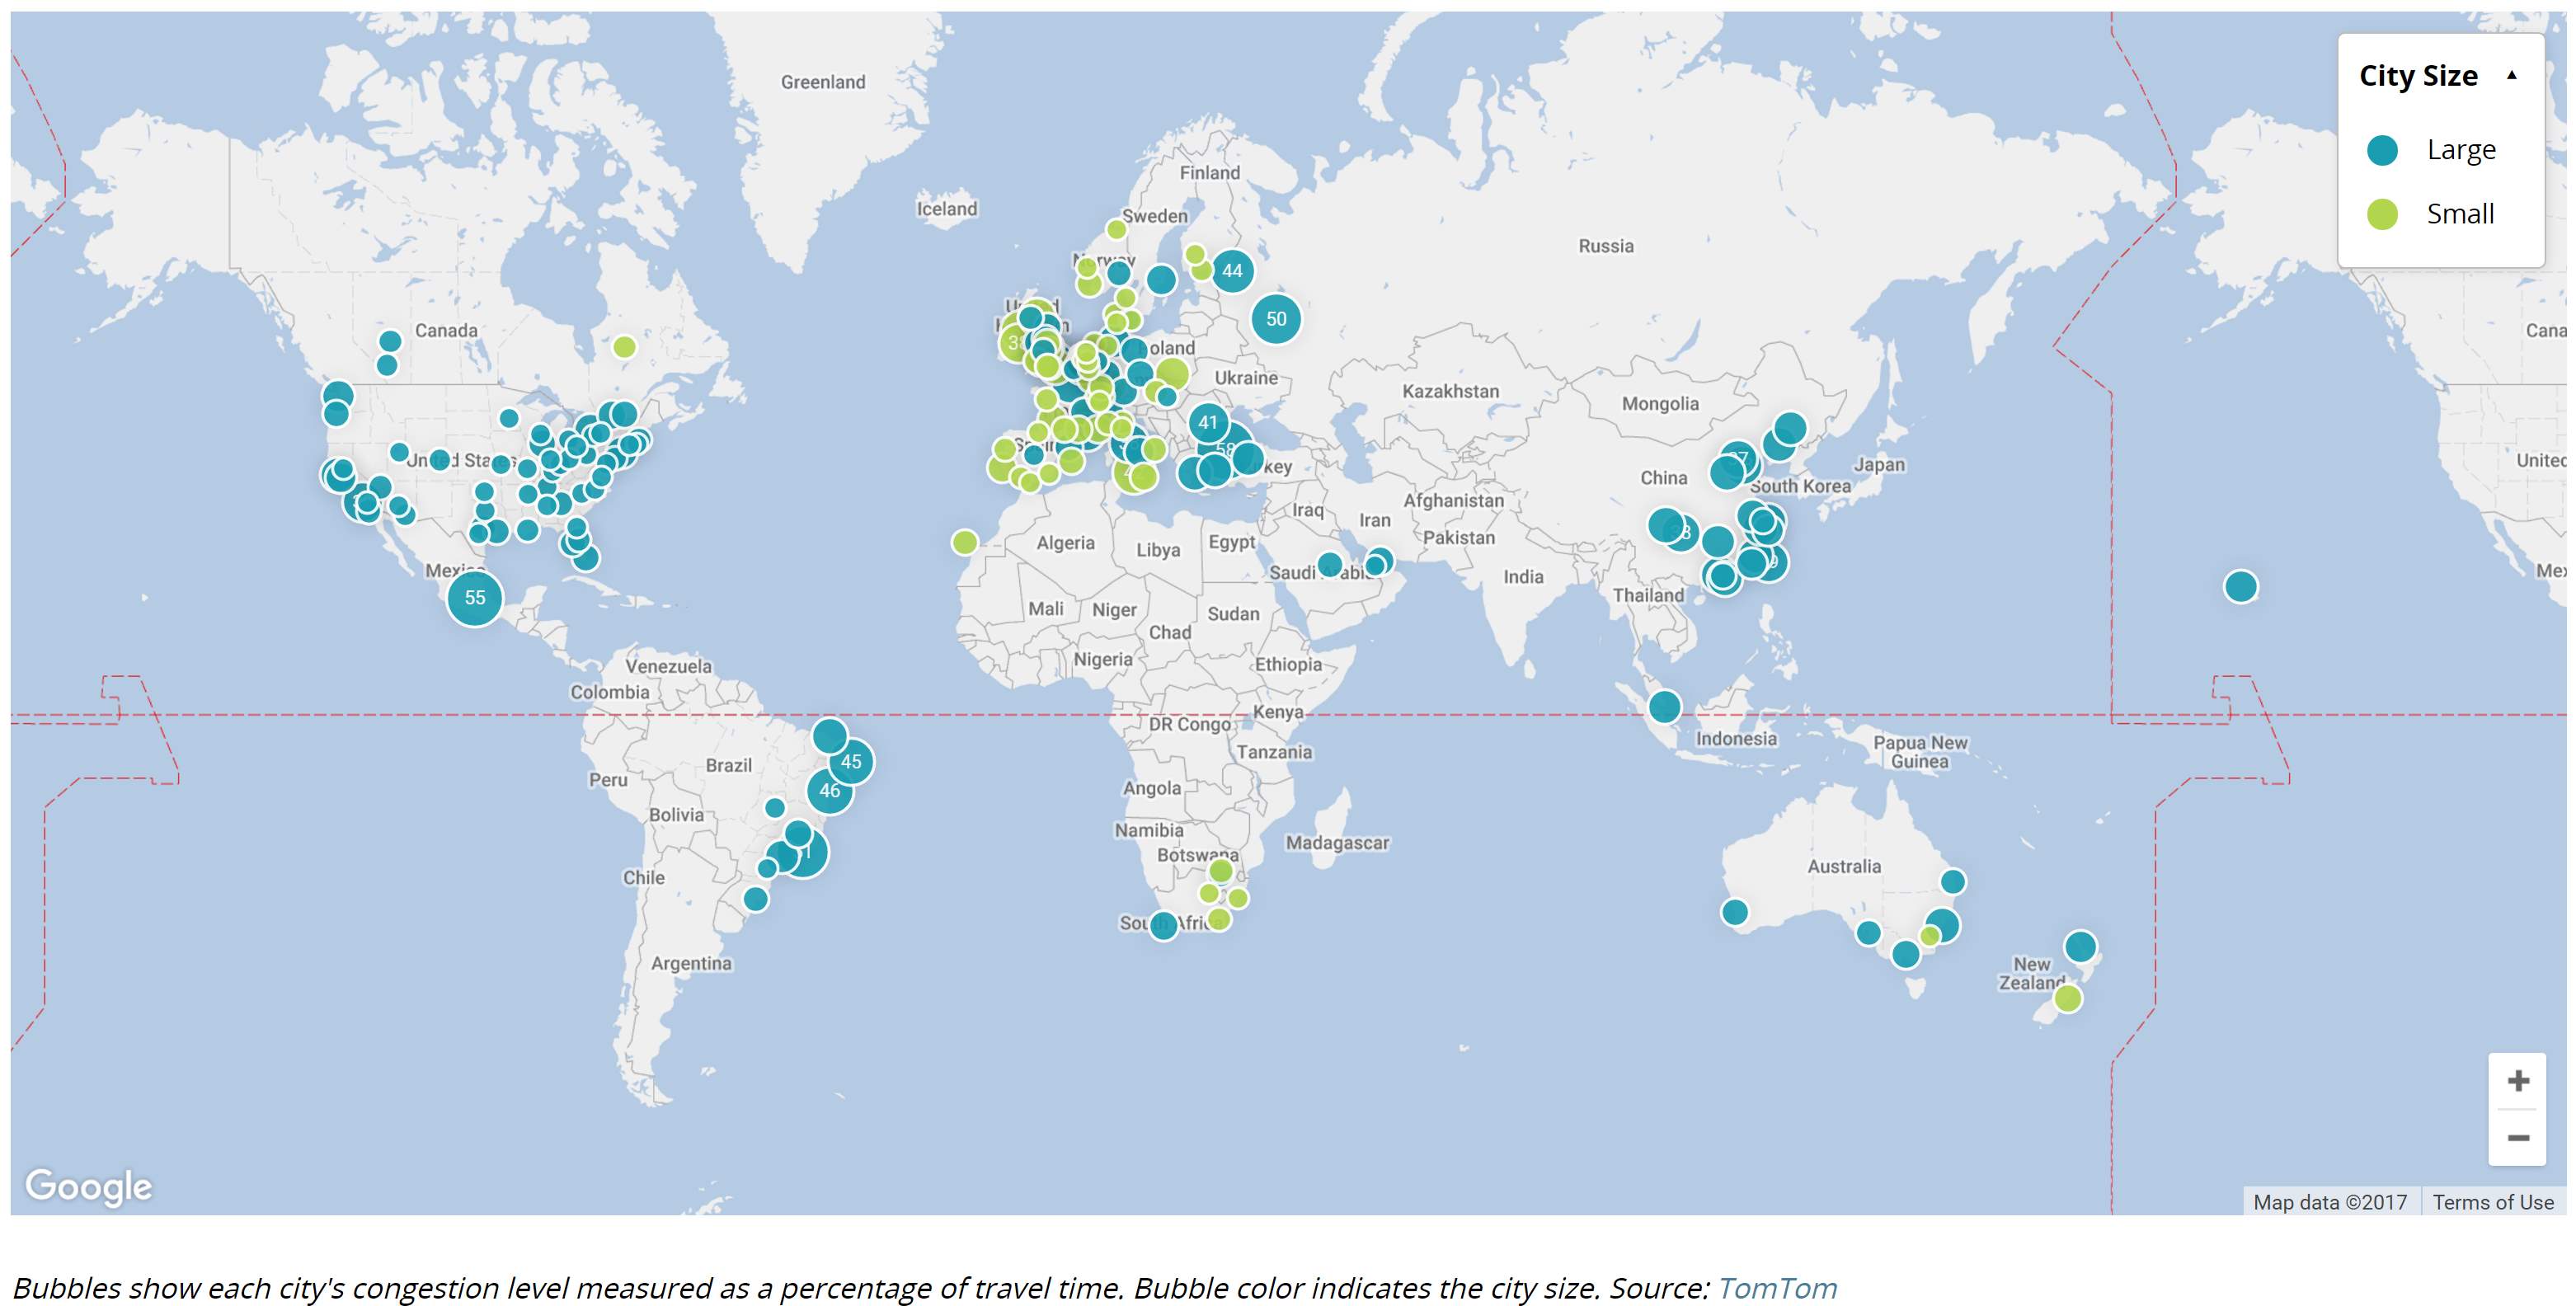
However, it is often difficult to find this information. A common trend you will see with the above statistical data for traffic congestion worldwide is missing data in developing countries. There is no surprise here as these developing countries do not have the same level of technology to provide this information. The issue of traffic congestion however is still, if not more of a concern in these areas.
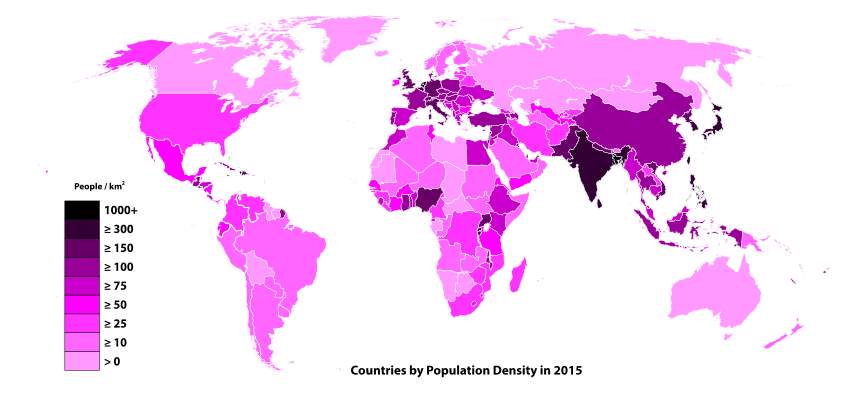
From the above graph we can see that these same developing cities rank the highest in population density. In the top 40 cities of population density, only 4 cities are considered to be developed. This information coupled with the correlation between population density and traffic congestion produces an outstanding number of people living in areas that have worse traffic congestion than London, with most of the cities not even having efficient public transport systems. Furthermore, a common feature for these cities is that they people are migrating from rural areas in hope for better living and job opportunities therefore having higher population growth. It is no surprise these cities have inhibited economic growth.
Lagos, Nigeria
Lagos is the largest city in Africa. It is located in the south-western region of Nigeria. Lagos holds the rank for the thirds world’s highest population density. To put that into context, Lagos is 1000 km2, two-thirds’ the size of London at 1500 km2. London has an estimated 8.7 million people, Lagos has a population 2.5 times bigger at 21 million people. Lagos is essentially two cities in one. It’s split between the mainland, where the vast majority live, and the island, connected to the rest by the Third Mainland Bridge, the second longest bridge in Africa. Congestion all over the city is a major issue, but that on the 12km bridge acutely demonstrates how manic and pervasive its traffic can be. On an open road the journey across the bridge takes 15 minutes. In the morning rush hour, or at any time after 4:30pm, it can take up to 4 hours.
The impact of traffic congestion is susceptible to anyone witnessing delay on Lagos roadways. An estimated 8 million people travel to work via public transportation each day on the 9,100 roads and expressways available in Lagos (World Bank, 2009). With more than 1 million registered vehicles in 2011, there are potentially more than one million trips made during the peak travel periods of the day. This is much more during seasonal festivities such as Easter and Christmas when there is an influx from other parts of the country.
The commission said about 10.6 million registered vehicles are estimated to ply Nigerian roads nationwide in 2016, a number, it said exerts enormous pressure on available roads in the country.
Commuters in Lagos experience the effects of traffic congestion on a daily basis. According to Adebiyi (2011), the congestion is caused partly by road users themselves. Lagos road users are known to be very impatient and bad at obeying traffic rules. Indeed, many times traffic congestions have been caused by a driver refusing to give way for another motorist. The effects of congestion are many fold; some directly affect the drivers’ sense of wellbeing, be it times wasted sitting in a traffic queue and the changes in the behaviour of drivers. Such behaviour might include rude gestures, verbal insults, deliberately driving in an unsafe or threatening manner, or making threats. This can further lead to altercations, assaults, and collisions which result in injuries and even deaths.
Federal Road Safety Commission (FRSC) on Tuesday gave a startling revelation indicating that Nigerian road congestion is leading to increased accidents claiming human many lives. The main cause of these accidents is over speeding. Officials stated that in Nigeria, “speeding accounts for over 60 per cent of accidents we have on our roads today”. More Nigerians die from road accidents, than from violence.
The inability to accurately retrieve data on road congestion due to non-existent technologies has birthed the idea for this project. To create a cost effective solution that does not rely on new technologies such as sat-nav but can still receive the data needed to monitor traffic.
Impacts, opportunities
Now admittedly, there are several other causes to traffic congestion in Lagos. The conditions of the roads have been a significant problem to do the inadequate maintenance and repair of pot holes and drainage systems. Vehicles on these roads likewise, have not been serviced for years, so daily you will come across broken-down vehicles causing lanes to be closed and creating bottlenecks. Traffic lights have been a feature recently introduced to some major intersections in Lagos, however the education of how to use this lights and penalties for failing to do so have not been enforced as well as they should. Inadequate public transport systems will be the biggest reason for traffic congestion. Currently there are no railway networks in Lagos. Meaning that everyone needing to travel will have to do so by road. The public buses are not serviced and overloaded with people creating a very unsafe means of travel.
We understand that the Traffic Monitoring System and the data it generates will not directly address the traffic congestion. It will however allow Lagos State Traffic Management (LASTMA) to strategically invest. Richer data produces more in depth analysis that can better pinpoint congestion. Daily data can be merged with socio-economic and event data to pattern travel mode choices and evidence the potential causes of traffic jams. This evidence can be used to tailor policy interventions and assess implementation feasibility. Which roads are prioritised to repair or even expand will be backed by this data. Traffic lights that have been ignored can be prioritised by the impacts on traffic these lights have. Intersections that need traffic lights will be identified. Future public transport systems such as rail networks can be designed to parallel or connect popular routes and destinations.
This Traffic Monitoring System can also serve other developing cities as well. Observing the patterns early on can allow transport systems to be developed well before the land surrounding these networks are developed.
Existing Technologies
Technical - Speed cameras, radar guns
The problem being tackled is two-fold, comprising of vehicle traffic monitoring and traffic congestion. In the area of vehicle traffic monitoring, different technologies have been employed for the sensing of vehicles and the monitoring of traffic flow by reason of the information gathered through these detection methods.
Manual Counting
This is the simplest traffic monitoring method and as the name suggests involves people manually counting vehicles. The individuals counting either make use of electric handheld counters or they record the data using some sort of tally sheet. Of course these individuals could either be at the roadside, which introduces inconvenience and the risk of danger into their jobs, or they could be elsewhere counting off a recorded video. Th latter requires installation of video cameras and can be seen an underdeveloped form of Video-based detection which will be seen shortly. Manual vehicle counting has proven to be about 99 percent accurate [need reference here]. In manual counting a sample is usually taken over a period of typically less than a day and then the results are extrapolated for longer periods such as a season or year.
Video-Based Traffic Monitoring
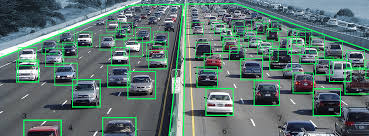
Image from Trafficvision.com
The most common method used to analyse and monitor vehicle traffic in the world is video-based, using cameras to capture images on roads which are then processed by a computer. There are different types of ways by which traffic can be monitored using video, and their differences are all in the means with which the images are processed and interpreted computation. Besides the obvious cost of the camera involved and the time taken in analysing the traffic in real-time; these are the major factors that make video-based traffic monitoring difficult:
i. Large Perspective Deformation: Because of the relatively low position of cameras employed (as compared with helicopters and satellites), objects which are closer to the camera appear to be larger and even faster compared to objects situated further away.
ii. Shadows: The Shadows associated with vehicles can often make it difficult for the tracking process, this is because sometimes it can be hard for the camera to tell between the movements due to a vehicle and those movements due to the shadow of a vehicle. This can lead to incorrect counts.
iii. Diverse Motion: If the camera is monitoring videos at an intersection, fork or any kind of roadway that is not entirely unidirectional like a highway, it becomes more tedious as vehicles may stop in a variety of positions and make a variety of turns.
Wireless and Bluetooth Traffic Detection via ZigBee
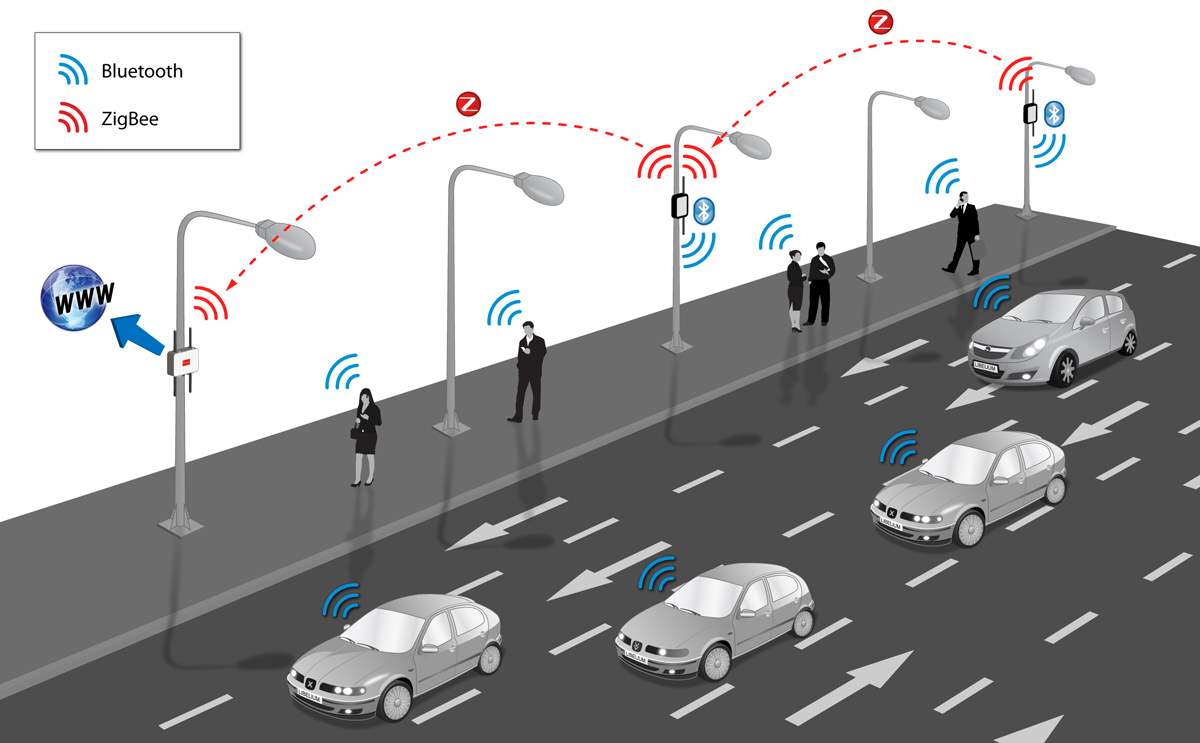
This involves using a Zigbee module to detect traffic via WiFi and Bluetooth. The Zigbee module deters users (pedestrian and cars) of smartphones, laptops, or car-kit devices without them needing to do anything to be detected. The Wi-fi and Bluetooth radios integrated in the above mentioned devices periodically send a signal to the Zigbee indicating their presence. This does not require the devices to be connected to an Access Point but requires the devices to have their Bluetooth/Wifi capacities turned on. Information received by the Zigbee contains:
i. The MAC address of the wireless interface, allowing unique identification
ii. The strength of the signal (RSSI), which gives an average distance of the device from the scanning point.
iii. The vendor of the device e.g. Nokia, Samsung, etc. iv.The WAP or wireless access point where the user is connected (if any), and the Bluetooth friendly name. v.The Class of Device (CoD) in the case of Bluetooth which allows the Zigbe to differentiate the type of device (smartphone, hands-free, laptop, LAN/Network AP)
Pneumatic Roadtube Counting
This vehicle sensing method involves laying down rubber hoses stretched across roads. There may be one or more of these stretched hoses and each one of them is connected to a data-logger at its end. When the tires of a vehicle cross a tube, air in the tubes is squashed and air pressure at the tube ends activates the data logger which then records the time of the event.
Two detect direction of traffic a pair of these rubber hoses are placed along the road, and the data log of which tube is crossed first will result in knowledge of the direction. As these hoses can be stretched across multiple lanes, in the instance where multiple hoses cross the tubes, the ability to accurately determine direction of the vehicle crossing drops.
Installation of these tubes requires working within the traffic lane, and information from the data loggers needs to be physically downloaded to a computer for evaluation. Accuracy of this method is claimed to be 99% by vendors [reference]. This method is best suited for shorter roads with less volumes of traffic as they are not as effective on larger volume, multi-lane highways.
Piezoelectric sensors
Piezoelectric sensing as applied to vehicle traffic monitoring works similar to Pneumatic roadtube method. Piezoelectric sensors are laid across the road in strips and convert mechanical energy of a vehicle crossing the strip to electrical energy, making a log. In this case, the compression the strip undergoes due to the weight of the car causes a build up of voltage which is then reversed once the vehicle moves off the strip. This change in voltage is what allows detection of vehicle crossings.
The piezoelectric strips are laid unto the road by grooves cut in the road’s surface. A device is enclosed and mounted by the side of the road to count the data. This can then be transferred locally via ethernet or RS232 connection to a laptop or maybe transferred via modem.
Doppler and Radar Microwave Sensors
In the Doppler Radar method, an electromagnetic wave of low energy and a known frequency is continuously emitted from the radar into a target area, and the reflections are analysed to gain information. The radars are usually situated along the road side such that the incident radio waves encounter oncoming vehicles. It works based on the change in frequency of reflected waves which happens when the microwave source and vehicle are in motion relative to one another. Radars possess the capacity to determine the distance and speed of objects, by
Software Application
Software Application as a traffic monitoring method labours on the use of mobile applications by road users to report road incidents and the general state of traffic. Some software applications utilize algorithms that estimate the number of road users using the Google API/by matching the number of users who have the application to their geographical location at the time as well as some other more complicated things.
The majority of these methods struggle to find application because of the monetary cost of implementing them, while others downright are not viable because the socio-environmental circumstances do not permit.
Theory
Radar
RADAR, an acronym for “Radio Detection and Ranging” is an object detection technique utilising electromagnetic radiation in the Radio waves frequency range to determine the range, angle, or velocity of objects. While this acronym was put together by the US Navy in 1940, radar was developed secretly for military use by a multitude of nations before and during the period of World War II. A typical radar system is made up of a transmitter, receiver, and a processor which determines the properties of the objects being detected. The general principle of operation is that the radio waves are emitted from the transmitter from whence they travel through space and scatter upon collision with objects. The returned scatterings or reflections are re-introduced into the radar system by means of the receiver and are then processed to make sense of the information. In range determination applications, the time delay between the transmission of a signal from the radar and reception off a reflection gives an indication of an objects distance.
There are many very different applications of radar at the present time including internal-body imaging, astronomical visualization, weather prediction, air-defence, amongst many others.
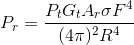
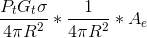
The Radar equation is explained below:
Radar Equation

Where
Pt Is the transmitted power
Gt is the gain of the transmitting antenna
Ar is the effective aperture (area) of the receiving antenna
σ is the radar cross section of the target object also known as scattering coefficient
F is the pattern propagation factor
R is the distance between the target and radar antenna, if transmitter and receiver are at different distances from the object this is split into Rt and Rr with each one squared.

Once the propagating radio wave is reflected upon encountering a physical body, the power density changes. A term called radar cross section is introduced and it represents the visibility of the object to radar, it is influenced my various factors which include the size of the object, the material it is made from, it’s angle of orientation to the wave a few other parameters.
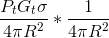
Once the scattering or reflection off the target propagates back to the radar, it’s power density is reduced by a spread factor of
14πR2.
Once the reflected radio wave returns to the receiver, the power received is affected by the effective aperture/area of the receiving antenna.
Radar Cross Section [RCS]
The radar cross section of an object is the measure of its ability to be reflect radar signals in the direction of the target radar reception. In more technical terms the radar cross section is the ratio of the backscatter power per unit solid angle (steradians)to the power density of the signal encountered by the object.
Radar cross section can easily be viewed as the comparison of the strength of a reflected signal off an object to the strength of a reflected signal scattered off a perfectly smooth sphere. The concept of radar cross section accepts that not all the power density of a signal will be intercepted by the target object.
Three key factors which define the radar cross section of an object and a give a better picture of the RCS concept are namely:
Reflectivity: The reflectivity of the object is the measure of how much of the intercepted power density of the signal is reflected back into space by the object.
Projected cross section: The projected cross section of an object is it’s 2-dimentional area of intersection with the incident radio wave signal due to its orientation at that time.
Directivity: The directivity means the same as it would mean for an antenna, and is thus the ratio of power scattered back from the target object in the direction of the radar to the power density of the reflection if the backscattering had happened in an isotropic manner (in all directions).
Some typical Radar Cross sections:
Jumbo jet (100), Truck (200), car (100), bicycle (2), person (1), bird (0.01). [Reference Radar coursenote]
Noise, Clutter, and Detection
Doppler Radar
The “Doppler Effect” is a peculiar phenomenon observed where a frequency shift results from the motion of a body, causing changes in the number of wavelengths between the reflector and the radar’s receiver. This change in wavelength can improve or reduce the radar performance depending on its effect on the detection process. However, this Doppler Effect can be calculated and forms the basis by which the speed of a moving object interacting with a radio wave can be calculated.
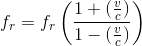
To explain the reason for the frequency shift, let us consider a hypothetical radar transmitting a sine wave at a known fixed frequency f cycles per second, whose wavelength lambda is the distance between each cycle period and is inversely proportional to the frequency such that, lambda= v/f.
Each oscillation of the wave is reflected off a stationary target of interest and returns to the stationary radar as an identical mirrored oscillation. However, if the radar, or object were to be moving away from the radar, each oscillation would take a longer period to complete its roundtrip, from radar to target and back to radar, resulting in larger distances between each cycle and thus a larger wavelength. Logically it follows that the “cycles per second” completed by the wave reduce and thus it’s frequency is reduced. However, if the radar or object were to be moving toward the other, each wave cycle would take shorter roundtrip periods, resulting in increasingly shorter wavelengths, depending on the speed at which the gap between them is being closed. Once again, the inverse proportionality between frequency and wavelength remains evident as in this case the cycles per second completed by the wave increase.
The derivation for the doppler formula follows the same theory as that for the reflection of light by a moving mirror: Because the concept of doppler finds application in relative motion scenarios, there is no change in frequency observed by targets moving perpendicular to the line of sight of the radar. Introducing this angle bias into the formula as cosine angle gives:
Doppler radars are thus very useful being able to determine target speed, and depending on the complexity of the radar, the range and velocity of detected objects.
System Design
Initial Design
At the conception of this project, the initial design decided upon as evident in the Project Proposal report was to use ZigBee through wireless internet and Bluetooth Waspmote sensors to identify the presence of motorists on the road. The system would comprise of Waspmote sensors strategically placed at streetlight poles at regular intervals in a non-intrusive way. Each sensor would identify smartphones or vehicle presence by detecting WiFi and Bluetooth frames without the need of these devices being connected to an Access Point. The capacity of these sensors to detect the ‘class of device’ and estimate distance from the sensor using “Strength of Signal (RSSI)” improves the robustness of this method. The information would be sent to a database, and be used to determine the traffic on the road using vehicle inflow and outflow and the position of vehicles as determined by the sensors.
The implementation of this initial design however was not as optimistic. The implications would mean that only road users with active Bluetooth or WiFi enabled devices would be visible to the system. In developing cities like Lagos, while many cars may have enabled Bluetooth and WiFi capacities, a far larger number do not. The intermittent power supply in some of these cities also means that the battery life would be precious more precious and so individuals were less likely to keep their WiFi and Bluetooth on over journeys.
Few ideas were put forward to try aligning with the government’s vision of introducing wireless hotpots around the city and incentivize users to improve the likelihood of road user detection. After much consideration and polling of opinions, it was decided that hinging the performance on such premises was unfavourable, and that using a technology that wasn’t dependent on human factors for performance would be much better.
Final System Design
This Radar-based traffic monitoring system idea was conceptually realized with a goal of creating small radar devices with the capacity of calculating the speed of incoming vehicles and transferring the information over a non-internet [GSM] medium to a central database periodically. Calculating the speed of incoming vehicles would be done by the battery powered circuitry which incorporates a doppler sensor/radar module with a filtering and amplification circuit. The circuitry provides an output signal [IF or intermittent frequency] containing the frequency difference of the vehicle, this is in turn fed into a microcontroller whose digital signal processing capabilities are used to extract the frequency and do the necessary calculations for estimating the speed of the vehicle in its line of sight.
Transfer of speed data over GSM medium to the database is done because of the poor feasibility of using internet in these places, and is carried out by the microcontroller. The microcontroller is equipped with a GSM shield, and written code enables it to transfer the speed data as SMS messages to the database, where the data is logged periodically and made useful.
Doppler Sensor/Radar Module
[Schematic diagram of sensor]
The doppler sensor contains in it; four patch antennas which act as both transceivers [transmitters and receivers] operating in the X-band microwave. It houses a dielectric resonator oscillator as well and a balanced mixer for stable operation over a wide temperature range.
The sensors have 3 (4?) distinct terminals; + 5V DC input, Ground, and the IF. The IF outputs the result of the mixer which is the difference between the reflected and transmitted signal.
Circuitry
Active Bandpass Filter / Amplification Circuit
[Schematic diagram of both circuits, put together?]
The circuitry linking the Doppler sensor and microcontroller which performs the digital signal processing of the information sensed is majorly an amplification circuit. The IF output is usually in the order of hundreds of millivolts and amplification is needed to raise this above noise to a few volts so that it can be detected by the microcontroller. To ensure accurate information, a clean signal is required and this is why there are two filter stages in the amplification circuit. One to filter low frequency noise before the signal gets amplified, and the other to prevent high frequency noise after amplification.
Virtual Ground
To help the circuit cope with the need for a dual-voltage supply requirements of the amplifiers and keep battery requirements low, a virtual ground circuit was made.
Microcontroller
The microcontroller of choice is the Arduino Mega 2560 because of the arduino’s GSM compatibility and because the Mega possesses the required Analog-to-Digital converter bit channel length.
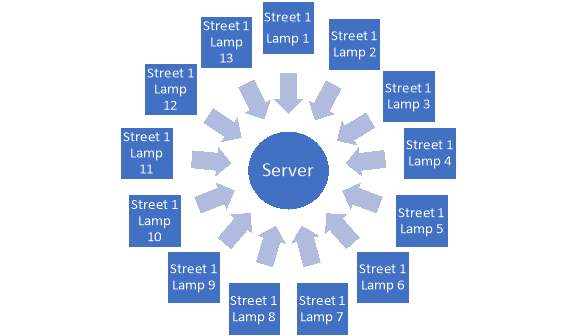
To receive and analyse the data from each of the lamps we will require a server. This server will need to be a database engine. The objective of this server is to receive the raw data from each of the road lamps, develop a database of average speeds on each street and display a map of the city showing traffic updates for each of the roads in real time. This information may be used by road users, traffic light systems, analysts and government bodies to decongest popular routes, estimate my travel times and identify which roads/routes should be expanded for easier commute.
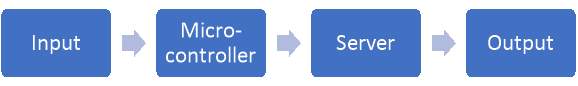
The system in practice however requires a network of programs each designed to receive an input parameter, carry out a set of functions and relay that information onwards. From the radar module to the output, the system uses programs developed in c++, Microsoft SQL Server, excel and ArcGis programming. Below is an outline of how the system is connected.
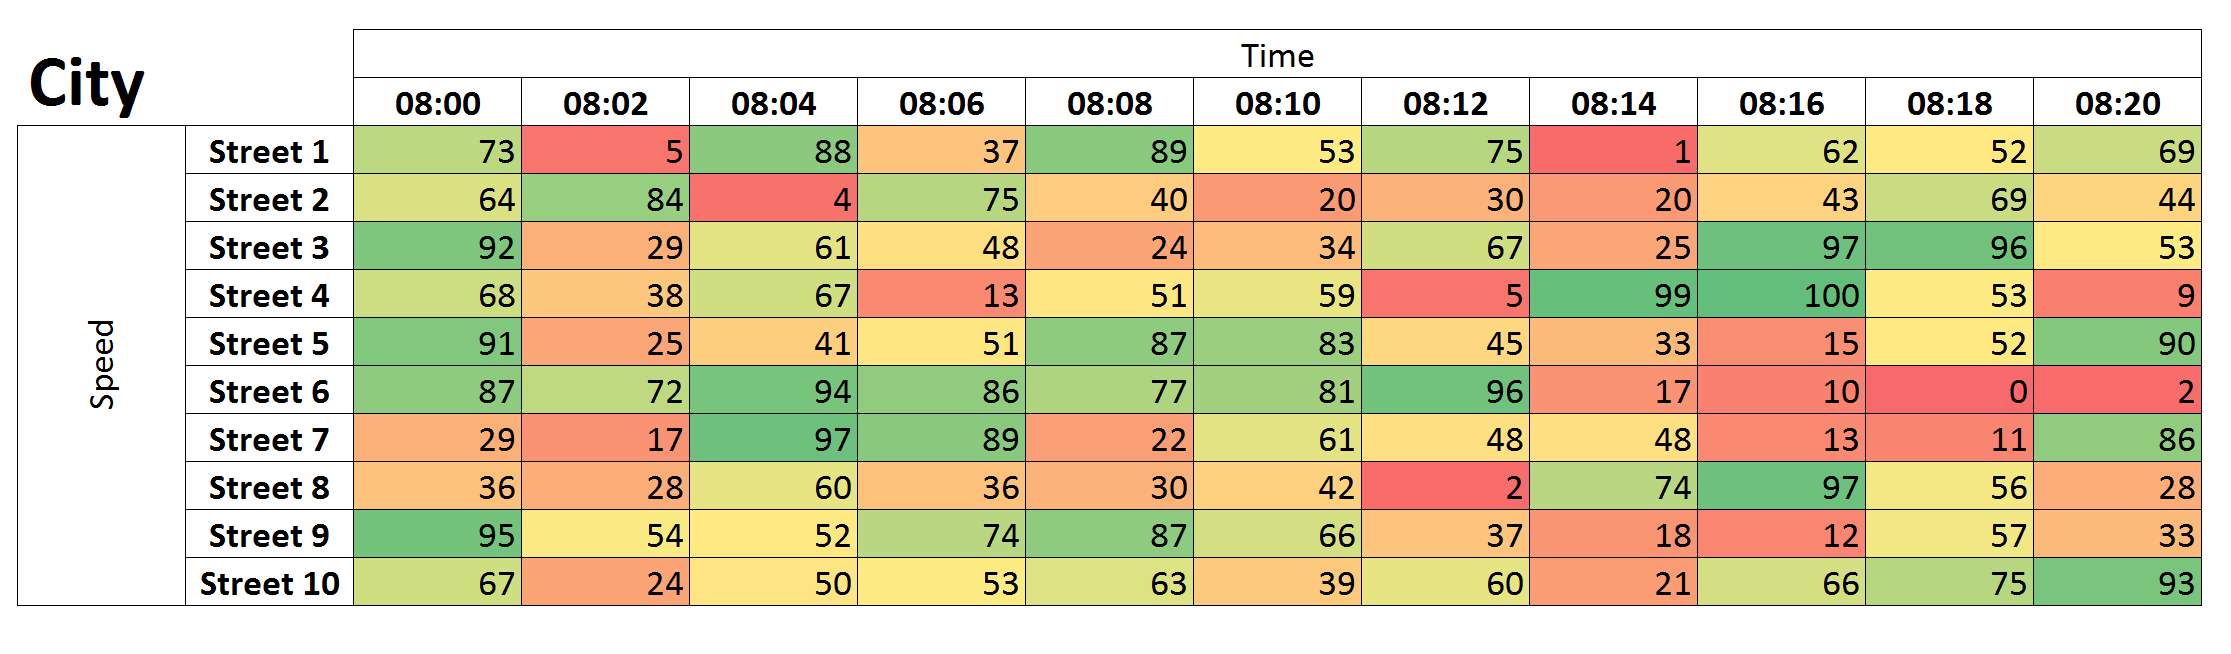
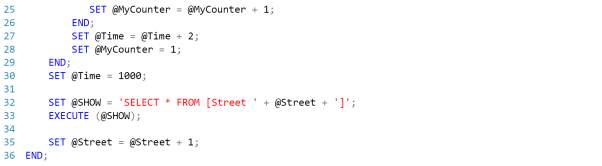
The functions behind this programming languages receive the SMS messages sent by the lamps through the use of a GSM modem. A program then extracts the speed, time and lamp position and stores this in a Street table. This street table contains the speeds of each lamp in order of their positions along the road. Once all of the speeds have been received for each street, a program is created to find the average of each street and store this value in the Lagos city table. The table is then exported to excel to be used for several output channels. This table contains the information for the city’s traffic for each point during the day. One of the output channels is ArcGis, a map generating software that can be used for road users in future developments. The table output is designed to look like this.
Hardware Implementation
Detection/Sensing
Two types of radar modules/doppler sensors were chosen. The MCU 1100 and the HB100 doppler sensor. The sensors have a 40mA typical current drain and require a 5V supply to power them up.
Radar Operational Mode
Due to the fact that multiple modes of operation exist, thought had to be given to each mode applicable to decide the best modal operation for this application. In this case, “best” or most suitable mode operation would be that which offered the most favourable combination of complexity, accuracy, and price.
Pulse Mode Vs Continuous Wave Mode of Operation
The default operation mode of the doppler sensor modules is the continuous wave mode. In this mode the sensor continually emits the 10.525GHz microwave from its antennas and likewise it is continually receiving reflections. Of course the surrounding environment and clutter which do not move return reflections which do not move and thus produce no detectable doppler frequency. The downside to this is that an empty road would produce as much indication as a road filled with completely immobile cars, which is an easy outcome in the unpredictable “traffic jams.
In a Pulse Mode operation, the doppler sensor is made to send out pulses all separated by a short time period. The time between a transmitted pulse and a recorded reflection is used to determine the distance of an object from the radar.
Target Range = C T/2
In order to set up the sensors in Pulse-doppler operation mode, a pulse generator is needed to supply the power for the sensor. This extra component increases the complexity of the circuit but it comes with a benefit.
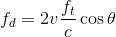
Problem of Negative Frequency
The heterodyning mixer in the circuit works such that it subtracts the transmitted [10.525GHz] signal from the received frequency [10.525Ghz + x] depending on how fast the object approaches the radar. However a receding object will space out the frequency; reduce it, and thus the problem arises, as to whether the radar will provide an absolute or negative reading.
Signal Conditioning
Amplification
The ratio of resistors R1 and R2 to give the desired gain of 100A/A abides by the non-inverting amplifier formula:

R1 and R2 are calculated to be 46kΩand 22kΩ .
Filtering
The filtering of the Intermittent frequency is in two stages as mentioned previously, with one being a low pass and the other a high pass filter.
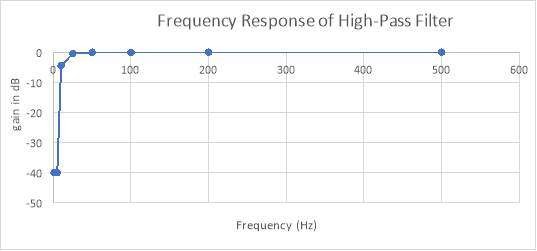
High Pass Filter:

In order to attenuate frequencies below 58Hz, the component values come down to 27000Ω and 0.1microFarads.
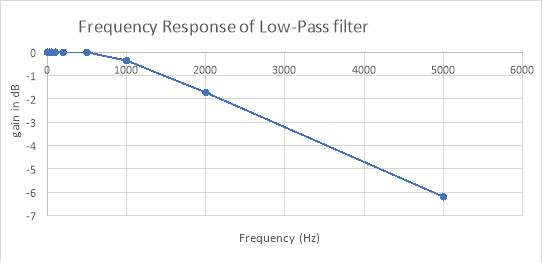
Low Pass Filter:
To attenuate frequencies below 2500Hz, the required component values are 22nanoFarads for the capacitor and 3000Ω for the resistor.
Battery-Fitting
A 9-Volt battery connected with in the voltage splitter circuit form the DC supply source for the positive and negative 5 volts required by the amplifier. Two 4.5V [5 volt] batteries are required for both the doppler sensor and the Arduino microcontroller.
Digital Signal Processing
The first step in the obtaining information from the Intermittent Frequency signal was hooking up the wire form the output of the amplifier into the Arduino. The intermittent frequency is connected to an Arduino pin with an ADC channel, and the “analogRead” function is used by the Arduino to read the signal and digitize it.
The Microcontroller is then used to compute a fourier transform algorithm known as an FFT on the signal to select the speed.
Software Implementation
Insert diagram of cod relation
Introduction
This section of the report documents the coding behind the traffic monitoring system. The input is the signal received off a vehicle passing the radar module, this is then passed into the micro-controller to determine the speed. Periodically the microcontroller will send the information of speed accompanied with the specific location to the server via GSM, every speed of each will lamp will be stored in a table in Microsoft SQL Server. The SQL server then finds the average speed of each street for a given time and compiles this into a city table to be sent to Excel. This section of the system displays the table in a User friendly-format where other types of outputs such as maps in ArcGis can be used from. Each part of this system will be elaborated showing the thought process behind the programming. Sections of the program are included the report accompanied with paragraphs explaining each line.
Input
We begin with the input signal. The input signal is the difference between the transmitted signal and the received signal sent from the radar module. This intermittent frequency (IF) signal contains the information of what speed the vehicle is moving (due to the Doppler effect). However, in practice this frequency is among noise and other surfaces (in this case roads, people etc). To retrieve this signal, the code uses the Fast Fourier Transform to show which frequencies are present in the signal.
Micro-Controller
The micro-controller will be situated on each lamp. Its primary function is to calculate and send the speed to the server via GSM.
To send the accurate speed to the server, the micro-controller will store the highest speed within two minute intervals and send this value to the server. This program will be developed in C++ on the Arduino Mega2650. The stages of this program are: –
Calculate Speed
To calculate the speed, the first step is to read the output signal from the radar module on the Analog pin. Then map these values (which range from 0-1023) to the voltage range. Once we have this analogue signal, we will convert this to a digital signal, so the frequency of the signal can be determined. Once the speed of the vehicles has been successfully calculated, this information is ready to be sent to the server
GSM module
As mentioned before, GSM is used in this design due to the existing networks currently in place in Lagos. GSM module is used in many communication devices which are based on GSM (Global System for Mobile Communications) technology. It is used to interact with GSM network using a computer. When we send SMS to GSM module by Mobile, then GSM receives that SMS and sends it to Arduino. Now Arduino reads this SMS and extract main command from the received string and stores in a variable. The Arduino GSM Shield allows an Arduino board to connect to the internet, make/receive voice calls and send/receive SMS messages. To interface with the cellular network, the board requires a SIM card provided by a network operator.
There is already an existing code which works with Arduino Mega 2650. The modification we made to this code to send the speed is shown below. The complete program is in the Appendix.
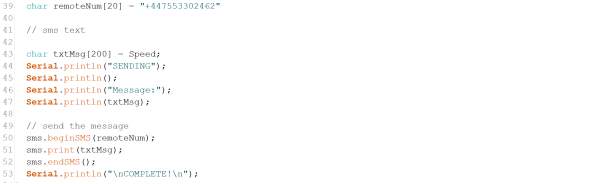
On line 39 we input the phone number of the server in which we send this information to. The text message variable is created to the calculated speed as a text in line 43. Finally in lines 51 -53 we compile all this information to be send from the Arduino to the GSM shield for the server.
Server
Each lamp will have identical programs to calculate and send the speeds of the vehicles in their specific regions to the sever. This is where majority of the program will be involved. The server will operate as database to store all past and present speeds across the city, and a hub for all output channels i.e. maps, traffic light systems, journey time estimators etc. The server receives inputs from each lamp periodically to keep the traffic information as updated as possible.
Microsoft SQL Server is a relational database management system (RDBMS) that operates many functions needed for this Traffic Monitoring System. This program is developed in SQL.
The Setup
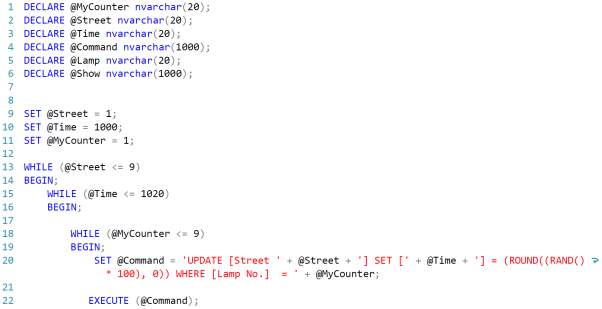
Generate Street table – this database will be made for each street in the city. It will contain each lamp (in order) on the street. This table can be generated for every 20 mins (this can be altered). The table to be generated is shown below for an example period.
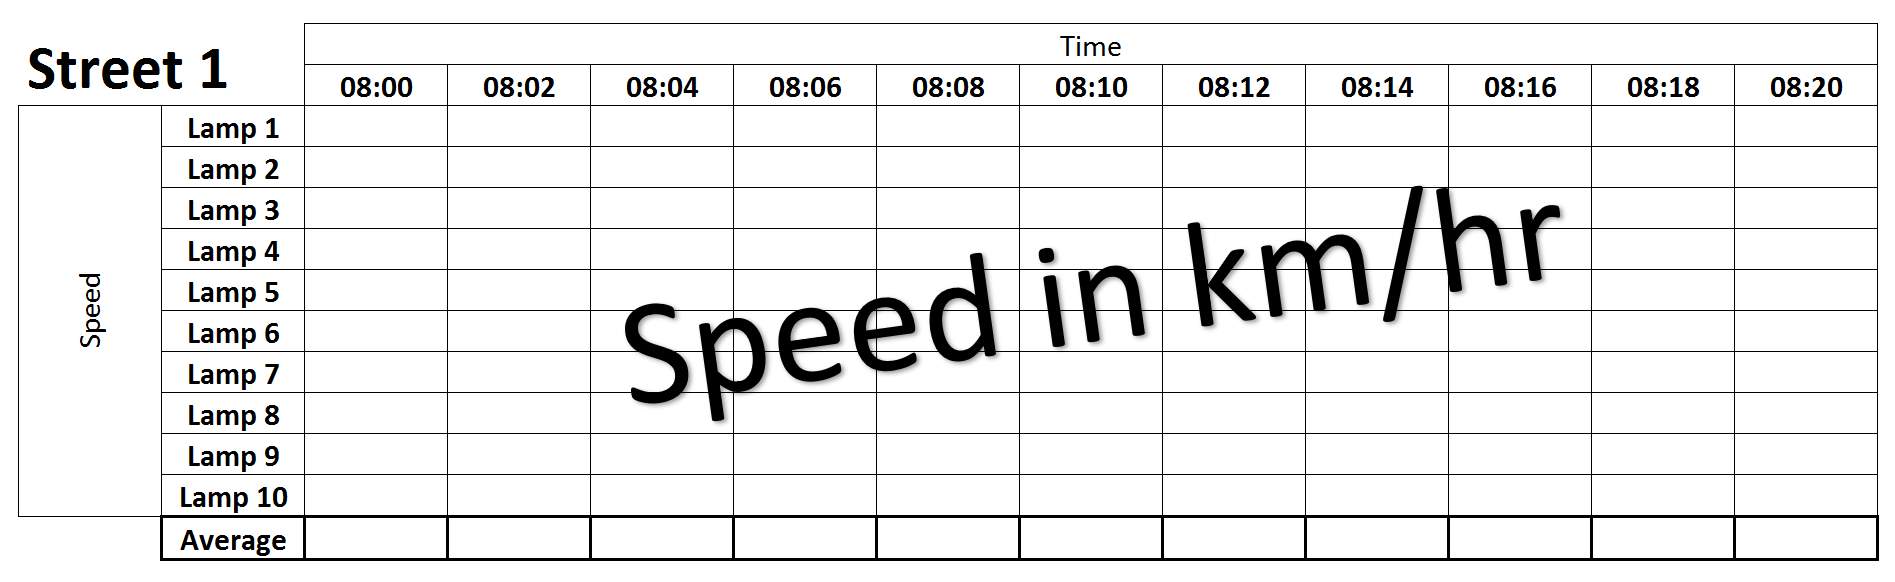
To generate this table for each street the rows will be determined by the number of lamps on the street. We created a Query to develop these tables segmented below.

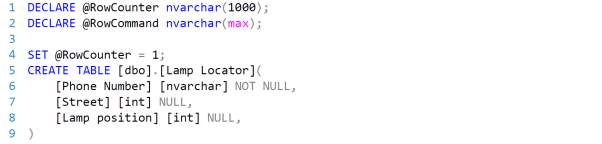
The first segment of this code is often used for creating variables. In Line 1 and 2 , Row counter and Table counter are used for the nested while loops later on. The command variables in Line 3 and 4 are used for the EXECUTE function in MySQL Server. This function is useful when trying to pass a command line that has variables in both text (nvarchar) and number (int, double) format.
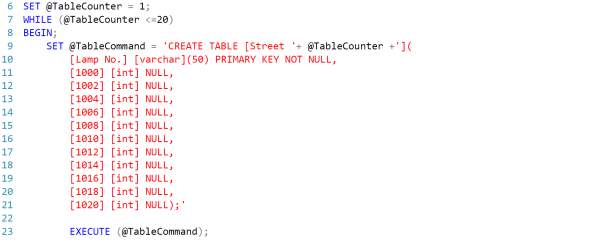
This is the beginning of the first While loop which is used to create 20 Tables called Street 1, Street 2 etc. Each Table/Street is designed with the first column containing the Lamp No. followed by columns of the time (e.g.10:00am, 10:02am). On line 23 is where the TableCommand set on line 9 is executed. This execution sees the code as ‘CREATE TABLE [STREET 1](….’ for the first loop.
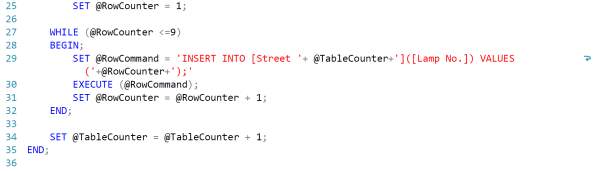
The last segment of the code contains the nested while loop. This while loop is to add rows containing the Lamp No. from 1 – 9. This runs for each row and then exits the while loop. RowCounter is reset to 1, ready for the next Table. TableCounter is incremented to start the process of creating another table. In this case, Street 2.
Phone number directory
A register will need to be created to store and call up on the phone numbers registered to each lamp and the consequent street and lamp location. The directory will store the following parameters as shown in the table below.
Insert phone number directory table
To create this directory, we have made a program segmented below.
When a text has been received by the server, the SMS speed program uses the phone number from the received text to identify which street and lamp number it responds to by calling on this table.
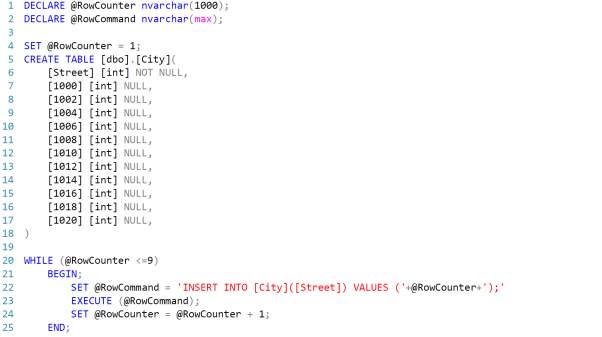
Similarly, for the City Table, columns are created with the time headers for when the speed comes in. The first column in this case is the Street. The names of the street are stored in a separate database and given a specific ID number. This number will be used under the first column. Again, a while loop is used to create rows containing the Street ID number.
Now that the tables have been setup, the next step will be to retrieve the speeds via GSM module. This process required the use of another software and will be covered later. To test that the tables will be populated correctly, we developed a speed generator.
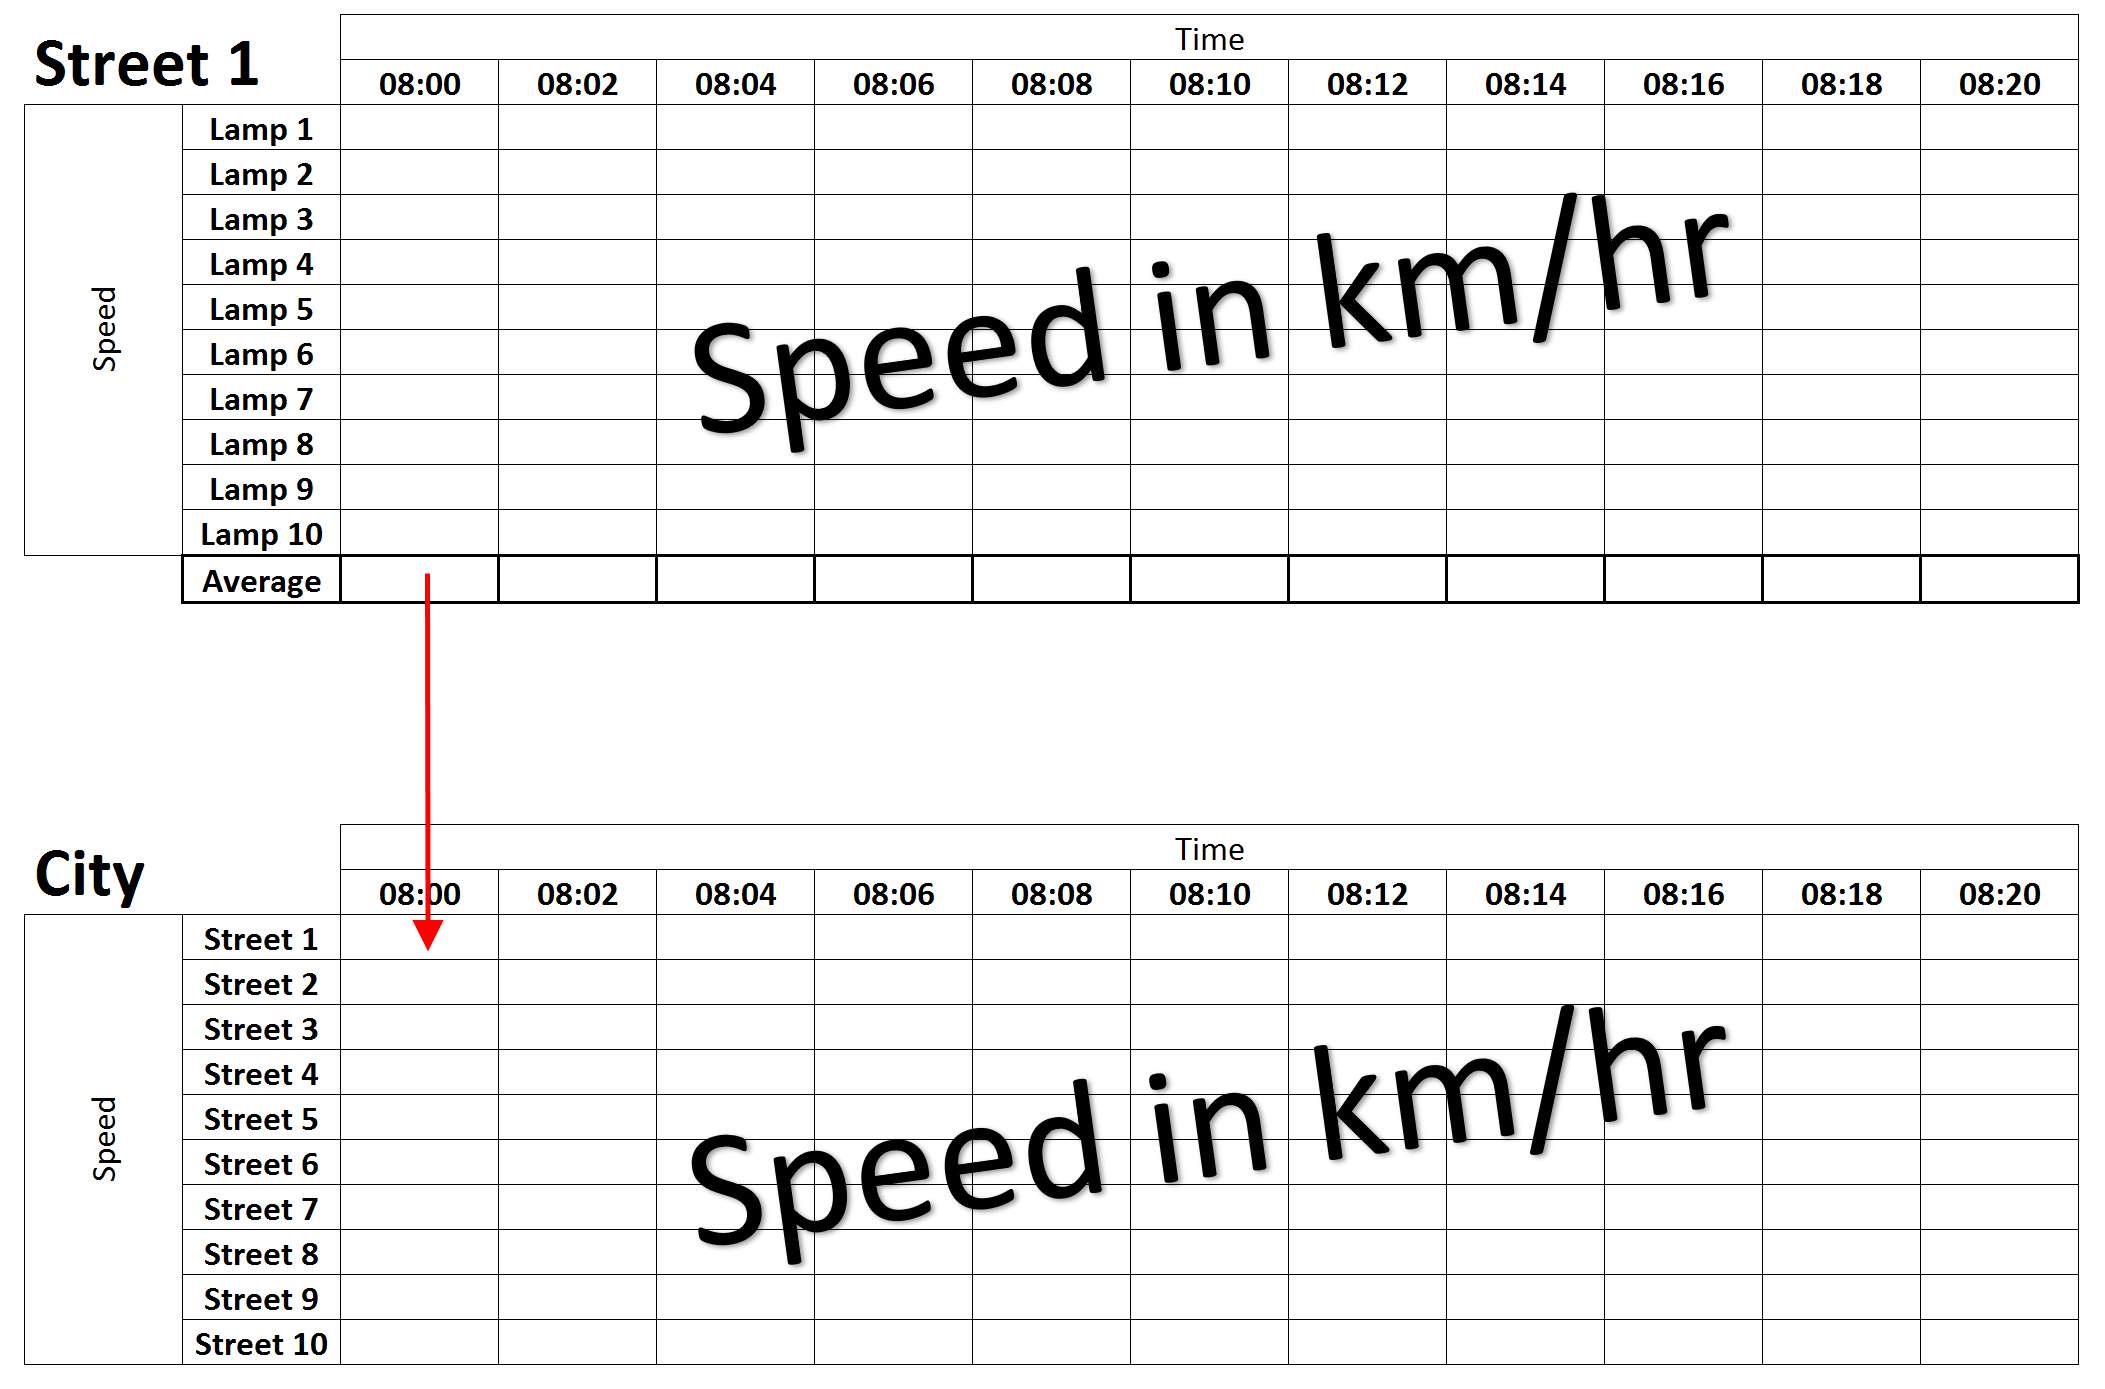
This program was designed to populate speeds for each lamp, at every time, on each street. Therefore, three nested while loops were used. On line 20. Command was set to take three inputs of which street, lamp and time the speed will be entered to. This will be similar to the actual speed input program which retrieves this information via GSM.
The last segment of the code iterates these counters for the next loop. The show function displays each of the tables when the code has finished running. The results and challenges faced when developing these programs is documented later on in the report.
the averages of the speeds will need to be calculated and registered in the city table
The idea was to create another row in the street tables to calculate and store the average speed there, before transferring it to the city table as shown above. However, the common practice in SQL or any database program is to not store the same values more than once. Instead, the average will be calculated and stored directly into the City table, with the program below.
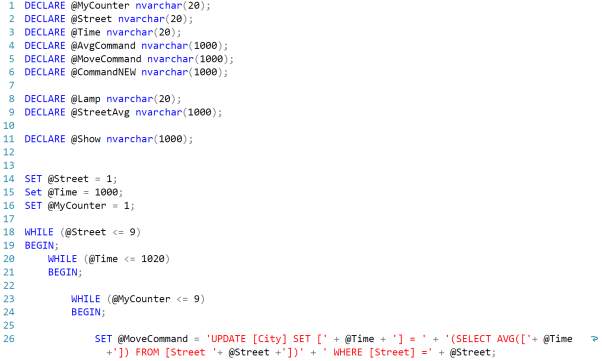
On line 26, the SELECT AVG function is used to obtain the averages of all the lamps on a street at a given time. This function is particularly useful because in the circumstance that there is no speed entry from one of the lamps, the AVG function will ignore this and take the averages of the rest of the speeds. This helps us with one of the edge cases which we will cover later. The UPDATE function is what is used to input this average into the city Table.
The MoveCommand compiles all the variables into one string storing the first iteration for example as:

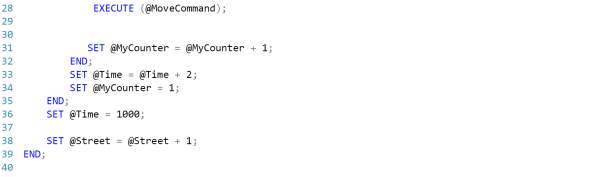
The EXECUTE function then passes the command as thought it was the line beginning with ‘Update [CITY]…’ . This program can be used for both the Speed generator and the SMS speed inputs.
With the conclusion that these programs function correctly we return to work on receiving the speed inputs via GSM. The Server needs to interact with the GSM network, as mentioned before the reason for using the GSM SMS messages is due to the vast network coverage already in place in Lagos relative to other means. However, most servers/computers do not have GSM compatibility. In the case, they do not GSM modems will be used via USB. There are many software on the market that can be used to send and receive messages (or phone calls) directly from the computer. The software chosen is Diafaan SMS Server. The software can directly receive SMS messages via GSM modem or a mobile phone and display the text received. More so, it is compatible with Microsoft SQL Server and can transfer the information to the database. The first step was to setup Diafaan with the GSM details with my mobile phone, after which we connect Diafaan to our Traffic Monitoring System Database.
When we send texts we get a table in the database that looks like this below.
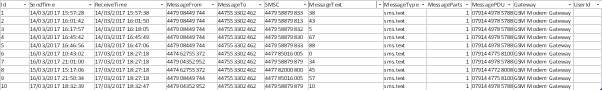
Here we can see a lot of information is recorded for each text received. However we said earlier that we need pieces of information from each Lamp. Namely:-
- The Lamp ID
- The date and time of this entry.
- The Speed crossing the Lamp
Previously we thought the best way to get this information was to send a text from the Arduino containing this information, however we found out that this information can be derived from the table above.
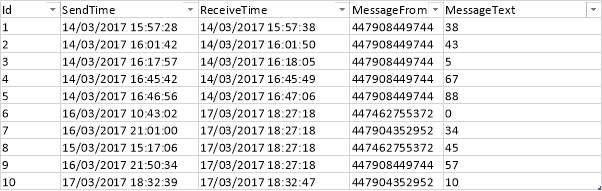
Starting with the Lamp ID, instead of having to create another directory containing numbers allocated to each lamp. We can use the phone number from where the Lamp was sent. We know with GSM these numbers are unique to each SIM and therefore the phone numbers are unique to each lamp.
The date and time of each entry will be taken from SendTime column. Although this will be very similar to ReceiveTime, it adds another layer to the accuracy of the system. We can see that the difference is usually around 10s. In the future, when start to analyse the time it takes for the system to reach the output, we can use this information. The speed will then be the only information sent in the text, making it easier to process and store in the street table.
When we remove all other information on the table we get this. Note, the ID in the first column is for numbering purposes and should not be confused with Lamp ID.
Now that we are receiving information from the lamp in the database, we need to prepare a program that extracts this data and registers it in the right cell.
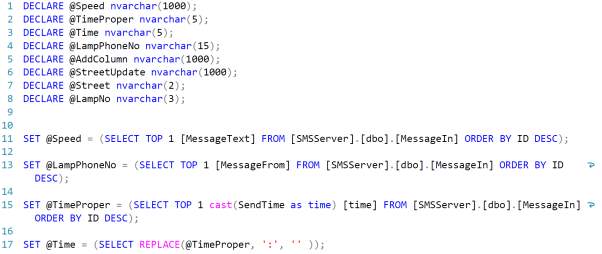
Staring with Line 11. The speed is stored in variable Speed by ordering the table we had previously into descending order of ID and selecting the top value. In other words, this command stores the speed of the last SMS message received. On line 13, LampPhoneNo is used to store the phone number of the last message received, with a similar method to Line 11. On line 15 there is a bit more coding. The format in which time is stored on Street and City Table is ‘HHMM’. This is intentional so that the time can be easily manipulated. With the Diafaan table, the format is ‘DD/MM/YY HH:MM:SS’. To convert this, initially we remove the date, leaving ‘HH:MM:SS’ and then the seconds leaving ‘HH:MM’. This still leaves the ‘:’ in between ‘HH’ and ‘MM’, this is addressed in Line 17.
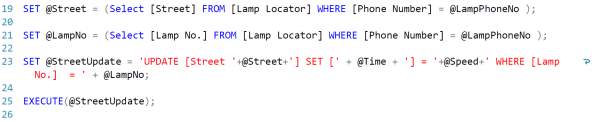
We previously stored the phone number for the Lamp in LampPhoneNo. Using this number we can retrieve from the Lamp Locator directory what Street and Lamp No. this represents. This is carried out in Lines 19 and 21. Line 23 takes all this information of the street, lamp no., time and what speed and stores it as a text to be executed on Line 25.
We have developed the codes to carry out all the functions however we need to run a loop of all these codes together. Microsoft MySql Server has a functionality called Job. With this function we can set the programs to run one after the other and report any information if a certain program should fail. We can also schedule the program to run periodically, during the day.
The System
The job we created has been designed to continuously update the Street and City tables through the use of the SMS speed and Move average program. Finally, the job will export the City table to export.
With the Traffic Monitoring System ready, we can export the results to Microsoft Excel. The City table will be linked to the Excel file, so any changes to the database in the server will be seen directly on Excel. There are however some final edits to be made, this is shown in the edge cases below.
Results & Analysis
Design, development, and testing of radar circuitry went as planned. The radar can detect signals from up to 20feet, depending on size of object.
Population test
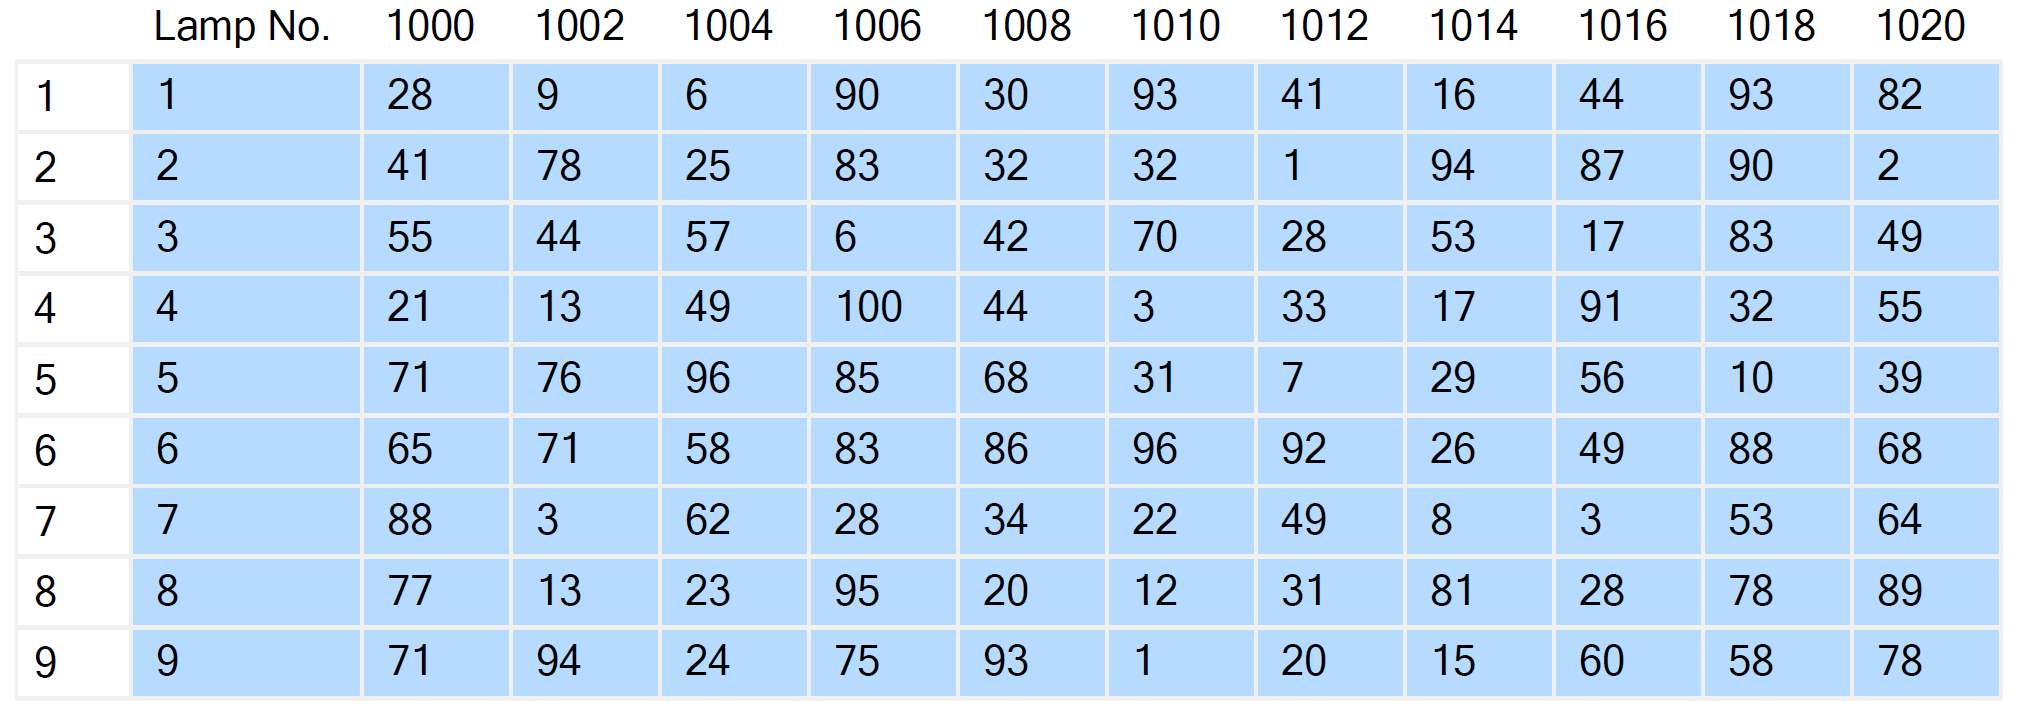
Before we developed the section of the program designed to receive the SMS, we tested the system to see if it will populate the Street and City tables accurately. To do this we developed a speed generator explained previously, the results of this system are shown below. The program generates speed for each Lamp on every street. The table of one of the streets (Street 3) is shown below.
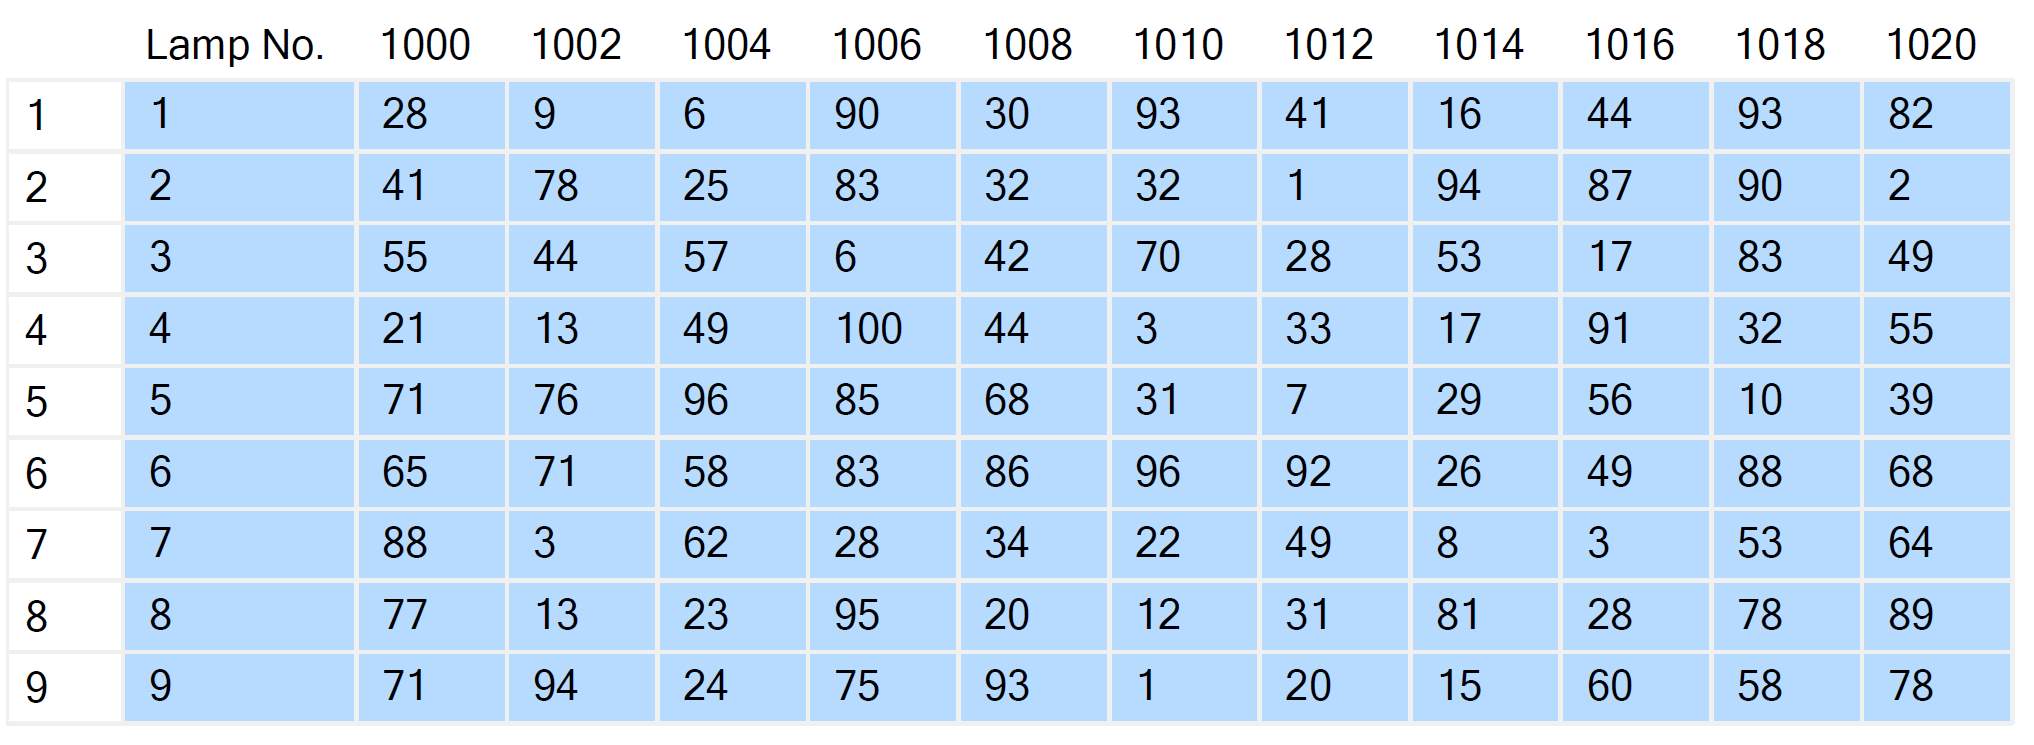
Now that these streets are populated we can check to see if the averages are recorded correct in the city table. If we focus on the speeds at time 10:20am for Street 3, we can see that the average is accurately shown proven this section of the program to be successful.
GSM test
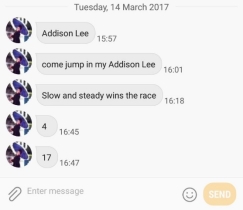
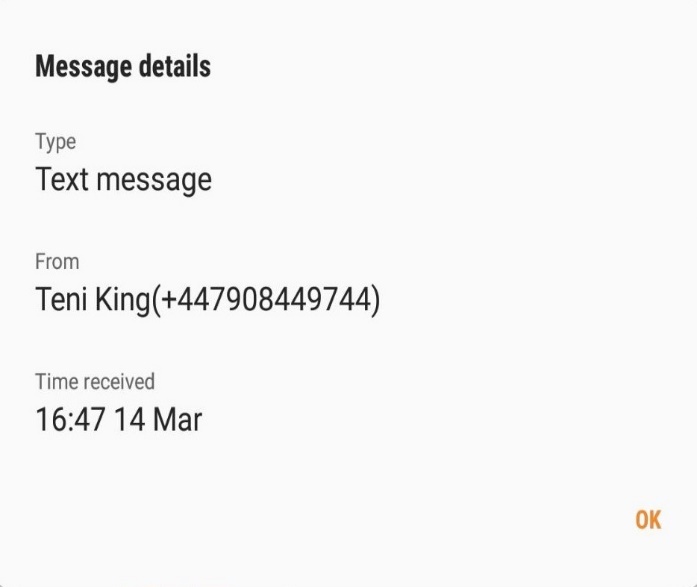
The next section of the code we tested was the GSM receiver program we developed. Through Diafaan Software we were able to use a smartphone as a GSM modem to access the network. After careful configuration, we were able to show the messages received on the smartphone directly into Microsoft SQL server. A screen shot of the SMS details on the smart phone and the stored data on the server are shown below.

Extracting Lamp information
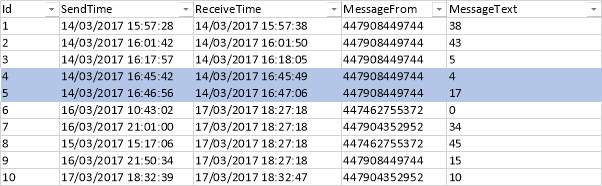
With the SMS messages recorded in the database, the next code we developed was the SMS speed program. In this code as shown before, we extracted the three pieces of information we need from this SMS database. Namely, speed, lamp location and time recorded. Below we see the results when we run our SMS speed program.
Note: The phone numbers +447908449744 and +447904352952 have been allocated to Street 5, Lamp No. 1 and Lamp No. 2 respectively. For convenience, the times received have been changed to 10:20am
Output
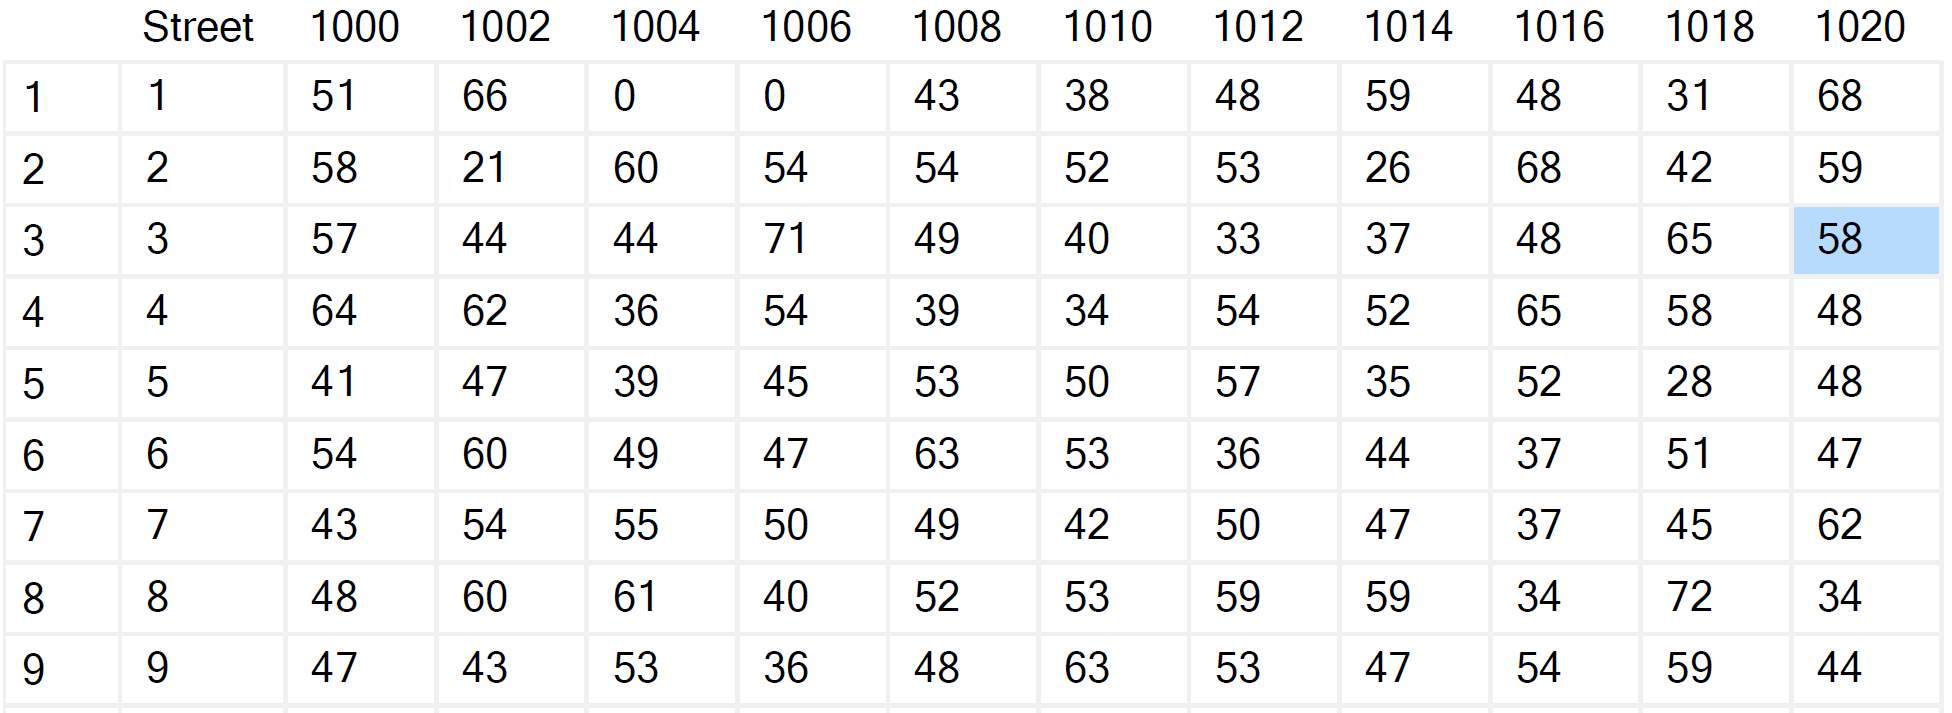
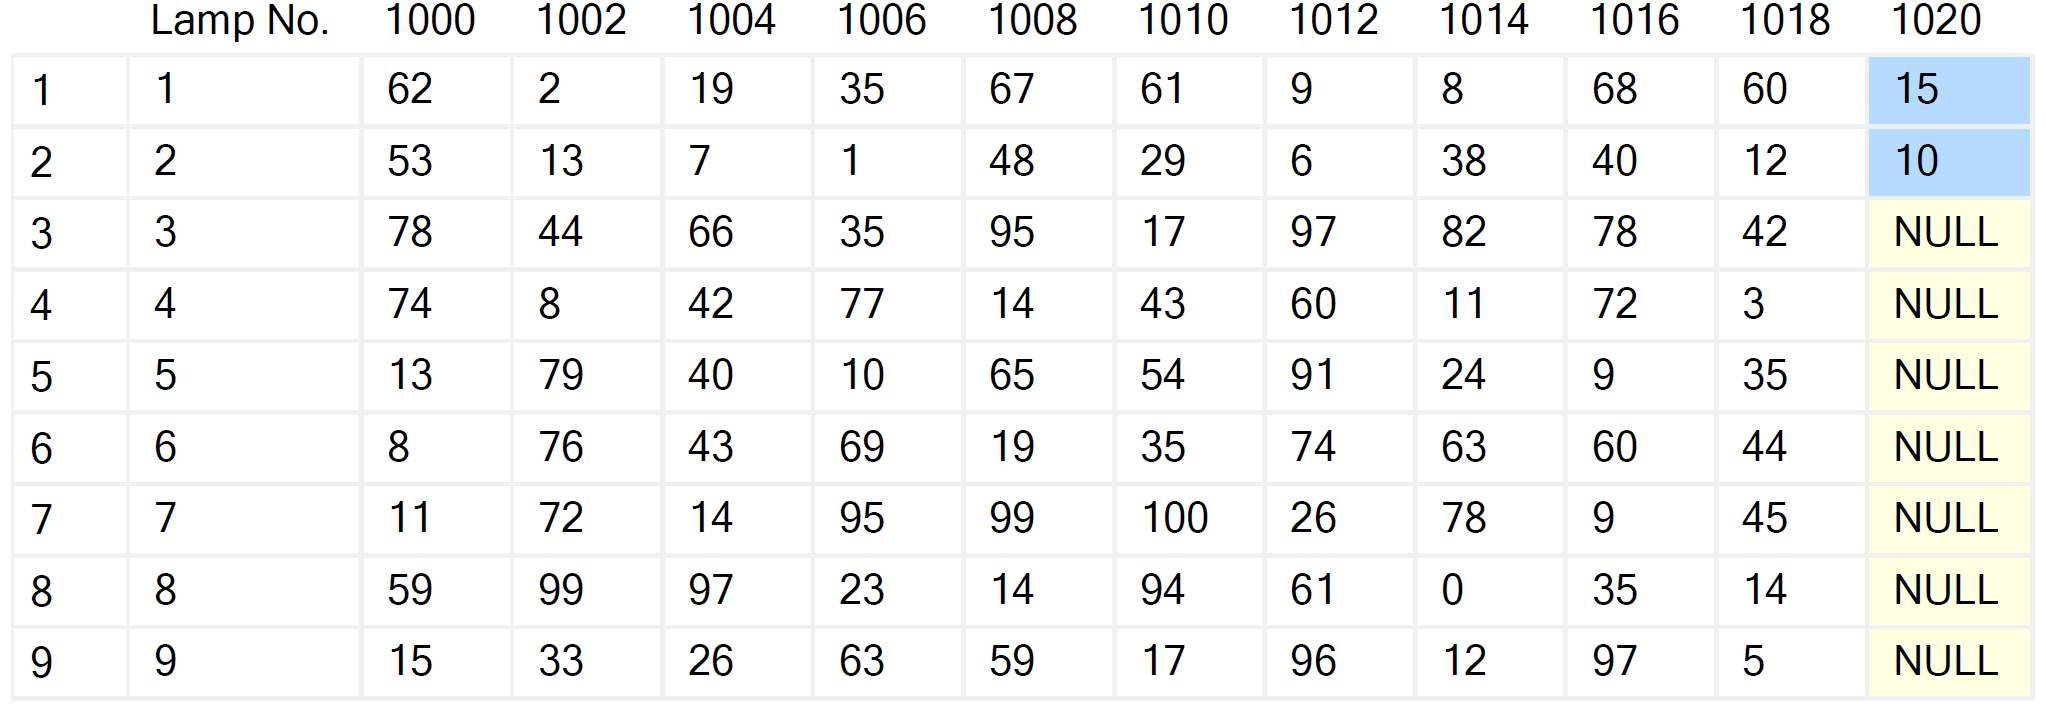
The results of the Traffic Monitoring System can be seen through the output channels. The City table is the core of the outputs from which all maps and analysis will be derived from. We tested this design by making a city with 9 streets interconnected to each other. When we sent the speeds via SMS into the server, we got these results for Street 1.
We can see that the program successfully outputs the speed for each of the streets for every two minute interval. Similarly when we sent the speeds for the other streets these values were also recorded. The averages for each of these streets were then calculated and passed into the city table.
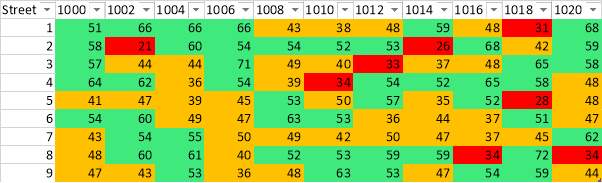
The city table has been coloured coded in excel. This information from this table has been passed into ArcGis to overlay the map of traffic over existing roads in Lagos. A screenshot of this information is shown below.
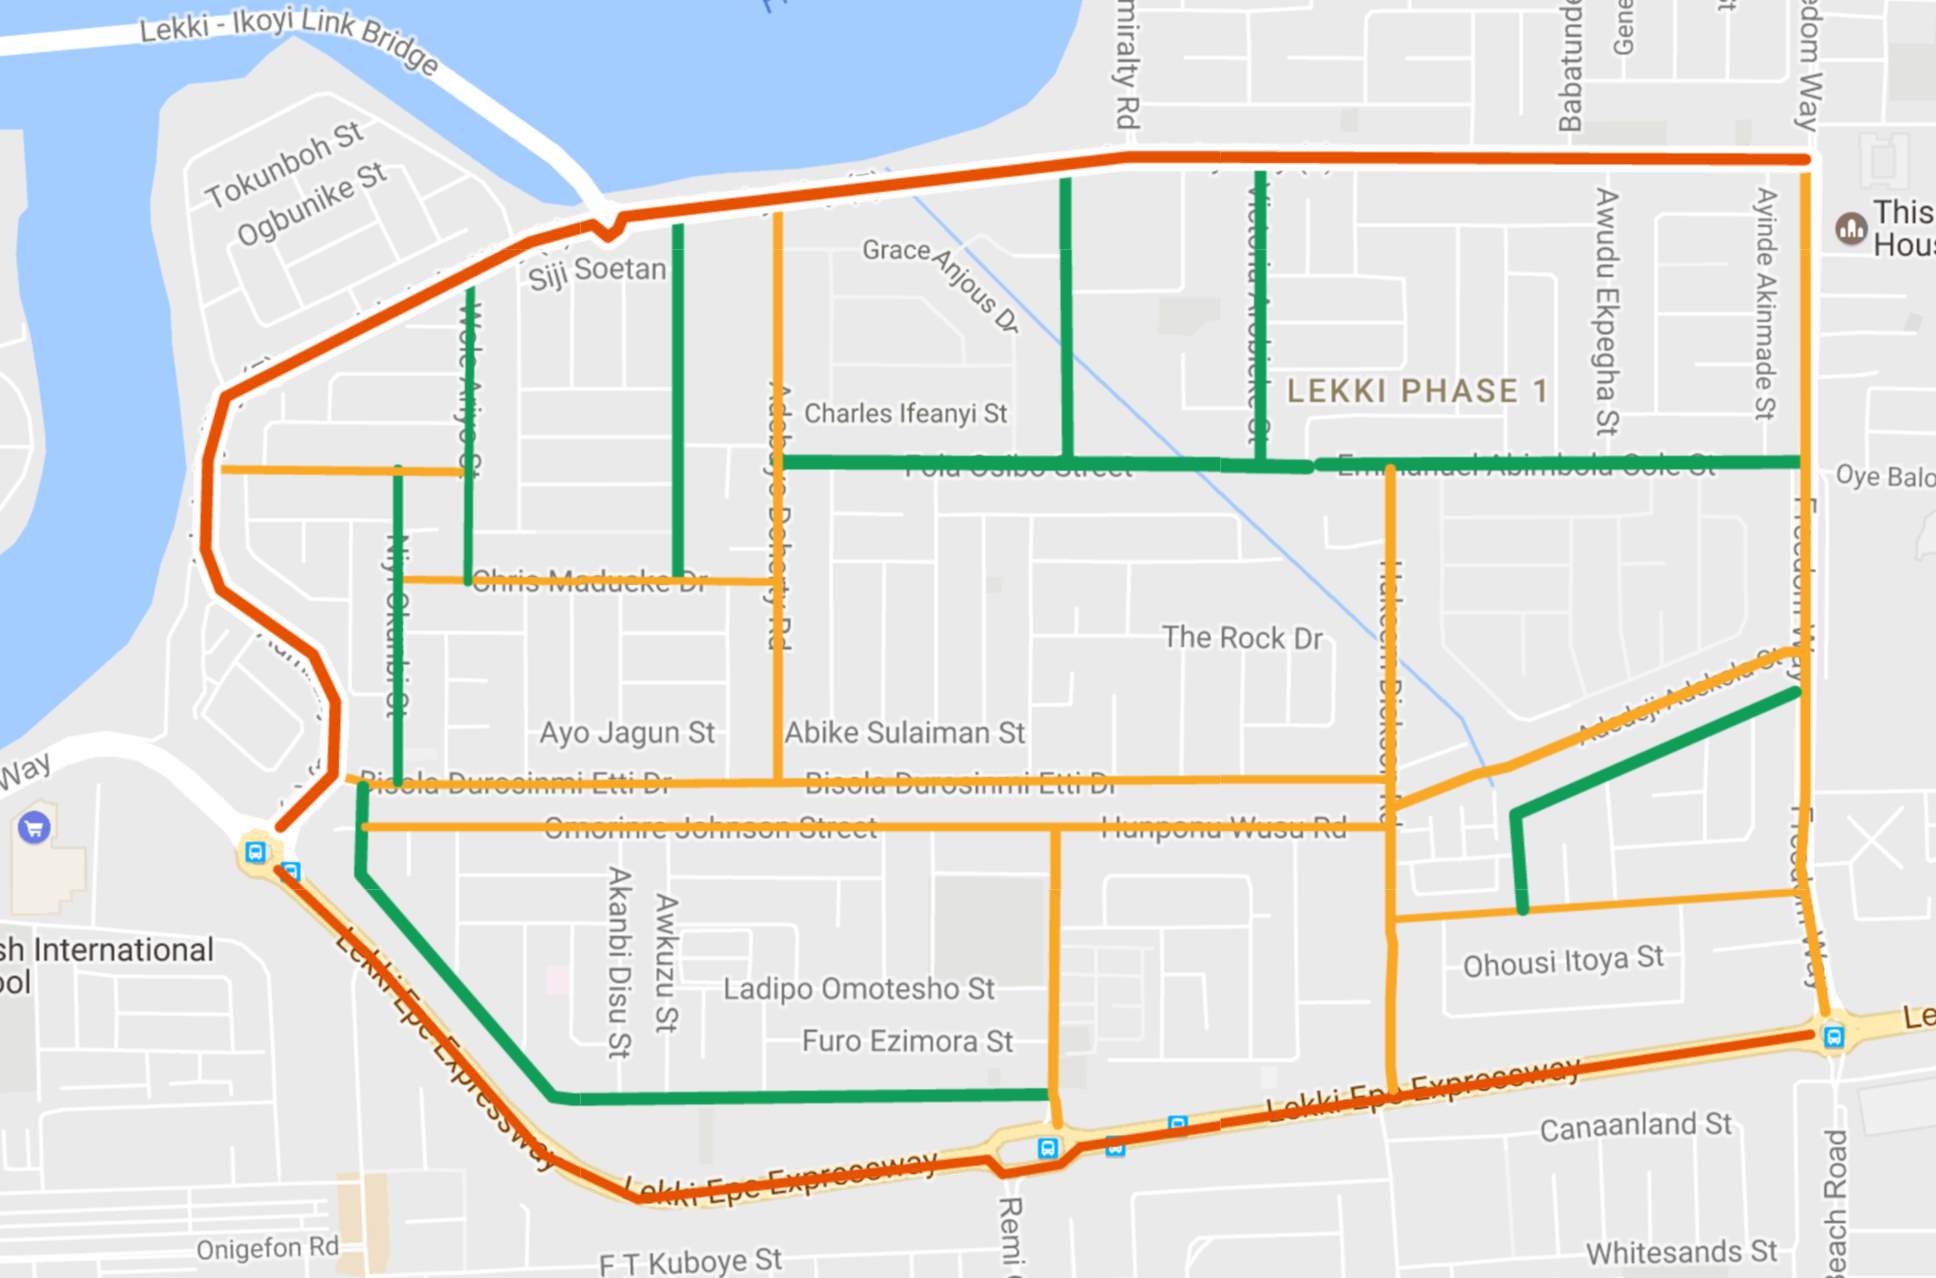
To test the Traffic Monitoring System, we used a part of Lagos commonly known for the traffic
Challenges & Future Development
Edge case
In the design of this Traffic Monitoring System, we brainstormed and discovered many instances in which our design will need to take into consideration. These findings are listed below:
When the speed sent from the Arduino is 0 Km/hr, is there stand still traffic or a free road?
This is a very important issues, as the difference between the two scenarios are essentially polar when it comes to traffic conditions. To solve this we use the values of previous speeds, as there will be no situation where cars passing by will be travelling at 60 Km/hr and a minute later at 0km/hr, we can safely assume that the recorded reading of 0 km/hr is due to the fact no vehicle has passed. This would be true because there will be no difference between the transmitted signal and the received signal. Likewise for other speeds, the question however remains where the cut off speed will be. The speed one minute before a traffic jam is around 10km/hr. Using this information, we set up an if loop in Excel.
Write IF LOOP from excel and explain
Vehicles travelling the other way, will they affect readings? The positioning of the lamps will affect what is in the beam width of the radar. Roads with central dividers between incoming and outgoing traffic will have the radars facing outwards, in this setup, radars will be positioned to face in opposite directions therefore eliminating the possibility for vehicles coming in the opposite direction to be seen. In the case where the lamps are on the side of the road, vehicles travelling in the opposite direction will be within the beam width
Roads with more than one lane? Due to the design of the traffic monitoring system, it would matter how many lanes there are. The traffic is measured base on the speeds of the vehicles passing by. Whether it is a car on the first or second lane, or vehicles are passing by on both lanes, the radar system will pick up many speeds over a fixed period of time and will output the fastest speed it received.
Long Streets will be divided into sub-sections with each section having an ID number that contains the order of the sections in the road. Once the long roads have been broken down into these sections they can be analysed like the other streets.
Traffic lights/Roundabout. Intersections and roundabouts specifically will be more difficult to monitor due to the turning of the vehicles reducing the doppler effect. However, traffic in these regions can still be monitored through the use of the streets connecting to them.
In the event a radar system fails to send the speed to server maybe due to a fault, the program will use the data from the lamps before and after the defected lamp to report the congestion. If the lamp continues to not send in the speed, the server will identify the lamp is a defected system.
Future Development
As pre-empted before, the Traffic Monitoring System and the data collected can be used for much more than monitoring traffic. We discovered earlier that the number one cause for accidents in Nigeria was over-speeding. The results from this monitoring system we will be able to identify on which roads these occur and at what time of the day. Information like this will be very useful for stopping such driving habits.
An interesting design will be for motorways connecting main cities in Lagos. During the earl hours in the morning when motorways are hardly use, to save power, road lamps can be turned off. In the event a vehicle is passing, this will be detected through the radar systems on the road. This information can be used for lamps further along the road to light up before the vehicle reaches the point, thereby lighting the path throughout the journey for the vehicle. This will serve to boost the use of roads during the night and decongest roads at other times.
The Traffic Monitoring System can also be used for a platform of other outputs. The intention was not for the system to not only be used by government bodies and for analysis, but to also be given directly to the road users. This can be through the development of an app which will update users with current road conditions, give estimated times to destinations and suggest routes with best time periods to travel. However, the demographic of the people living in Lagos majority will not possess smart phones. SMS messages can be send out the users who subscribe to the service. A more expensive solution will be to have information boards on the road displaying information derived from this system.
Traffic lights system can be interconnected with these systems to allow traffic flow in a certain direction for longer if there has been a significant accumulation of vehicles at an intersection. This is a common feature of current traffic lights in Lagos. These are a few ways in which the Traffic Monitoring System can be further developed. Cities such as Mumbai, Koikata and Karachi will also benefit from such as system as they have very similar characteristics to Lagos in terms of population density and transport infrastructure.
Conclusion
Road traffic congestion is a global phenomenon that can be seen in cities worldwide. Conscious efforts have been made by developed cities to reduce this congestion by infrastructure expansion, road policies and incentives to use other means of travelling such as cycling. Most Developing countries however have not been able to manage increasing populations and the demand it has on traffic networks.
Therefore, the object of this project was to develop a Traffic Monitoring System that collects the speeds on roads and stores these speeds in a database. To do this we established a radar system which will be fitted on to every lamp, that will be directed at incoming traffic to determine the speed. This information was then relayed via GSM to the server of the system which housed all the speeds of the each lamp on each street in the city. These speeds were accurately registered into the database with the averages of each street stored in a city table periodically.
The Traffic Monitoring System can serve to help in two ways. Firstly, the data stored from this system would equip government bodies to understand the composition of traffic flows, seasonal and other drivers of congestion, all of which can shape policy priorities for road investment and expenditures. Improving coverage and collection of congestion data will be particularly important in improving predictive models. Secondly in can serve to help road users directly. There is a current uncertainty of what you may face when embarking on a journey in Lagos. With our Traffic Monitoring System residents of the city can see current traffic states and will be able to plan journeys accordingly.
Cite This Work
To export a reference to this article please select a referencing stye below:
Related Services
View all


Related Content
All TagsContent relating to: "Transportation"
Transportation refers to the process of goods, people or animals being moved from one place to another. There are multiple methods of transport, including train, boat, bus, plane, lorry, and more.
Related Articles
DMCA / Removal Request
If you are the original writer of this dissertation and no longer wish to have your work published on the UKDiss.com website then please: