Attitude and Perception of Local Residents Towards Tourism Development
Info: 13465 words (54 pages) Dissertation
Published: 25th Aug 2021
Tagged: TourismTravel and Tourism
Sub- focuses questions:
- Does tourism development have a positive impact for local residents’ in Tenby?
- What factors influence the attitude and perception of tourism in Tenby? What is the attitude and perception of tourism in Tenby?

Source: https://maps .google.co.uk
CONTENTS PAGE
Title Page ………………………………………………………………………………..1
Table of content …………………………………………………………………………2
Keywords and Acronyms ………………………………………………………………3
Introduction ………………………………………………………………………………4
Tourism in Tenby ………………………………………………………………………..4
Location …………………………………………………………………………………..5-6
Figure 1a (I)
Figure 1a (ii)
Figure 1b (I)
Figure 1b (ii)
Importance and aim of research…………………………………………………………7
Hypothesis ………………………………………………………………………………….7
Research Methodology …………………………………………………………………….7- 11
Map of data collection sites: Figure 2………………………………………………………11-12
Data Presentation ……………………………………………………………………………12- 20
Figure 2a: Demographics
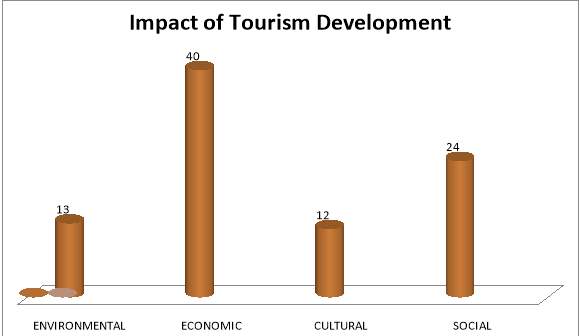
Graph 1: Impact of Tourism
Table 2b (I): impacts of tourism by Gender
Table 2b (ii): impacts of tourism by Age
Table 2b (iii): impacts of tourism by Residency
Table 2b (iv): impacts of tourism by Level of Education
Table 3a (I): Bi-Polar for High-streets
Table 3a (ii): Bi-Polar for Harbour
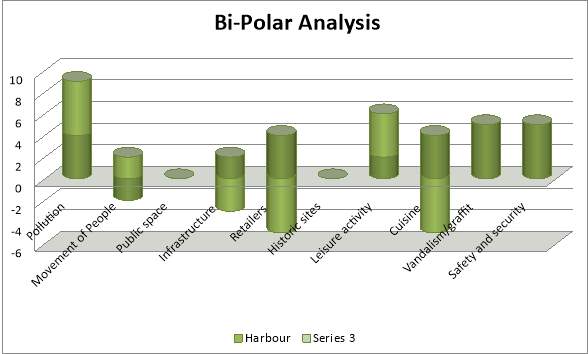
Graph 2: Bi-Polar Analysis
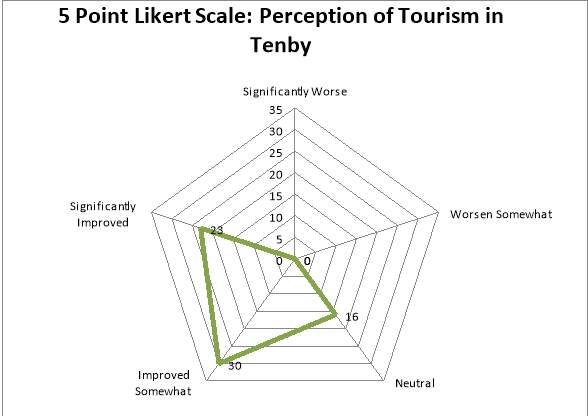
Graph 3: 5-Point Likert Scale
Table 4: Environmental Quality Assessment
Figure 3a(I): Mood Meter
Figure 3a(ii): Comments
Figure 4a (I): Words to describe Tenby
Figure 4a (ii): Words to describe Tourism in Tenby
Analysis ………………………………………………………………………………22-25
Evaluation ……………………………………………………………………………..25-26
Conclusion ……………………………………………………………………………..26
Sources: …………………………………………………………………………………27-31
Website Sources: 1
Environmental Quality Assessment: Source 2
Questionnaire; Source 3
Picture: Source 4
Keywords and Acronyms:
WTO: World Tourism Organization
Tourism planning: A process of involving all relevant and interested parties (local government officials, local citizens, architects, developers, business people, and planners) in such a way that decision-making is shared
DF: Degree of Freedom
Local residents: These are households residing in a particular area having a common interest in benefiting from the use and management of these resources. This term is used interchangeably with local people.
ICZM: Integrated coastal zone management.
Random sampling: Sampling technique whereby each individual is chosen entirely by chance and each member of the population has an equal chance of being included in the sample.
Perception: This is the act or faculty of apprehending by the means of the senses or of the mind, cognitive and understanding of something by the people towards tourism development.
Tourism: This is an industry consisting of tourists, a business and an environment or local community for operations.
Tourism development: Refers to development that meets the needs of the present generations without compromising the ability of future generations to meet their own needs.
Attitude: An established way of thinking or feeling with some degree of approval or disapproval
INTRODUCTION
The World Tourism Organization (WTO) defines tourism as “travelling to and staying in places outside their usual environment for not more than one consecutive year for leisure, business and other purposes”.
Tourism is a rapidly growing industry which has extensive economic, social, cultural and environmental impacts; the industry is worth $919 billion dollars globally, which makes tourism one of the world’s largest most profitable industries[1]. In the UK’s economy, tourism provides nearly one and a half million jobs directly and even more employment indirectly through supply-chain factor such as Farms. In 2007, 32.8 million overseas tourists visited the United Kingdom spending £16 billion[2].
The local resident is a very important factor especially in the long time to promote long-term sustainability in the tourist industry; hence why it’s important to understand the perception and attitude of the local residents. The reasons for this is, in order to minimise the negative social and environmental impact and to maximise the positive impact of tourism development in local communities such as Tenby, where it’s tourist industry generates profit, jobs, tax revenues, and income which helps these communities to achieve both social and economic development.
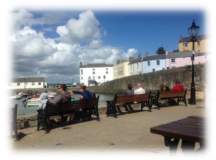
Tourism in Tenby
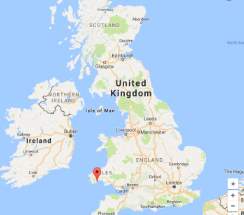
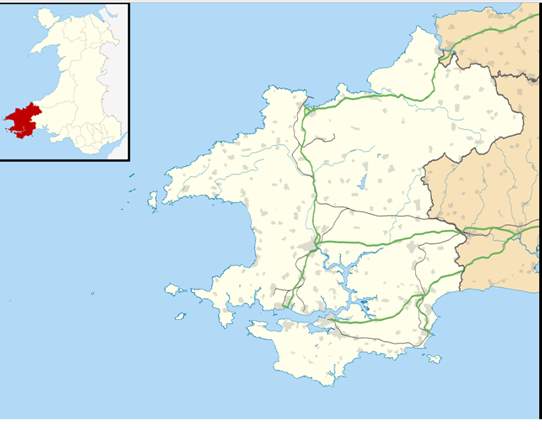
[3][4]Tenby is a picturesque harbour town and seaside resort in Pembrokeshire, South Wales, on the western side of Carmarthen Bay. There are many shops, pubs and restaurants in the town that provide for the seasonal tourism, all linked together by cobblestone streets, along with its north, west and south sandy beaches, as well as coastal boat trips to Caldy Island. Tenby has a total population of 4,696 (2011 census) [5]
Figure 1a (i)


Figure 1a (ii)
South Wales, Pembrokeshire, Tenby.
OS grid reference: SN129007
The tourism industry in Pembrokeshire has experienced a steady growth since 2010, with a recorded 4.3 million staying visitors to the county. This has led to great economic benefit for the area with visitors spending £585 million, an increase of 16.5 per cent up from £502 million in 2009. Spending on food and drink Increased to £111 million in 2015 compared to £95 million in 2009, spending on accommodation increased to £106 million in 2015 which has meant that the accommodation sector now employs more than twice as many people than in 2009[6].
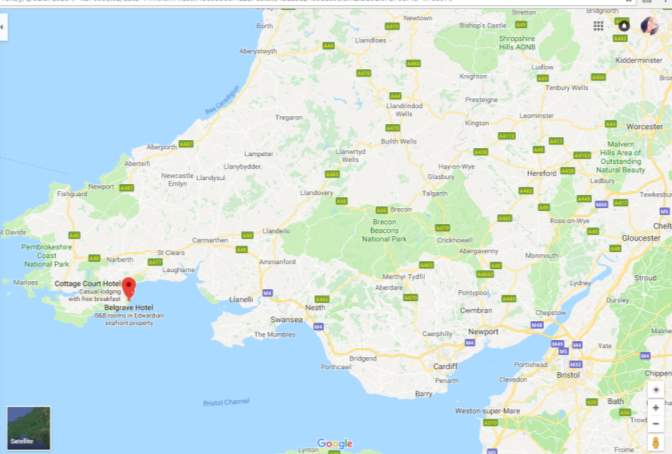
Tenby is well connected by road and by rail, coming to Tenby from the east, the M4 then the A48 just passed Llanelli and finally, Carmarthen, where you’ll pick up the A40. From the midlands A438 which can be joined near Hereford until you reach the A40 at Brecon, Tenby has its own train station maintained and served by Arriva Trains Wales, with regular hourly services to Swansea and onwards to London Paddington via First Great Western. During peak season, trains run direct from Paddington to Tenby. The nearest airport is Cardiff International, reached via either road or rail. With around 16 bus routes running in and around Tenby [7]
[8]
Figure 1b (i)
A40


A48


A438


M4
Figure 1b (i)
Importance and Aim of Research
Local people should be made to feel part and parcel of tourism development by being involved in their management and also to be allowed access to the various benefits accumulated from tourism revenues.
There needs to be an understanding of local people’s attitudes and perceptions in any tourism project since, its operations can only succeed if people are involved and they benefit from the tourist industry.
Having a more participatory approach will guarantee the sustainability of the tourism sector as all stakeholder groups and individuals would be involved in the planning and decision making which will lead to, policies that are more economically, environmentally and socially sustainable. This is because they will all have the opportunity to lobby for themselves during the policy making process
However, it is also important to take into account the tourist, as they are the ones who bring income into the local population. Therefore, their needs and expectations should be met and the planning process for the services available must ensure to balance the visitor’s needs and expectation of the tourist destination while minimising the negative social and environmental impact.
Link to wider geographical context
The purpose of this research is to examine tourism in Pembrokeshire, Tenby. Specifically, it is looking at the impacts which tourism has had in Tenby particularly; it’s economic, social, cultural and environmental impact. This investigation would also, identify the factors which influence the attitudes and perception of tourism for both the residents and tourists and then conclude on what the attitude and perception is.
Understanding the impacts of tourism in the local industry offers planners as well as, all stakeholders who are involved in the tourist industry the opportunity to evaluate the positive and negative impact of the tourist industry, which enables the planners to be able to maximise the positive impacts and minimise the negative impact of the tourist industry.
By understanding the impacts of tourism, researchers would be able to gain insight as to how the local people view the tourist industry in their town; which then offers the understanding of what their attitude and perception are. This would help the government, council and all those involved in the planning a chance to explore and understand local community participation in tourism planning.
The need for planning and involving the local resident in the process has been very successful in coastal decision making being managed through ICZM which involves the local resident when planning which makes the strategy more sustainable. This strategy should also be applied to tourism planning in a sense that, by involving local people this industry would be made more sustainable.
Attitudes and perception of people vary depending on a range of factors such as the nature of involvement in the project and personal characteristics as shown in diverse places. This is why in order to get a true picture of tourism in Tenby local people of all sorts have to be involved to ensure long-term sustainability and success of this industry.
Hypothesis
When local residents are more involved in tourism planning there would be less negative social and environmental impacts. This means that attitude and perception of the residents towards the tourist industry would be positive.
Key questions:
H1:“Does tourism development have a positive impact for local residents’ in Tenby”.
H2: “What factors influence the attitude and perception of tourism in Tenby? What is the attitude and perceptions of tourism in Tenby?”
RESEARCH METHODOLOGY
The following tables contains, risk assessment, sampling strategy, descriptions of the data used to collect the research, data collection process, justification, limitation, effects on result and conclusion and data presentation.
Due to the limited amount of time which I had to collect the data, I used random sampling in order to; obtain a representative, and statistically valid sample of the whole population. As everyone is given an equal chance to participate and be included in the data, while avoiding subjectivity and bias in the selection process.
It is very important I believe, to consider the ethical dimension especially for a qualitative research investigation which raises issues such as face dilemmas such as; anonymity, confidentiality, establishment of honest and open interactions, and avoiding misrepresentations between myself and the 69 participant which would help me to produce a more valid result.
Risk Assessment
| Hazard | Level of Risk | How to minimise it |
| Working Alone: Risk of an attack: Would not be able to call for help. | High |
|
| Dealing with other people: Risk of personal attack/abuse;
Causing offence, leading to abuse/attack. |
High |
|
| Location: Risk of causing offence. | Low |
|
| Health: Risk of accident/ injury. | Medium |
|
MAP OF DATA COLLECTION SITES
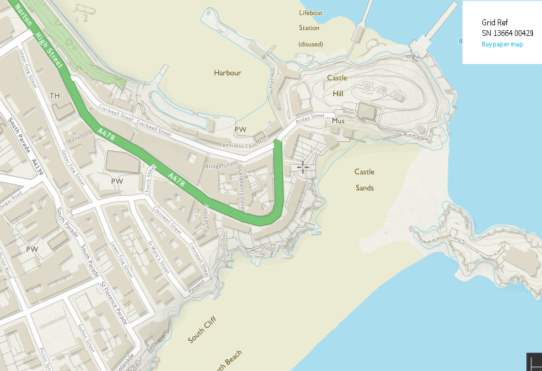
Figure 2
6
4
5
3
1
2
| Keys: | ||
| Site 1: ST. MARYS STREET | Site 2: PARAGON | Site 3: CRESSWELL STREET |
| Site 4: THE HIGH STREET (ST. JULIANS STREE) | Site 5: CREACKWELL STREET | Site 6: BRIDGE STREET |
Methodology
Data Survey:
Questionnaire[10]
Linked to which question:
The questionnaire would help me answer both key questions asked as; the data collected would be useful in analysing impacts of tourism as well as the factors which influence attitude and perception of tourism.
Data collection process:
I collected the data for the questionnaire at Tenby. There were nine questions and I managed to collect a total of 69 questionnaires. I randomly approach people and would politely ask them if they would like to participate in the research, if they agree to participate I would then ask them the questions and record the answers and then thank them for their assistance.
Location of data collection:
I collected data for the questionnaire at all six sites in Tenby. See figure 2. This is important as, at the different sites I was able to get a variety of people from the high street, residential are, beach, and harbour to participate in the questionnaire.
Justification
Using the questionnaire, I was able to record data regarding people’s attitude and perception of tourism as well as what they believe the impact of tourism has been in Tenby. I was able to not only speak to tourist but also residents. I was able to collect detailed information through this data collection method.
Limitation and solutions:
One of the limitations would be asking informative questions whereby the participants answered without a detailed explanation as to why they answered a certain way. Furthermore, as questions were asked on the spot there no way of telling how much thought was given to answer the question or if they were being truthful or just answering them generically. And finally only those who are interested in my research topic were willing to answer the questionnaire therefore their answers may be quite similar as they may have similar opinion.
I went to 6 different sites in Tenby which meant that, I was able to get a variety of different people and therefore responses.
Effect on result and conclusion:
Due to the subjective nature of the questionnaire, and response bias, this would affect the result, by questioning its validity as; the responses given could not be supported or refuted with facts and evidence. However the investigation is to find out what people think and analyse their opinions to draw a conclusion. Hence, it is inevitable that there would be inaccuracies in the data which affects the result but, it is needed in order to form a conclusion.
Data Survey:
Mood mapping: A measure of emotion to energy level to determine mood/attitude.
Linked to which question:
This data collection method is linked to question 2; where the participants placed their moods on a poster, when asked their perception on tourism in Tenby. I would be able analyse this method as one of the factors which influence the attitude and perception and what the attitude and perception is.
Data collection process:
Alongside the questionnaire I had the mood map and would ask participants to place their mood based on their perception of tourism.
Location of data collection:
I collected data at all six sites in Tenby alongside the questionnaire. See figure 2
Justification :
Using the mood meter I would be a great way to analyse the information on the participant’s perceptions and it would be very useful in when looking at patterns within the participants answers.
Limitation and solutions
The limitations for the mood meter would be the same as for the questionnaire as they were both done at the same time in the same conditions.
Effect on result and conclusion:
The effects again for the mood meter would be the same as for the questionnaire as, they were both done at the same time in the same conditions.
Data Survey
Bi-polar
Linked to which question:
This would be linked to question 1, as I would be rating the physical representation focussing on the economic, social and cultural impact of tourism in Tenby.
Data collection process:
For this data collection I walked to two sites in Tenby which are site 4 and 6, were I used my own list of criteria; table 3a (I) and 3a(ii) which had ten features and at both end of the scale it ranged from negative evaluation of -5 to positive evaluation of 5. I would then score the area on this scale for each ten different features such as pollution, safety and security.
Location of data collection:
I collected data for the questionnaire at all two sites in Tenby, site 4 and 6. See figure 2.
Justification:
This data analysis was used to assess the extent of which the tourist industry has influenced the area and each feature would assess the variety of ways in which tourism has influenced the area and the physical representation of tourist activity in Tenby, to decide whether tourism has benefitted the area in terms of physical appearance. This data collection method is very subjective as it is me giving a rating based on my opinion. For example, cuisine where I gave a rating of a positive 5, I counted five non welsh restaurants and food stalls and for the harbour where for the movement of people I gave a rating of 2 I only saw 15 people which in my opinion was not a lot of people. See source 4a.
Limitation and solutions
This data collection is very subjective as it is based on my opinion the rating which I gave each feature which could question that how valid the data is, as it is not a fact. In addition to this, growing up in London and visiting a small Welsh coastal town; I would natural compare the areas to London and my scoring would illustrate that. However, this issue was solved, by comparing Tenby to other coastal areas which I visited in Pembrokeshire such as Sunders foot and Milford Haven and for each rating I would consider these two locations. Lastly, visiting just two sites is not nearly enough to give an accurate picture of the characteristics of Tenby as a whole.
Effect on result and conclusion:
Just two locations which are very close together does not reflect the overall effect of tourism in Tenby in terms of physical characteristic, one of the sites is the high street which would no doubt be the area to show the effect of tourism more than anywhere else in Tenby. This would reduce the validity of the result and increase margin of error however, to reduce this effect I used contrasting areas as site 6 was the harbour and a residential area.
Data Survey
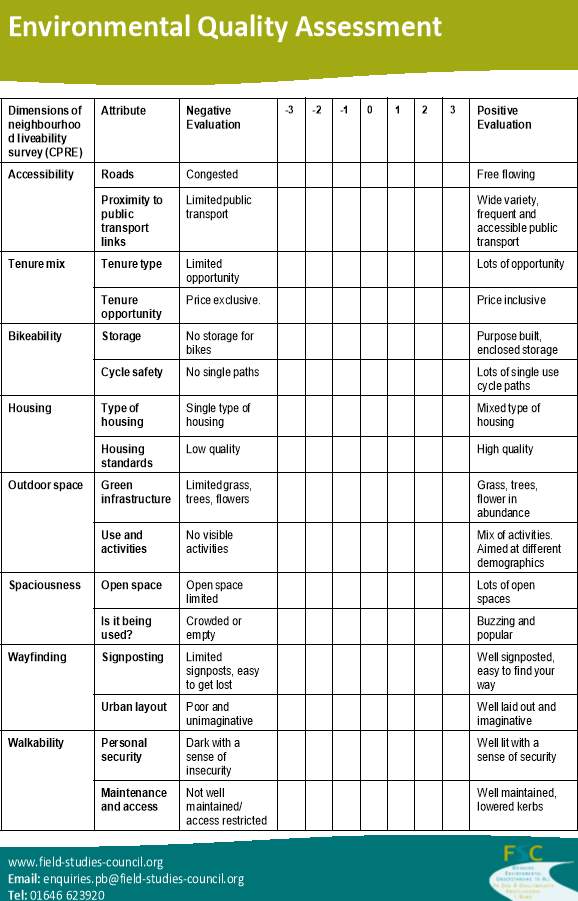
Environmental Quality Assessment[11]
Linked to which question
This is linked to question 1, quite similar to the BI-polar however this focused on the environmental impact of tourism in Tenby.
Data collection process:
The data collection for the environmental quality is very similar to the Bi-polar analysis however the differences includes measuring this at all six different sites, the scales also ranged differently from negative -3 to positive 3. Which is based on the Dimensions of neighbourhood liveability survey (CPRE)” which has eight different features[12].
Location of data collection:
I collected data for the questionnaire at all six sites in Tenby. See figure 2.
Justification:
This survey was significant especially in identifying Tenby as a residential area not just as a tourist and looking at the amnesties and services that is available to the local people and how it compares to the tourist services. The ratings again for this is similar to the Bi-Polar in terms of what I believe was an appropriate score again; comparing it to the other two locations I visited to ensure the ratings is fair.
Limitation and solutions
This also is very similar to the Bi-polar analysis as since above however I did improve this data collection by looking at more variety of sites, four more compared to the Bi-polar in order for it to be more representative of Tenby.
Effect on result and conclusion:
In comparison to the Bi-polar, the larger sample size increase the validity of the result as it would allow me to detect correlation and differences better.
Data Survey:
Linked to which question:
This is linked to question 2, as it is a descriptive way in which participant’s expressed their perception of tourism i in Tenby
Data collection process:
This was done as part of the questionnaire; it was question 6 and 7 seen in source 3; therefore, the data collection is the same. I asked participants to use two words to describe Tenby then two words to describe tourism in Tenby
Location of data collection:
I collected data for the questionnaire at all six sites in Tenby. See figure 2.
Justification:
This form of data presentation gives a visual representation of text data; it is in single words. The importance of each word on the diagram is shown through its font size. This would be very useful and crucial when analysing the perception of both tourist and resident by using their own words.
Limitation and solutions
Again quite similar with the questionnaire; questions were asked on the spot there no way of telling how much thought was given or if they were being truthful or just answering generically and this could be the case especially when looking at the pattern of the words use, and their similarity.
Effect on result and conclusion:
Although this is a subjective data as it cannot be supported or refuted with fact. This is important for the result as it is about what residents’ think; what better way is there to analyse this than their own words with increases the reliability and validity of the result.
Data Survey
5 point Likert scale: A scale used to represent people’s attitudes to a topic.
Linked to which question:
This is linked to question 2, as it measured the participant’s attitudes of the impact of tourism.
Data collection process:
This was question 5 on source 3; it was looking specifically at the impact of tourism in Tenby and what the participant’s perception was. The collection process here is exactly as the questionnaire.
Location of data collection:
I collected data for the questionnaire at all six sites in Tenby. See figure 2.
Justification:
This data is very useful in looking at the attitude of tourist and resident as it is used to measure someone’s attitude by, measuring the extent to which they agree or disagree with a particular question or statement.
Limitation and solutions:
This is relatively easy in terms of collecting and analysing data, it is easily understood and solves a few limitations which arose in the use of questionnaire; however limitation again come into the participant not being not being truthful and just answering generically, there is also the problem of the participants basing their answers on feelings of the subject matter, or on what they think is expected of them to say in addition to this, this method gives a neutral option unlike some other data collection method.
Effect on result and conclusion:
Due to the subjective nature of the questionnaire, and response bias, this would affect the result, by questioning its validity as; the responses given could not be supported or refuted with facts and evidence. However the investigation is to find out what the resident think and analyse their opinions to draw a conclusion. Hence, it is inevitable that there would be inaccuracies in the data which affects the result but, it is needed in order to form a conclusion.
DATA PRESENTATION
DEMOGRAPHICS
| Respondents | Frequency/n=69 | Percentages | Chi-square value= P: 0.05 or 5% | |
| Gender | Male | 37 | 53.6% | x2 =0.36
DF-//=1 P-value=o.54850624 |
| Female | 32 | 46.4% | ||
| Age | 0-15 years | 3 | 4.3% | x2 =26.05
DF=5 P-value=0.00008727 |
| 16-25 years | 15 | 21.7% | ||
| 26-39 years | 17 | 24.6% | ||
| 40-59 years | 21 | 30.4% | ||
| 60-75 years | 11 | 15.9% | ||
| Over 75 years | 2 | 2.9% | ||
| Resident | 18 | 26.1% | x2 =37.18
DF =5 P-value=0.00000055 |
|
| Tourist (visitation) | Less than 5 | 17 | 24.6% | |
| 6-10 | 25 | 36.2% | ||
| 11-15 | 3 | 4.3% | ||
| 16-30 | 2 | 2.9% | ||
| More than 31 | 4 | 5.8% | ||
| Level of education | Secondary GCSE | 20 | 28.9% | x2 =29.03
DF =4 P-value=0.00000771 |
| College
A-levels |
17 | 24.6% | ||
| University graduate degree | 26 | 37.7% | ||
| Master/PHD | 2 | 2.9% | ||
| No qualifications | 4 | 5.8% |
There were a total of 69 respondents who answered the questions. Looking at the demographic of the participant using chi -square (χ2) analysis, I would measure the statistical significance between and among the different variables.
The respondent consists of 53.6%males and 46.4%females using the chi -square (χ2) analysis of 0.36 and the degree of freedom (DF) of 1, we can see that there is no statistically significance in what is observed and the expected values. Additionally in the age category Majority of the respondents (30.4%) were aged between 40-59years while those of over 75yeras had 2.9%, the age variable shows statistical significant between the expected and observed value χ2=26.05, DF=5. In terms of the education level category, University graduate degree achievers had the highest respondents of 37.7% while Master/PHD had only 2.9% which showed statistical significant between the expected and observed value χ2=37.18, DF=5. Lastly the length of residency, those respondents who visited Tenby between 6-10times had the majority percentage of 36.2% and a minimum of 2.9% for those who visited 16-30time, the residency variable shows statistical significant between the expected and observed value χ2=29.03, DF=4. Understanding the demographic characteristic of the participants provides a basis for understanding differences between individual attitude and perception.
Participants had the choice of choosing more than option.
IMPACTS OF TOURISM DEVELOPMENT
Impacts of tourism by Gender
| Impacts of tourism | Male | Female | Total |
| Positive | 25 | 14 | 39 |
| Neural | 10 | 18 | 28 |
| Negative | 2 | 0 | 2 |
| Total | 37 | 32 | 69 |
Chi-Square Test : χ2 = 3.407, DF = 2, χ2/df = 1.70 , P(χ2 > 3.407) = 0.1821:
The result is not significant at p < 0.05.
Impacts of tourism by Age
| Age Group | Positive | Neural | Negative | Total |
| 0-15years | 3 | 0 | 0 | 3 |
| 16-25Years | 10 | 5 | 0 | 15 |
| 26-39Years | 5 | 12 | 0 | 17 |
| 40-59Years | 13 | 6 | 2 | 21 |
| 60-75Years | 6 | 5 | 0 | 11 |
| Over 76years | 2 | 0 | 0 | 2 |
| Total | 39 | 28 | 2 | 69 |
Chi-Square Test: χ2 = 15.649, DF = 10, χ2/df = 1.56 , P(χ2 > 15.649) = 0.1101:
The result is not significant at p < 0.05.
Impacts of tourism by Residency
| Length of Residency | Positive | Neural | Negative | Total |
| Residents | 4 | 12 | 2 | 18 |
| Tourists:
Less than 5 times |
8 | 9 | 0 | 17 |
| 6-10 times | 20 | 5 | 0 | 25 |
| 11-15times | 3 | 0 | 0 | 3 |
| 16-30 times | 2 | 0 | 0 | 2 |
| More than 31 times | 2 | 2 | 0 | 4 |
| Total | 39 | 28 | 2 | 69 |
Chi-Square Test: χ2 = 22.207, DF = 10, χ2/df = 2.22 , P(χ2 > 22.207) = 0.0141:
The result is significant at p < 0.05.
Impacts of tourism by Level of Education
| Impacts of tourism | Positive | Neural | Negative | Total |
| Secondary GCSE | 16 | 2 | 2 | 20 |
| College
A-levels |
15 | 2 | 0 | 17 |
| University graduate degree | 6 | 20 | 0 | 26 |
| Master/PHD | 2 | 0 | 0 | 2 |
| No qualifications | 0 | 4 | 0 | 4 |
| Total | 39 | 28 | 2 | 69 |
Chi-Square Test: χ2 = 38.793, DF = 8, χ2/df = 4.85 , P(χ2 > 38.793) = 0.00001:
The result is significant at p < 0.05
Bi-Polar
THE HIGHSTREET
| Criteria | Negative evaluation | -5 | -4 | -3 | -2 | -1 | 0 | 1 | 2 | 3 | 4 | 5 | Positive evaluation |
| Pollution | Noisy, Litter | ✔ | Clean and Quiet | ||||||||||
| Movement of People | Congested and Very busy | ✔ | Disperse atmosphere | ||||||||||
| Public space | Run down, littered, no vegetation | ✔ | Sociable, vegetation
Pedestrian activity |
||||||||||
| Infrastructure | Derelict | ✔ | Good repair, Well maintained | ||||||||||
| Retailers | Empty premises, No variety | ✔ | Diversity, full of activity | ||||||||||
| Historic sites | No historic feature | ✔ | Lots of historically preserved sites | ||||||||||
| Leisure activity | No sign of activity or event being ran | ✔ | Sports, culture and amusement facilities, Events | ||||||||||
| Cuisine | Traditionally Welsh | ✔ | Varity: European, Chinese etc. | ||||||||||
| Vandalism/graffiti | Visible sign and feature | ✔ | No sign | ||||||||||
| Safety and security | Limited street lighting, no burglar alarm Security camera | ✔ | Well lit, Security Cameras, Burglar alarms, Police presence |
THE HARBOUR
| Criteria | Negative evaluation | -5 | -4 | -3 | -2 | -1 | 0 | 1 | 2 | 3 | 4 | 5 | Positive evaluation |
| Pollution | Noisy, Litter | ✔ | Clean and Quiet | ||||||||||
| Movement of People | Congested and Very busy | ✔ | Disperse atmosphere | ||||||||||
| Public space | Run down, littered, no vegetation | ✔ | Sociable, vegetation
Pedestrian activity |
||||||||||
| Infrastructure | Derelict | ✔ | Good repair, Well maintained | ||||||||||
| Retailers | Empty premises, No variety | ✔ | Diversity, full of activity | ||||||||||
| Historic sites | No historic feature | ✔ | Lots of historically preserved sites | ||||||||||
| Leisure activity | No sign of activity or event being ran | ✔ | Sports, culture and amusement facilities, Events | ||||||||||
| Cuisine | Traditionally Welsh | ✔ | Varity: European, Chinese etc. | ||||||||||
| Vandalism/graffiti | Visible sign and feature | ✔ | No sign | ||||||||||
| Safety and security | Limited street lighting, no burglar alarm Security camera | ✔ | Well lit, Security Cameras, Burglar alarms, Police presence |
Numbers show the amount of people who chose that option.
Environmental Quality Assessment.
| SITE 1 | SITE 2 | SITE 3 | SITE 4 | SITE 5 | SITE 6 | |
| Road | 1 | 1 | 1 | 2 | 1 | 2 |
| Proximity to public transport links | -3 | -3 | -3 | 0 | 1 | 2 |
| Tenure type | 3 | 1 | 3 | 2 | 2 | 1 |
| Tenure opportunity | 2 | 1 | 2 | 2 | 2 | 2 |
| Storage | -2 | -3 | -3 | 0 | 0 | 0 |
| Cycle safety | 0 | 0 | 0 | 1 | 0 | 0 |
| Typeofhousing | 1 | -1 | -1 | 2 | 1 | 1 |
| Housing standards | 2 | 3 | 2 | 2 | 1 | 2 |
| Green infrastructure | 1 | -2 | -2 | 2 | 1 | 1 |
| Use and activities | -1 | 1 | -2 | 2 | 1 | 2 |
| Open space | 0 | 0 | 0 | 1 | 0 | 2 |
| Is it being used? | 0 | 0 | 0 | 1 | 2 | 2 |
| Signposting | -2 | -3 | -3 | 1 | -1 | 1 |
| Urban layout | 2 | 2 | 2 | 2 | 1 | 1 |
| Personal security | 3 | 2 | 2 | 3 | 1 | 2 |
| Maintenance and access | 1 | 2 | 1 | 2 | 1 | 2 |
| TOTAL | 8 | 1 | -1 | 27 | 14 | 23[13] |

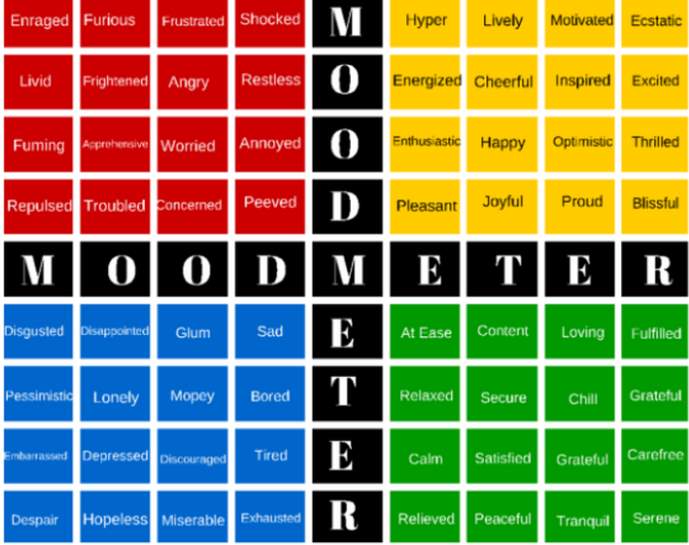 Mood Meter
40
40
40
4
COMMENTS:
By participants with negative feeling
- “Tenby is for older people, there’s nothing for younger people”
- “New building does not fit with the historical ones and the landscape is changing very quickly”
- “Local fishing industry is at risk”
- “Increase in the odd group of hen and bachelor party”
| The number is showing how any people placed there mood in that category.
0 25 |

Word Cloud: Tenby

Word Cloud: Tourism in Tenby
DATA ANYLISIS
Research Question 1: what is the impact of tourism?
The bigger the word- the more frequent it was used
Does tourism development have a positive impact for local residents’ in Tenby?
For tourism development to have a positive impact there needs to be long-term sustainability in the industry, which occurs when benefits of tourism is maximised while the costs of the growing industry in minimized.
I have categorised the impacts of tourism into four categories:
- Economic
- Social
- Environmental
- Cultural
For each category I would analyse the positive and negative impact of tourism development in Tenby.


Economic impacts: As seen in graph 1 participant agreed that tourism has had the most impact on the local economy. Of a total of 89 responses made by the 69 participants 40 stated that Tenby’s economy has had the impact by the tourist industry; this is because the most notable impact of tourism would be the increase in employment opportunity. With increased employment, income for the local people would increase which would also help increase the standard of living. This is particularly important for a town like Tenby, which previously was dependant on only one industry which was its fishing industry. A growing tourism industry would provide diversification which would increase Income Avenue examples include investment in infrastructure, technology, facilities and services such as roads, public transportation (seen in Figure 1b (I)), coastal protection and retail mix of both independent and big chain retailers as seen below. This can be utilised by tourist and residents therefore benefitting both groups. This is supported by the Bi-Polar analysis whereby, on the high-street infrastructure and retailers both scored a positive 2 and 4 respectively. All these combine to make this industry vital to the local economy as spending alone on local bossiness in 2010 generated £585million
However, there is also the negative economic impact which includes the fact that, businesses which are associated with the tourism industry often include a significant number of low-paying jobs, minimum wage or less; which are often seasonal, resulting in under-employment or unemployment during off-seasons generally at winter. Additionally, there would be general increase in price of e.g. Land, houses, basic goods and services. As a result of increase in demand (demand pull inflation), cost of living would increase this would offset the increase in income of the local residents. Furthermore, with big chain providers and suppliers such as Tesco and Holland & Barrett, which take away a majority of the revenue generated away from the local community therefore, reducing the economic gain for residents and the economic which the tourism industry has in Tenby.
Social impacts: Social impacts was rated second by 24 participants in graph 1 for impact of tourism. Social impact is very big factor on how the tourist industry would impact the local residence. With a growing tourist industry more opportunities socially arise such as; the provision of recreational facilities for residents as well as tourists, new parks, and roads, support the process of modernizing the area for tourist but also to the benefit of the local residents, more theatres, movies, concerts, and athletic events e.g. the annual iron man contest; which the residents as well as tourist would enjoy. This would set Tenby apart from surrounding areas that do not have access to these services and facilities enjoyed by Tenby residents. This is supported by the Bi-Polar analysis whereby at both the harbour and High street, it was rated 4 at both sites. Additionally, with increased number of tourists visiting Tenby each year, bringing along with them their individual values and culture. This would promote cultural exchange with the local residents, who can adapt to tourist behaviours bringing positive changes to Tenby’s value and customs. This then allows Tenby residents to improve their understanding of different values and custom, which would then promote greater social tolerance.
It is unarguable that the tourist industry has brought some negative consequences to Tenby which includes; increased traffic congestion, overcrowding and traffic jam in public areas, which creates stress, annoyance, anger, and other negative attitudes from local residents. In addition to this, social problems such as increased crime, increased consumption of alcohol, begging, gambling etc. This is clear thorough one of the comments in Figure 3a (ii) of increased bachelorette and bachelor parties which are associated with this behaviour this then creates conflicts with the local community traditional and cultural values.
Hotels, restaurants, and shops which is good for the local economy however, this can push tourism development into residential areas, forcing changes in the physical landscape of Tenby; this is an issue in Tenby, as one of the participants in Figure 3a (ii), commented on how “New building does not fit with the historical ones and the landscape is changing very quickly”. Furthermore, traditional services may be forced out or relocated due to increased competition from new businesses which could then create resentment from local residents as they are not seeing the benefit of this industry. This is made worse when local residents feel excluded from tourism development.
Environmental impacts: The environmental was rate 3rd on the impacts of tourism development in Tenby see graph1. In Tenby, tourism has helped create greater awareness for the need to preserve and protect the natural the environment to capture its scenic natural beauty for tourist purposes, which has resulted in increased investments in the environmental infrastructure such as coastal protection for the north and south beach e.g. the sea wall just behind the harbour protecting the residential area, preservation and restoration of historic buildings and monuments, providing maintenance to public space and the management of protected areas. Additionally, land can be developed to prevent ecological decline for tourist purposes such as accommodation or recreational activity which can generate income; in 2015 spending on accommodation raised £106million and this sector employs twice as much as it did in 2009. This has been the case for the high-street and harbour; looking at the environmental quality assessment on table 4 site 4 and 6 seems to have been heavy invested in and protected scoring total of 27 and 23 respectively with high score given for housing standard, personal security and maintenance and access.
However, tourism does result in environmental pollution such as; air, noise and soil through the movement of people and vehicle and this would continue as tourism would continue to grow from the current over 4.3 million who visit Pembrokeshire annually. The degradation of vegetation and the depletion of wildlife also arise as another negative impact of tourism because as tourism grows there would need to build new infrastructure to meet the demand especially in prime locations like beachfronts, which would mean in reduction in the natural environment, degrading of landscapes, historic sites and monuments would be lost. This has been the case for site 2 and 3 scoring 1 and -1 respectively dues to; lack of close proximity to public transport links, storage, green infrasture and signposting. This comes from a lack of investment as these areas are not tourist attraction, they are residential areas therefore there is little if any incentive to invest there.
Cultural impacts: Culture was only chosen by 12 participants just one below environmental see graph 1. This can be attributed to the fact that there were only 18 residents compared to 51 tourists whom answered the questionnaire; tourists would therefore be less likely to be aware of the cultural impact of tourism in Tenby.
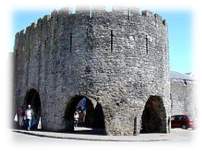
Tourism in Tenby has resulted in positive cultural impacts in Tenby which includes; the preservation of sites with historical such as the “Five Arches Gate”, that is part of the old town walls of Tenby. The interest by tourists in local culture and history allows cultural and aesthetic values and historical artefacts to be preserved, which then increases the demand for historical and cultural exhibits such as, Tenby Museum and Art Gallery on Castle Hill. Additionally, tourism would also encourage local activity such as fishing and promotion of local cuisine to the tourist through the various restaurants and other meals produced using local produce. This has also help Pembrokeshire’s reputation for its excellent food and high quality agricultural produce. On the other hand, tourism has resulted in negative socio-cultural impact such as the changing lifestyle for the local people especially young people with the incoming services provided for the tourist and residents. This has lead to cultural erosion particularly for traditional fishing and agricultural industry which are closing down as only a few people want to be involved in this industry as they would rather be join the tourist industry which offer better pay .
Through this Data collected from the
Research Question 2: what factors influence the attitudes and perception of tourism in Tenby? What is the attitude and perception of tourism in Tenby?.
The focus of the research task is to understand the factors which influence the attitude and perception of local residents towards tourism development in Tenby. To calculate this; the impact of tourism is analysed against four independent variables; Gender, Age, Residency and Level of Education.
Gender
According to gender Table 2b (i), the ratio of male to female was relatively well distributed although proportion of male to female was at 53.6% compared to 46.4%. The results of the Chi-square (χ2 ) analysis and the p-value for the perceptions of the impact of tourism development by gender: Chi-Square Test : χ2 = 3.407, DF = 2, χ2/df = 1.70 , P(χ2 > 3.407) = 0.1821. The results show no significant relationship between the two variables. This shows that the gender of participants does not influence their perceptions towards tourism development. Male participants at double the female had a positive perception of tourism impact however; this difference was not found to be significant.
Age
According to age Table 2b (ii), there were six different age category, In terms of distribution they were relatively between the 16-75years age brackets. The results of the Chi-square (χ2 ) analysis and the p-value for the perceptions of participants by age groups: Chi-Square Test: χ2 = 15.649, DF = 10, χ2/df = 1.56 , P(χ2 > 15.649) = 0.1101. Results show no significant relationship between the two variables therefore, participants’ perception of tourism development is not influenced by age categories.
Therefore, age and gender did not have significant roles in determining participant perceptions on the impacts of tourism development.
Residency
According to age Table 2b (iii), illustrates the results of the Chi-square (χ2 ) analysis and the
p-value for the perceptions of tourism development by residency, this showed statistical
significance: Chi-Square Test: χ2 = 22.207, DF = 10, χ2/df = 2.22 , P(χ2 >
22.207) = 0.0141; this result is significant at p < 0.05. Therefore, participants’ perception of
Tourism development is influenced by their residency.
Residents were the ones who perceived the impact of tourism in Tenby to be negative. This shows that the closer a resident lives to a tourist destination, the more likely that resident will develop negative attitudes towards tourism development. This is also supported by Figure 3a (I): Mood Meter and Figure 3a (ii): Comments which were made by the residents. On the other hand most who thought tourism had a positive impact were tourist of the third category see Table 2b (iii), which they do not to experience the negative impact of tourism like the residents.
Level of Education
According to age Table 2b (IV), illustrates the results of the Chi-square (χ2 ) analysis and the
P-value for the perceptions of tourism development by Level of Education showed statistical
significant at p < 0.05: Chi-Square Test: χ2 = 38.793, DF = 8, χ2/df = 4.85 ,
P (χ2 > 38.793) = 0.00001. Therefore, participants’ perception of tourism development is
Influenced by their level of education.
This could be the case whereby, the more educated you are the more likely you would be
able to understand the impact of tourism but also are better informed and more knowledgeable about impacts which tourism would have had in Tenby.
Another factor which influences the participant’s attitude and perception of the impact of tourism would the social, economic, cultural, and environmental impact. For example, people who are economically reliant on the tourism industry will have more favourable attitudes towards tourism development, especially in the case of low-income individuals or a town recovering from economic decline and unemployment , would generally have a positive attitude towards the tourism industry as it unarguable brings potential economic benefits to them. In addition to this another factor would be the level of resident interaction with tourists, high level interaction would mean the attitude and perception of local communities in regards to tourism will be positive, the access which residents have to recreational amenities and facilities made available through tourism affects their perception and attitude towards tourism, if residents perceive that tourism development develop the recreational facilities they use, they are likely to develop positive attitudes. On the other hand, if the opposite occurs where the resident loses accessibility to the recreational assets, they are more likely to develop a negative attitude towards the industry.
Through question one on the impacts of tourism in Tenby, we do know that there are positives butt also negative however this does show when studying graph 3; the 5-point Likert scale as no participants perceived that tourism had worsen Tenby whether significantly or somewhat. All participants had chosen that they perceived that the tourist had actually significantly and somewhat improved Tenby while a smaller number where neutral. This perhaps shows that despite the negative social, economic, cultural, and environmental impact impacts the benefits outweigh it. Additionally, the information gathered from the tag cloud and mood meter shows that a lot of the residents as well as tourist who participated in the questionnaire do have positive attitude and perception of tourism in Tenby. Only a small percentage of 5.8% out of 60 had negative feelings towards tourism development with their reasons stated above Figure 2a (ii). However, these individuals also acknowledged that in spite of these feelings, it’s unarguable that tourism has had more positive impact for the local people than negative.
This is also similar for the word cloud all the words used to describe Tenby was positive Figure 4a (I); this shows that overall attitude and perception of both locals and tourist is positive. However tourism in Tenby also similarly, received positive words many of which were referring to the positive economic effect of tourism such as essential for the local economy, Busy referring to the economy again and the amount of people who visit annually on average; over 4.3million visited Pembrokeshire in 2010 of whom a large percentage are heading for Tenby compared to a population of 4,696(2011census), income was mentioned and thousand of millions of pound is generated annually in Tenby from this industry and finally diversity refe3ring to the positive social and cultural impact tourism has had in welsh town. However, there were no out right negative words some issues were raised such as the fact that the tourist industry is seasonal only really thriving in the summer, expensive specially referring to the high cost of living compared to surrounding areas in terms of House prices and rent and lastly, annoying; this specific word was used by a resident who made the fourth comment in figure 3a (ii) , who also mentioned something important which was the increase in the amount of second-home owner in Tenby, whom are driving up the house prices making it really difficult for resident to offered the houses in Tenby relative to their income. If this feeling continues to grow it would reach a point whereby the economic benefit of tourism would no longer outweigh the cost which the local residents are paying for; which would be the exact opposite of the positive attitude and perception which is being experienced both by tourists and residents.
Conclusion
Does tourism development have a positive impact for local residents’ in Tenby?
The first objective of this research was to understand the impact of tourism for the local residents in Tenby. Which through my research it is clear that tourism has had a positive impact for Tenby particularly its local economy as seen through many of the words which participants used to describe tourism in Tenby in the word cloud such as “income, employment, vital,” this goes to show how valuable this industry is for residents in Tenby. The residents in Tenby do recognise this, in the questionnaire Graph 1 45% of the respondents recognised this as the most affected area from the growth in the tourism sector making it the driving force behind the economic and social welfare.
From written comments in Figure 3a (ii), as well as casual conversations with participants the majority of them, seemed to understand the economic benefit of the tourism industry for the region. However, many of them expressed annoyance and anger towards the negative social impacts of the tourism industry. They pointed out the negligence and lack of community support from both the industry and local authorities to help reduce this.
Even the negative comments can be seen as positive especially in relation to the economy for example; the new buildings shows development, as it provides employment in the construction sector with improving labour market conditions demand for housing would increase a and with increase number in second home owner this town for many is worth investing in. Furthermore, the increase in bachelor and bachelorette parties show that the town is becoming increasingly popular among young people which is good for business as they are spending money and contributing to the local economy.
This investigation I believe helps to address a gap and is very relevant today and will continue to be in the near future as the tourism industry in Tenby more and more as its becoming a popular seaside resort for various group of people. As it continues to grow it should be more sustainable and this can only be achieved when the positive impacts outweigh the negative. This is why by understanding what the positive impact is, it can be maximized while the negative impact, can be minimized.
Hence why, tourism planning involving the local people is vital, to help understand the residents needs, interests, and limits which, would help the planners and developer plan the industry to really fit the needs and want of the local people which, would help create support as well as enhance support the value of tourism to the local community. Local communities can also provide new and creative ideas that can result in more successful commercial activities. This would go a long way in making it very successful and sustainable.
The research found that all participants whether residents who are aware of the impact or the tourist perceived impact, they all acknowledge the positive impact of tourism positive in Tenby.
What factors influence the attitudes and perception of tourism in Tenby? What is the attitude and perception of tourism in Tenby?.
The second objective of this study was to understand the overall attitude and perception of tourism development and the factors which influence this. To understand this, participants’ perception of tourism development was analysed against socio-demographic factors to understand how it influenced their perception and attitude.
On one hand, two of the variables; age and gender found no significant relationship with the participants’ attitude and perception of tourism development. On the other hand, education and the length of stay did show a significant relation with the participants’ perception and attitude of tourism development. This has to do with knowledge where by people with higher educational qualifications would be able to analyse as well as evaluate what the impact of tourism is in Tenby to then form and opinion. Residency creates a relationships between local communities and the tourism industry and the closer the relationship they more they are able to see the impact.
My result I believe went challenges a previous investigation which found that there was little evidence in perceived tourism development by socio-demographic characteristics. I think repeating this investigation again in the same condition would help me replicate the same results or not.
Additionally, the Likert-scale was used where results showed; 33% of participant perceived tourism to have improved Tenby significantly, 43% somewhat improved and 23% were neutral while there were no responses on how it has worsened Tenby.
I can therefore conclude that the attitude and perception of local residents towards tourism development in Tenby is positive however, there are still individuals who negative attitude and perception of tourism is starting to develop. Due to the negative impacts that has risen alongside the growing tourist industry, these individual are not against tourism in Tenby as Their concerns should be adhering to ensure that this dissatisfaction among the small group of people does not increase as the tourism industry would surely develop and increase.
For my investigation, I focused on the attitude and perceptions on tourist and residents of tourism development, and what has made them to come to this conclusion to then develop whatever their attitude and perception is. However, to the best of my knowledge other investigation have examined this two groups as separate entities failing to see that they do inter-link and there are similarities between these two group on what the impact of tourism is in Tenby and their general attitude and perception on this growing industry.
Source 1: Bibliography
- http://www.tenbyvisitorguide.co.uk/
- http://www.bbc.co.uk/schools/gcsebitesize/geography/tourism/tourism_trends_rev1.shtml
- https://www.wikipedia.org
- http://nwef.infobasecymru.net/IAS/themes/databyregionalpriorities/tourism/view?viewId=1079
- http://webarchive.nationalarchives.gov.uk/+/http:/www.culture.gov.uk/images/publications/sustainabletourismengland_frameworkap.pdf
- http://www.tourismexcellence.com.au/growing-destinations/planning-for-tourism/the-tourism-plan.html
- https://padlet.com/fscdfor/556vax708s4v
- https://osmaps.ordnancesurvey.co.uk
- https://www.visittenby.co.uk/
- http://www.velothon.com/triathlon/events/emea/ironman/wales/athletes/travel-accommodation/travel.aspx
- https://en.wikipedia.org/wiki/Tenby
- http://www.tenbyvisitorguide.co.uk/
 Source 2
|
Source 3: QUESTIONAIRE |
Top of Form
1. What is your Gender?
Male
Female
2. What is your age?
0-15years
16-25years
26-39years
40-59years
60-75years
Over 75years
3. What is your Level of Education?
Secondary (GCSE)
College (A-Level)
University Graduate Degree
Masters/PHD
4. What impact do you think tourism has had on Tenby?
Positive
Negative
5. Has tourism?
Significantly Worsen
Worsen Somewhat
Neutral
Improved Somewhat
Significantly Improved
6. What two words would you use to describe Tenby?
………………………….
…………………………..
7. What two words would you use to describe tourism in Tenby?
……………………………………..
……………………………………….
8. Are you a local resident or tourist?
Yes
No
If no how often do you visit?
Less than 5 times
6-10times
11-15times
16-30times
More than 31 times
9. Where has tourism had the most impact?(can choose multiple options)
 Environmental
Economic
Cultural
Social
[1] Source: World Tourism Organization (WTO).
[2] Source: Sustainable Tourism in England: A framework for action
[3] https://maps .google.co.uk
[4] https://maps .google.co.uk
[5] wikipedia.org/wiki/Tenby.
[6] >Source: STEAM (Scarborough Tourism Activity Monitor).
[7] Source: Tenby visitors guide.
[8]nhttps://maps .google.co.uk
[9] Source: https://osmaps.ordnancesurvey.co.uk/51.67178,-4.69997,17
[10] Find in Source 2
[11] Source 3
[12] Source 3
[13] Detailed criteria: Source 2
[14] Source: http://eenhigby.weebly.com/mood-
[15] Source: https://maps .google.co.uk
[16] Photo taken by Victoria Adebayo
[17] Photo taken by Victoria Adebayo
[18] Photo taken by Victoria Adebayo
[19] Source: https://maps .google.co.uk: Five Arches Gate
Cite This Work
To export a reference to this article please select a referencing stye below:
Related Services
View all


Related Content
All TagsContent relating to: "Travel and Tourism"
Travel and Tourism refers to travelling to places of interest, whether for pleasure or business. Tourist destinations will often have a multitude of attractions, food and drink venues, and other forms of entertainment for tourists to enjoy.
Related Articles

DMCA / Removal Request
If you are the original writer of this dissertation and no longer wish to have your work published on the UKDiss.com website then please: