Games Console Marketing Strategies: Sony vs Microsoft
Info: 9006 words (36 pages) Dissertation
Published: 2nd Mar 2022
Tagged: MarketingTechnologyVideo Games
1. INTRODUCTION
Video games have been around us for a long time that an interest in their history is growing. Many of us who grew up with the games look back fondly on those early day and some of them are still active gamers to this day. Many have become gaming collectors who try to preserve the history of consoles along with the games themselves. Rest are too young to remember the first generations of video games and are curious about them. It is difficult for one to find older games still others may look upon games as a part of a popular culture. In less than four decades’ games on consoles have gradually gone from a simple bouncing block graphics to a global industry of enormous proportions. Video game industry in U.S. along made a record of $12.5 billion in 2006. They have a growing influence on other media like TV, Internet, movies and are played by hundreds of millions worldwide. It has been noticed that relatively little has appeared about the information related to older games, gaming consoles/systems and arcade games in general, because a part of the reason is that many old games are already gone or very hard to find and play thus making it difficult to write about them. It also suggests a greater need for historical research before it’s too late. (Wolf)
Sony PlayStation was the foresight of “Father of PlayStation”: Ken Kutaragi who wanted to drive the change in the future of video gaming. Ken Kutaragi who was amazed by the Sony’s System G, envisioned of providing this high level of computer graphics in 3D through console gaming which will ultimately dominate the video game industry. CD -ROM technology was becoming important to gaming industry in the early 90’s as it offered a unique interactive experience and a cheaper alternative to the rising costs of cartridges which were expensive to manufacture. At first Sony’s management, did not want to get involved in the video gaming industry because they thought that the console would be considered as a toy and it would tarnish their brand perception of being a superior high end electronics manufacturer. Still Ken Kutaragi persuaded Sony management to design a CD-ROM unit for SNES to add the processing power to gaming unit, making it as the most powerful gaming console during the era. Sony announced during the 1991 Consumer Electronics show that it was partnering with Nintendo to release SNES CD-ROM PlayStation, but later Nintendo contradicted their announcement stating that they have a separate deal with Philips to release SNEN CD.
After further negotiation between Nintendo and Sony the deal of PlayStation was called off. This motivated Ken Kutaragi to design a new video game console using 32-bit cutting edge technology which provided 3D graphics. The code name for the secret project was “PS-X”. Finally on 3rd December 1994, PlayStation was released in Japan as the first of ubiquitous PlayStation serious of console and hand-held devices. Later is has included the successor upgrades and consoles including the Net Yaroze – an instruction program PlayStation games and applications, PSOne – A smaller version of the original PlayStation and PocketStation – A handheld device which enhanced PlayStation games and acted as a memory card. Competing against the Sega Saturn and Nintendo 64, it was the part of the fifth generation of video game consoles. PlayStation and PSOne had shipped a combined total of 102.49 million units, eventually becoming the first ever video game console to sell 120 million units. (The History of PlayStation, n.d.)
The idea that Microsoft should develop its own gaming console began way back in 1998 where Kevin Bachus, Ted Hase, Otto Berkes and Seamus Blackley formed the software giant’s first console after successfully pitching their idea to Bill Gates. It was originally coded as “DirectX Box” as the console was intended to be the first game system which was built like a PC and bring all the power and flexibility of a gaming rig to the console industry. They wanted the system to run on Windows 2000 thus making it easy for traditional PC software developers to work with the console’s hardware architecture and feature more than twice the processing power of industry leading PlayStation 2. On 15th November 2001, Microsoft Xbox was launched with impressive hardware but it was believed that Xbox will not able to compete with PlayStation. The first game on Xbox was Halo: Combat Evolved which became synonymous with the Xbox. Microsoft Xbox was followed by Microsoft Xbox 360 and Microsoft Xbox One aka Microsoft Xbox 720 (current parent console in the market). One key to the success of console’s popularity is of its flagship game, Halo, which offered the one-two punch of being both exclusive to Xbox and one of the first-person shooter genre’s most compelling and groundbreaking titles to hit the shelves in years. Halo’s sales shattered all the previous records with more than 1 million copies of the game sold in the first few months of its release. (Marshall, 2013)
Sony and Microsoft are both big, major players when it comes to gaming consoles. Both have set their roots in the gaming industries and are always coming up with new innovative ideas for their new consoles. But still Sony PlayStation has the largest market share with PlayStation 4 Total Sales: 40,589,739 and Xbox One Total Sales: 21,055,528.
The objective of this research project is to find out the strategies used by Sony and Microsoft to place their gaming consoles in the market and to figure out what strategies are used by Sony PlayStation which makes it more successful than Microsoft Xbox.
The relevance of this study will help in getting the following information:
- What are main reasons why customers prefer Sony PlayStation over Microsoft Xbox?
- How Sony PlayStation is still managing to overpower Microsoft Xbox?
- Advantages of Sony PlayStation over Microsoft Xbox.
- What are the strategies applied by Sony PlayStation and Microsoft Xbox and how do they differ from each other?
The research project will give an insight of the strategies used by both the companies. This research will also help in gaining knowledge of the factors that drives the customer’s preference of buying either a Sony PlayStation or Microsoft Xbox.
2. LITERATURE REVIEW
Over a period of 25 years, the video game industry has experienced an enormous growth compelling success is a manifestation. This industry has grown annually in between 9% and 15% (Zackariasson and Wilson 2010). The economic value of video games has shifted from a niche industry to a blockbuster industry. As per the research today more people globally play video games than go to the movies (NPD Group 2009) and in 2012, the global revenues were an estimated $67 billion for console and portable hardware and software along with the mobile devices for example tablets and smartphones. An additional of $14.8 billion were generate through sales of so-called virtual goods within games in 2012. They are about five times higher than global music revenues – $16.5 billion in 2011, higher than consumer book sales – $69.4 billion in 2011. Video game industry is characterized by growth of high degree of innovation and dynamics.
Consumers in this virtual world can manipulate and change their environment through realistic animation and exciting motion sensing controllers where the games have the capabilities to tackle social issues, educate children and train employees (ESA 2012a). From Military training programs to molecular biology and virtual showrooms for new product presentation, the game has applied to these various fields using technology (The Economist 2011). “Gamification” concept has even inspired management scholars to describe the application of psychological game design principles for motivating employees and engaging consumers (Zichermann and Cunningham 2011).
A conceptual framework has indicated the value is created in the video game industry (Fig 2.1) where it details the industry constituents and their relationship which includes the key products, players and channels. A vertical path is distinguished in this framework which represents the “gaming environment”” the main actors, such as context providers like Activision, Ubisoft who are game producers, platform providers like Sony, Microsoft and Nintendo and last but not the least consumers along with their interrelationships. A second horizontal path refers to the channels of distribution and communication the link customer to the content providers. Here the focal element is platform but in the framework, the perspective of the content provider is taken under consideration rather than taking the platform provider because it’s the game content that ultimately define the industry. A specific characteristics of the game industry’s business model has combined the existence of content and platforms within the gaming environment. It holds interest for both managers and researchers.
Other revenue streams for games such as in-game advertisement, address spread of innovative platforms are critical for encouraging ubiquitous gaming formats. The issue of distribution relates to both the digital channels and traditional retail outlets including the game platform itself. Finally, the particularities of producer-initiated communications which includes one-directional communication through traditional media such as television marketing, links of the game or through game platforms, bi- or multidirectional communication on social media channels such as social networking websites like Facebook. (Wolf, 2013)
The framework which is being discussed acknowledges further the important roles of three additional institutions for the value creation process of video games. First, the video game industry is very closely related to the entertainment industries such as the motion picture industry. Industries like such can provide inspiration for games to generate “related content” for games, example – adaptation of film narratives or vice versa where films are made from a game like Lara Croft: Tomb raider movies. Second, the technology of the platform is important as games’ value depends on it. As number of game titles available are growing immensely, automated recommender systems have emerged in the industry as an important source of information for consumers who seek the “right” game for them. A business opportunity for game producers to market the “long tail” can also be offered to them. (Anderson 2006). Third, consumers also influence the decision of an individual and the value that they derive from a game through behavioural or communicative recommendations likes word of mouth or observational learning or through adaptation of game because of network effects. It has also been argued that games have put an impact on consumers’ personalities which stimulates violence for example and subsequently society find it complex and multi-faceted. (Wolf, 2013)
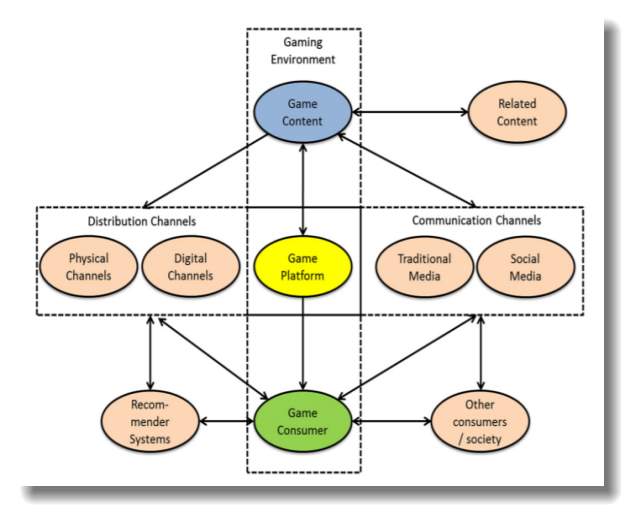
Fig 2.1 Conceptual Framework
In the home of video game industry, Sony PlayStation has been so far the most successful product. As per to the official reports, 85 million hardware units and a staggering more than 780 million games were sold worldwide. In 1999, a huge amount of Sony Corp. profits stemmed from it’s video-games division, Sony Computer Entertainment Inc. (SCEI) which was before the launch of Sony’s successor to the Play Station. Sales pattern of PlayStation hardware (1994-2000) and software (1997-2000) worldwide. Sony has a negative net present value, NPV, despite the huge levels of sales which is the discounted cash flows would have been lower than the initial investments. Sony claims to spent about $530,000,000 to develop PlayStation (SCEI, 2001) and it doesn’t have any direct cost or variable cost used in the actual production of the hardware. (Alberto, 2010)

Fig 2.2 PlayStation hardware sales, units (1994-2001) (Source: SCEE, 2001 press release)

Fig 2.3 PlayStation software sales, units (1997-2001) (Source: SCEI Press release)
The main drive behind the consumers’ decision to buy a video game console can be understood fully by the factors that are likely to influence the success of a console. The answer which is obvious yet terribly important is to enjoy playing games. It is the great games that determine whether a system will be a viable content in the long run or not. Other factors are price, availability, performance, reliability, shape, size and colour are important factors. But all of the above, stretched and combined to their maximum level could not be compensated for the lack of fun to play games with. The relationship for sales between hardware and software are far more complex. The more quality games are available the larger installed base will be. Which means that the customers will choose the console based on kind of games they want to enjoy the most. A software developer will make choices about to develop games for which console with an eye on the current installed base. If the installed base is not large enough, third parties may often wait for it to reach the break-even level before starting the development of a past of the game or a new game that has proved themselves successful on other gaming platforms. (Alberto, 2010)
Male students typically love to play video games which is a well-established fact, but the research also shows that there are female students who enjoy playing video games as well. Although there is a different in the intensity and the type of games female video game players enjoy. Games like “The Simms”, “Dance Dance Revolution” and “Mario Kart” Are the top three games. Destructive games like “Street Fighter”, “Doom” and other war games that are famous among males cannot be seen anywhere. Car games were in first place followed by “The Simms”, students also mentioned that prefer playing games. U.A.E has hosted many video games competitions and 80% of UAW nationals have an access to the internet and have more than two cell phones as per the research, also video consoles are extremely popular. (Mario, n.d.)
In Middle East, the gaming sector is estimated to be between USD 1 billion and 2.6 billion in terms of revenue. Since 2010, the number of people downloading videos games online has almost doubled. Middle East has the second largest mobile phone population which comes to approximately 525.8 million people. Peakgames, has more than 11.8 million daily active players and 300,000 concurrent users across MENA and Turkey. GGC has always been considered a hotbed of whales, with classification with hardcore games who are dedicated to their virtual identities and sizeable wallets to accompany it. It has been seen that gender difference affect the choices of games, where MMO based games are male-dominated.
In Middle East, the gaming market continuous to grow due to a more structured retail environment, higher bandwidth, investor interest and online payment channels in the game development space. Sony has been continuing to lead the video games industry with the largest value share of 20% in 2015 as the launch of PlayStation 4 boosted sales further. The console was flew off the shelves as soon as it was launched as well as enjoyed a large number of pre-orders. PlayStation has always been a favoured brand and has been marketed strongly in the past two decades, beating Nintendo and SEGA in terms of innovative gaming experiences with unique graphics and features. UAE is set to continue a stable economy and population growth which will also drive a healthy development of video games over the forecast period. The CAGR value of video games in UAE in 2015 was at constant 6% with sales predicted to reach 2.3 billion AED by 2020. (Hanif, 2013)
PS4 and Xbox sales gap has become so big that the publishers start to consider Xbox One market as a minor afterthought that can be safely ignored. In the early 2000, this is what effectively happened when PS2 dominated the console market to the extent where Xbox and GameCube struggles to attract the attention, which is supported by the data which says that PS2 had sold about four times as many systems as Xbox which was launched one year later. A few arguments are there with the current sales gap in between PlayStation and Xbox that the gap isn’t bad for Xbox as it might seem because PS3 user that upgraded to PS4 Pro after previously buying a standard PS4 are effectively double counted by Sony’s units sold numbers which resulted in inflating the total number of potential buyers for PS4. Another argument would be that the distribution of consoles isn’t identical worldwide.
The sales of the raw consoles don’t always line up precisely with the number of “active user” who are continuing to spend money on games and DLC for a console. As said by Xbox Chief Phil Spencer in 2015 that “We’re not motivated by Sony, we’re motivated by gaining as many customers as we can” on this note, it has been seen that the sales of Xbox One has been slightly better than Xbox 360 at this point of it’s product lifecycle. As it can be seen that the PS4 and Xbox One are familiar architecturally, the game can be ported from one console to the other easily without any pain when seen from a technical standpoint. An alternative is to simply ignore the potential customer for Xbox One as it doesn’t make much business sense in most cases. (Mishra, 2014)
3. RESEARCH METHODOLOGY
3.1 Statement of problem
When a customer looks at both the consoles with an intent to purchase one, what are the factors that a drives the consumers towards a console. What variables does a consumer consider before purchasing the console? As per the sales data, it has been seen that Sony PlayStation has always been ahead than Microsoft Xbox as Sony has sold more units than Microsoft Xbox.
In this research, the problem to which we will cater is that “Why is Sony PlayStation a better selling console than Microsoft Xbox?”
3.2 Research objectives
The research objectives are to find the factors, or in other words, find the independent and dependent variables which drives the preference of a customer to develop a positive intent to purchase Sony PlayStation. For example, do they look for performance before buying? Or is it the graphics, or brand name? It can be a single factor or it can be multiple factors which will influence their decision. This research will help in gaining an insight what goes inside the mind of a consumer to which the company targets using their market strategy and how effective their market strategy is.
3.3 Methodology
3.3.1 Research design
The research has been designed in such a way that it will focus on two methods to collect the data and the interpret the data. Two experts in the field of marketing and retailing were approached and questions were asked to them related to the sales and marketing strategy of Sony PlayStation. Their answers gave an insight of the previous market trend and the current trend of Sony PlayStation in U.A.E. Market. Information regarding Target segment, inventories, sales data and figures, market size, marketing strategy, marketing mix were provided by the experts. Other than the experts, a focus group interview was conducted where the candidates were asked a set of questions to which they answered spontaneously in their own way. Their thoughts about the console they own and the other console were recorded and interpreted. They shared their reasons of preferring a video game console.
To collect data for data analysis, a set of 13 survey questionnaire was designed keeping in mind the Demographic, Geographic, Use of product and Need of product. The target were the casual and hardcore gamers based in the UAE region. The response of the questionnaire was collected and then interpreted using a Data Analysis technique – Factor Analysis and Cluster Analysis.
We have considered two variables:
- Independent variables
- Consumer’s decision of purchasing a console based on any of the independent variable
- Dependent variables
- Price
- Performance
- Design
- Exclusive games
- Brand name
- Graphics
- Ease of use.
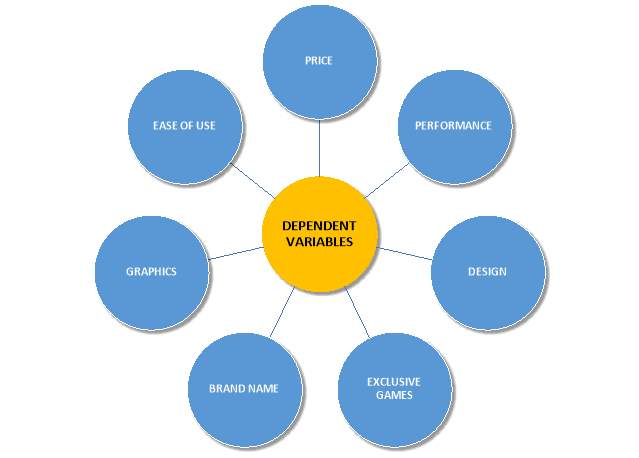
Fig 3.1 Dependent Variables
3.3.2 Data types
Primary Data
- Two experts have been consulted to obtain the insights on current market status of Sony PlayStation in the MENA market. All information right from the sales figures and fact, competitors, Unique Selling Proposition to Marketing mix, marketing strategy of the console. Their valuable insights along with their personal thought based on their past experience and skill have been recorded and interpreted to make the research more interesting and more resourceful.
- Primary data consists of 13 survey questions which focuses on the casual and hardcore gamers from United Arab Emirates region. Below are the set of questions from the survey.
- What’s your Gender?
- Male
- Female
- What’s your age?
- 6-12
- 13-21
- 22-29
- 30 or above
- What’s your occupation?
- Student
- Service
- Self-employed
- Do you play video games on consoles?
- Yes
- No
- How often do you play video games on console?
- I don’t play
- 2 hours a week
- 4 hours a week
- 6 hours a week
- More than 8 hours a week
- With whom do you like to play video games on console?
- Alone
- Friends
- Family
- I don’t play
- Which console do you own or would like to own?
- PS3
- PS4
- Xbox 360
- Xbox One
- Others
- Did it meet your expectation?
- Yes
- No
- What reason drove you to buy the console you own?
- Price (1 to 7)
- Performance (1 to 7)
- Design (1 to 7)
- Exclusive game (1 to 7)s
- Brand name (1 to 7)
- Graphics (1 to 7)
- Ease of usage (1 to 7)
- Would you like to upgrade your console to the next generation console?
- Yes
- No
- Would you like to switch from your current console to a new one?
- Yes – From PlayStation to Xbox
- Yes – From Xbox to PlayStation
- No
- I don’t own a console
- If yes, what reason would it be?
- I don’t like the graphics.
- I don’t like the performance of my console.
- It’s not value to money.
- It doesn’t go with my social status.
- It doesn’t have great exclusive games.
- It doesn’t have good customer support.
- My friends have a different console.
- None
- Other ___________
- If a new gaming console enters into the market, your likelihood to buy?
- 1 to 7 Likert scale
Secondary Data
It contains all the non-peer reviewed and peer reviewed articles. The reports are referred for the insights of the history of the entire video game industry, along with the history of PlayStation and Xbox. Information about the previous market trend, the current market trend and the future market trend is gathered from all the articles. Several peer-reviewed articles are referred related to the video game industry and related to the video game industry and marketing trend in MENA market.
3.4 Data analysis techniques
The data analysis technique which will be used for the research Factor analysis and Cluster analysis. With the help of factor analysis, the dependent variables will be investigated for the relationships with complex concepts. And with the help of Cluster analysis, the data will be interpreted to identify the structures through which we can identify the clusters of the customers which will be based on the combinations of dependent variables. Homogeneous groups can be identified.
3.5 Limitation of the study
The limitation of this study is that through survey data collection, the emotions and spontaneous thoughts in the mind of a consumer cannot be collected or targeted. As survey questions provide limited options to gain an insight about the factors which drive the consumers to prefer a certain brand’s product.
It is not clear through the survey whether the respondents who claim to be a casual gamer or a hardcore gamer are actual in real life. Since there is an ambiguity to this, it is better to perform in depth interview with each respondent to gain clear and valuable insights of the customer, with one on one questions with the respondents.
4. ANALYSIS AND INTERPRETATION
4.1 Data description
Description of the sample: A total of 102 sample, which took the survey from UAE region only went through 13 survey questions. The survey questions were designed to target the main motive behind the drive of customer’s preference towards a console. The sample consists of 64.7% of Male and 35.3% of Female out of 102 sample size. The dominating age bracket in the sample size is from 22-29 which is 68.6% of the sample size, the rest were 25.5% for 13-21, 5.9% for 30 or above and 0% for 6-12. Among the sample size, most were students (70.6%), those in service were 15.7% and self-employed were 13.7%. Most of the respondents enjoyed playing video games with their friend (64%), other than those 30% enjoyed playing video games alone, 1% played with their family and the remaining 2% don’t play video games at all. Out of the 102 respondents, a huge chunk of sample size, 72.5% owns PlayStation 4, second to this is Xbox 360 which lies way behind at 9.8% (Xbox 360 is predecessor to Xbox One which is the latest console in the market.). The third place is a tie in between by PlayStation 3 and Other consoles (Mobile phones, tablets, other handheld gaming devices) with 7.8% each and at last place is Xbox One with 2%. To check on the frequency of their usage of video games console, 39.2% play 2 hours a week which fall under the category of casual gamers, then comes a tie in between non-gamers and hardcore gamers who play more than 8 hours a week (21.6%). 15.7% play 4 hours a week and 2% play 6 hours a week.
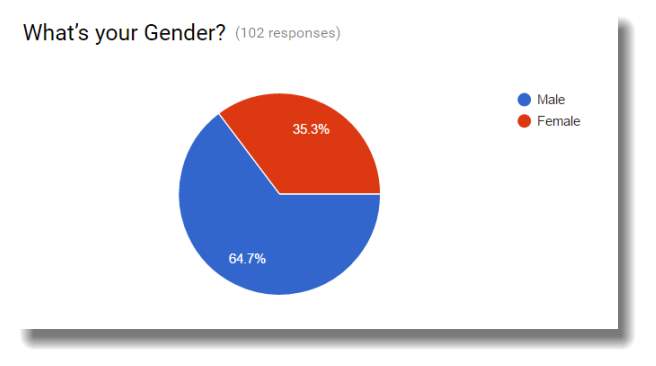
Fig. 4.1 Survey – Gender results
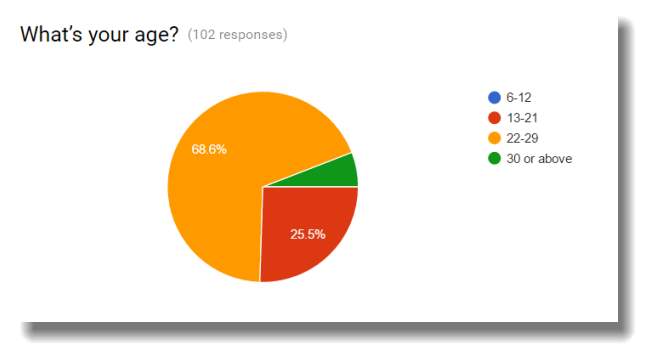
Fig. 4.2 Survey – Age results
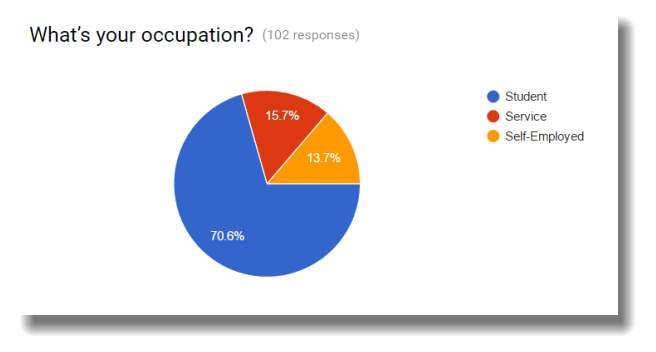
Fig. 4.3 Survey – Occupation results
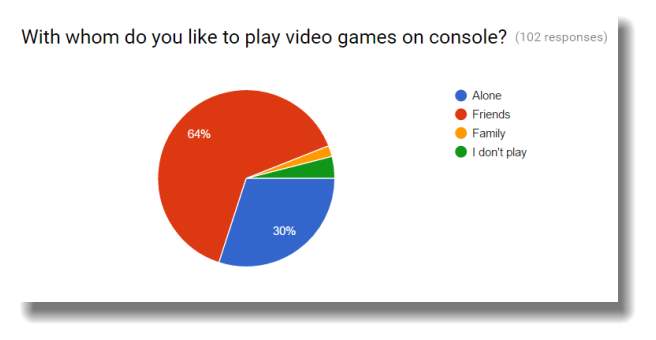
Fig. 4.4 Survey – Community results
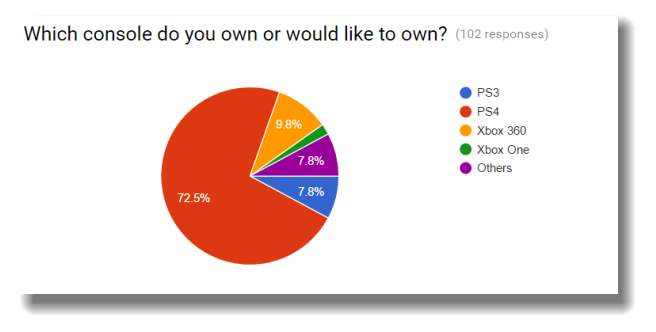
Fig. 4.5 Survey – Ownership results
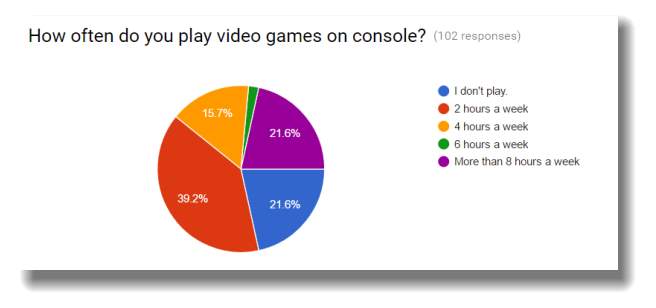
Fig. 4.6 Survey – Game-play in hours’ results
4.2 Data analysis
The survey respondents were asked for the reasons which drove them buy the console that they own currently or would like to own a new console based on those reasons. The reasons are nothing but the dependent variables that have been be considered for the research purpose. The seven dependent variables are as follows
- Price
- Performance
- Design
- Exclusive games
- Brand names
- Graphics
- Ease of use
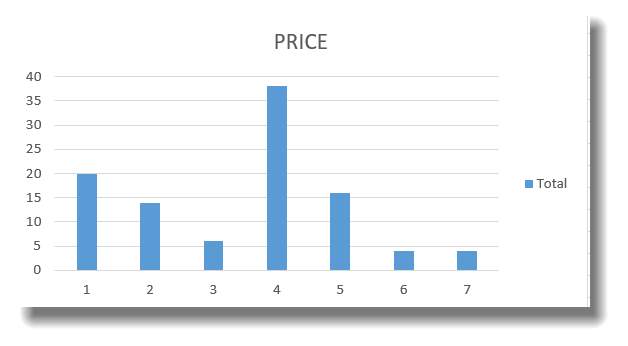
Fig. 4.6 Price graph
| Row Labels | Price |
| 1 | 20 |
| 2 | 14 |
| 3 | 6 |
| 4 | 38 |
| 5 | 16 |
| 6 | 4 |
| 7 | 4 |
| Grand Total | 102 |
Table 4.1 Price
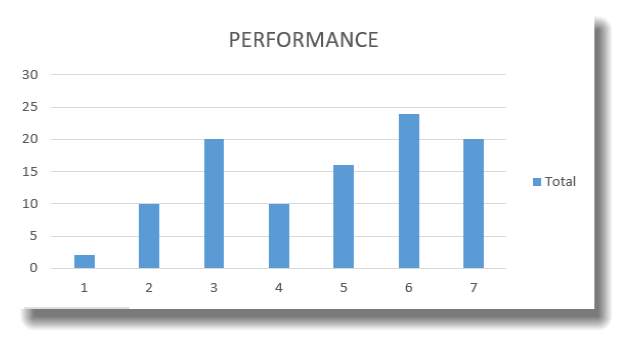
Fig. 4.7 Performance graph
| Row Labels | Performance |
| 1 | 2 |
| 2 | 10 |
| 3 | 20 |
| 4 | 10 |
| 5 | 16 |
| 6 | 24 |
| 7 | 20 |
| Grand Total | 102 |
Table 4.2 Performance
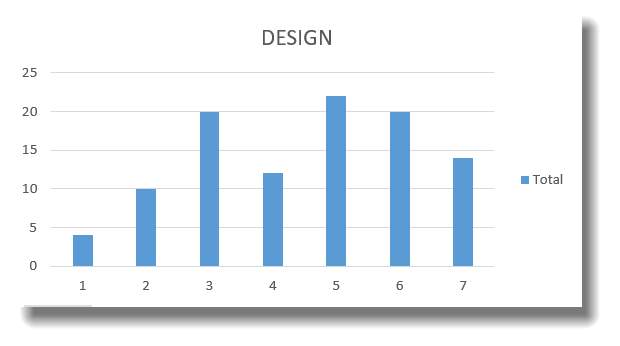
Fig. 4.8 Design graph
| Row Labels | Design |
| 1 | 4 |
| 2 | 10 |
| 3 | 20 |
| 4 | 12 |
| 5 | 22 |
| 6 | 20 |
| 7 | 14 |
| Grand Total | 102 |
Table 4.3 Design
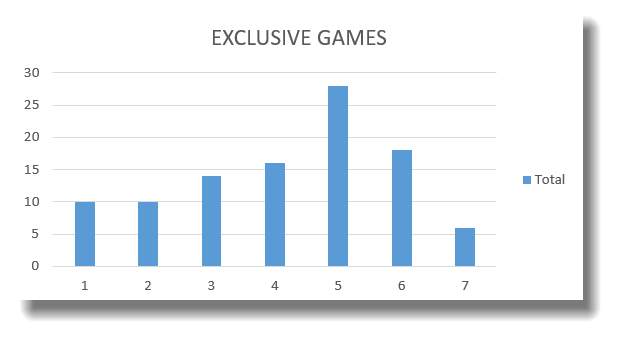
Fig. 4.9 Exclusive games graph
| Row Labels | Exclusive Games |
| 1 | 10 |
| 2 | 10 |
| 3 | 14 |
| 4 | 16 |
| 5 | 28 |
| 6 | 18 |
| 7 | 6 |
| Grand Total | 102 |
Table 4.4 Exclusive games
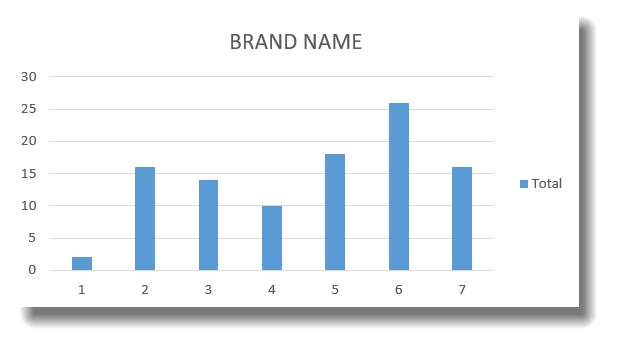
Fig. 4.10 Brand Name graph
| Row Labels | Brand name |
| 1 | 2 |
| 2 | 16 |
| 3 | 14 |
| 4 | 10 |
| 5 | 18 |
| 6 | 26 |
| 7 | 16 |
| Grand Total | 102 |
Table 4.5 Brand Name
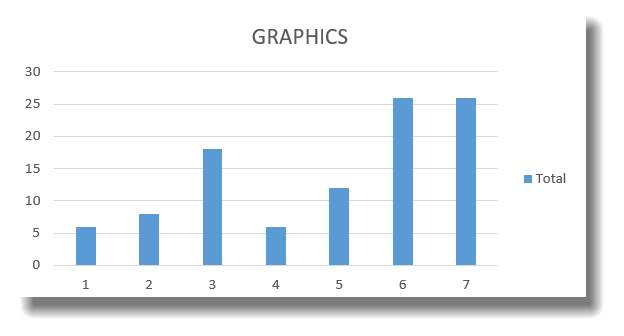
Fig. 4.11 Graphics graph
| Row Labels | Graphics |
| 1 | 6 |
| 2 | 8 |
| 3 | 18 |
| 4 | 6 |
| 5 | 12 |
| 6 | 26 |
| 7 | 26 |
| Grand Total | 102 |
Table 4.6 Graphics
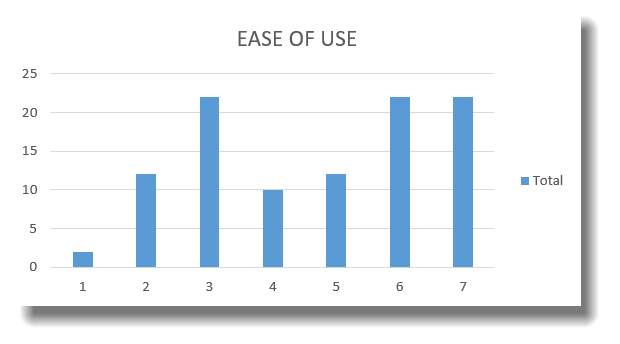
Fig. 4.12 Ease of Use graph
| Row Labels | Ease of use |
| 1 | 2 |
| 2 | 12 |
| 3 | 22 |
| 4 | 10 |
| 5 | 12 |
| 6 | 22 |
| 7 | 22 |
| Grand Total | 102 |
Table 4.7 Ease of Use
Now, let’s analyse all these dependent variables based on the graphs shown above.
- Price – On inspecting the graphs and table above, we can interpret that most of the respondents are neutral about pricing. Price is not a factor which is one of the major variable in driving the decision of a customer.
- Performance – Performance is a major factor, which a consumer looks for when they have an intention of purchasing a console. Performance is a factor which drives the preference of a customer.
- Design – On looking at the graph, it can be interpreted that many consumers don’t feel the need of a great design of a console, whereas others do want their console to have a stylish-futuristic design. Hence, it can and cannot play an important role in driving the preference of a customer.
- Exclusive games – Out of 102 respondents, 58 respondents feel that an exclusive game available for a console is a main factor which drives the thoughts of a customer which changes their attitude and behaviour, preference, towards a console.
- Brand name – Brand name is one of the biggest factors, 60 respondents feel that they look for a brand name which changes their preference. Brand name is vital in building a name recognition and expanding customer database, hence Sony uses Umbrella market strategy, they use Sony as parent name.
- Graphics – Graphics are one of the most important variable, which drives the preference of a consumer. Graphics is one of the most important component when it comes to market their console. Companies are selling their console by marketing them as a Next-generation graphics. Developers have been working hard to make the graphics looks real.
- Ease of use – Other than Graphics, another dependent variable which plays an important role in driving the preference of a customer towards a console is Ease of use. Customer look for non-complicated user interface, where they don’t have to fight with the complexity of the user interface to use all the functions and features of the console.
4.3 FACTOR analysis
For the research, we will use Factor analysis to look for the similar patterns of response of the multiple observed dependent variables because they all are associated with a latent or independent variable. Here, the number of factors are same as the number of variables. Each factor captured a certain amount of overall variance in the dependent variable.
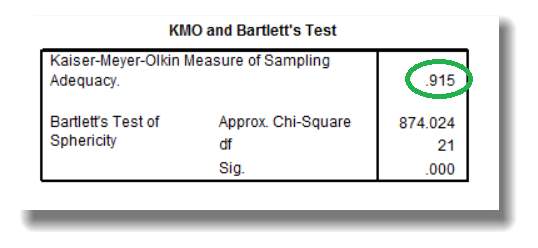
Fig. 4.13 KMO and Bartlett’s Test
The Kaiser-Meyer-Olkin measure of sampling is a way to measure of how well the data is suited for Factor analysis. KMO tests the measures sampling adequacy based on the all the dependent variables used in this test for the model. The value of KMO should be greater than 0.6. Here, in the research, we got the value of Kaiser-Meyer-Olkin Measure of Sampling as 0.915 which indicates that the sampling is adequate. If the sampling value had been less than 0.6, it would have meant that the sampling is not adequate for the research and remedial action should be taken.
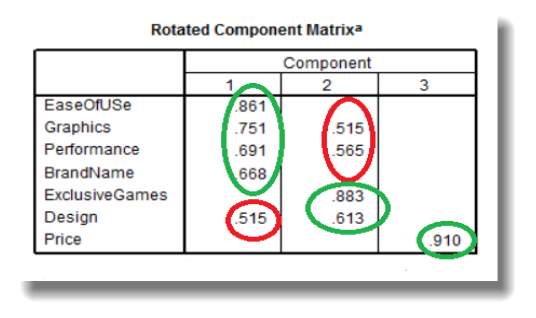
Fig 4.14 Rotated Component Matrix
Since we are clear on the part that our data is adequate, so we move forward to Rotated Component Matrix. The Rotated Component Matrix contains the estimates of the correlation in between the seven dependent variables we used for our research and the estimated component. They display the key output of principal components analysis. As we can see, we formed 3 components for the seven dependent variables. For the 1st component, we chose Ease of Use, Graphics, Performance and Brand name, reason why we chose to add Graphics and Performance in the 1st component is because their value is greater than in the 2nd component. Same reason goes for rejecting Design in the 2nd Component. Now looking at the 2nd component, we choose Exclusive games and Design. For the 3rd component we have only Price with the highest value 0.910. As we have formed the 3 components, we name each component based on the nature of the dependent variables within these components. Hence, the names of each component are as follows:
- Component 1 – Product – contains Ease of Use, Graphics, Performance and Brand name.
- Component 2 – Additional Value – contains Exclusive games and Design.
- Component 3 – Price Sensitive – contains Price only.
4.4 CLUSTER Analysis
Through cluster analysis, we can identify different groups, which have different set of objects which are like each other in a single group, but are different from those sets who belong to the other groups. The clusters formed in the cluster analysis will be treated as on group. To perform the cluster analysis, the set of data was partitioned into the groups based on the similarity and then assigned the labels to the groups.
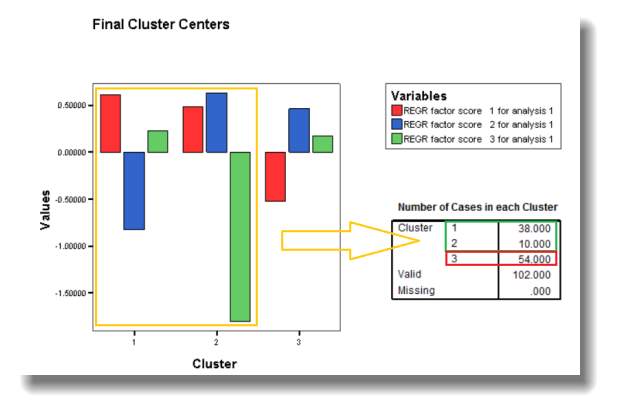
Fig. 4.15 Final Cluster Centers
On looking at the final cluster graphs and number of cases in each cluster table, we see that the three clusters are formed and have different dependent variable in each cluster which is dominating that particular cluster and that single or combination of variable is making that cluster an unique cluster. Analysing cluster 1, we can conclude that the component 1 which is Product, is dominating the cluster 1. Respondents who belong to cluster one are driven through the dependent variables which form the component 1: Product. In this cluster, 38 respondents out of 102, which captures 37.25% of the total sample size. Now analysing cluster 2, in cluster 2, component 1 Product and component 2 Additional value are dominating but the most dominant component in cluster 2 is Additional Value. Among the total respondents, 10 out of 102, which is 9.8% of the total sample size are present in the cluster 2. Cluster 3 has the most respondents among all the three cluster. Cluster 3 has 54 out of 102 respondents which out to be 52.94% of respondent from the sample size. In cluster 3, the only dominant component is component 2 which is Additional value. We can also interpret that the component 3 which is Price sensitive is not at all dominant in all the three clusters, in fact in the 2nd cluster, the third component has been neglected the most. Hence, it is clear to say that, price sensitive customers should not be targeted at all.
The cluster to be chosen out of the three are clusters 1 & 2, because looking at both the clusters as one, they contain 48 out of 102 respondents which come to exactly at 47% of the sample size. Both the clusters together have a majority of the 1st and 2nd component which is Product and Additional Value.
| Row Labels | Count of Gender |
| Female | 14 |
| Male | 34 |
| Grand Total | 48 |
Table 4.8 Cluster 1 & 2 – Gender
| Row Labels | Count of age groups |
| 13-21 | 14 |
| 22-29 | 32 |
| 30 or above | 2 |
| Grand Total | 48 |
Table 4.9 Cluster 1 & 2 – Age
| Row Labels | Count of Occupation |
| Self-Employed | 8 |
| Service | 10 |
| Student | 30 |
| Grand Total | 48 |
Table 4.10 Cluster 1 & 2 – Occupation
| Row Labels | Count of Gameplay in hours |
| 2 hours a week | 18 |
| 4 hours a week | 8 |
| I don’t play. | 8 |
| More than 8 hours a week | 14 |
| Grand Total | 48 |
Table 4.11 Cluster 1 & 2 – Gameplay in hours
| Row Labels | Count of Community |
| Alone | 18 |
| Family | 2 |
| Friends | 26 |
| (blank) | 2 |
| Grand Total | 48 |
Table 4.12 Cluster 1 & 2 – Community
| Row Labels | Count of console ownership |
| Others | 4 |
| PS3 | 6 |
| PS4 | 32 |
| Xbox 360 | 4 |
| Xbox One | 2 |
| Grand Total | 48 |
Table 4.13 Cluster 1 & 2 – Ownership
Both the clusters have men in majority and the age range in both the clusters lie from 22 to 39 the most. Most of the respondents are either university students of young professionals who belong to cluster 1 and 2. These respondents are a mixture of casual gamers and hardcore gamers based on the data of number of hours played. Most of these respondents own a Sony PlayStation 4 and they enjoy playing with friends. Now based on the seven dependent variables, we will do analysis for both the consoles differently based on the data of both the clusters.
| PLAYSTATION | XBOX | |
| PRICE | LOW | LOW |
| PERFORMANCE | HIGH | LOW |
| DESIGN | LOW | LOW |
| EX. GAMES | MODERATE | LOW |
| BRAND NAME | VERY HIGH | MODERATE |
| GRAPHICS | VERY HIGH | MODERATE |
| EASE OF USE | HIGH | MODERATE |
Table 4.14 Cluster 1 & 2 – Overall conclusion
All of the respondents don’t bother about the price range of either of the consoles. Performance for the PlayStation is higher than the performance of Xbox. The performance of Xbox is quite detected as quite low in both the clusters. Both the consoles lack in design of their consoles and are not the factor to drive the consumers to buy the console, it looks like an opportunity for Xbox here. Consumers prefer PlayStation because of the availability of the exclusive games in the market. PlayStation has set their brand name deep into the gaming industry, PlayStation automatically pops up in the mind of the customers when they hear the word game. It is difficult for Xbox to shake their competitor’s brand name. PlayStation has tie ups with Nvidia and AMD Graphic card manufacturers who are pioneers of the graphic card industries. Xbox is moderate because it depends on their in house graphic cards which is not their core competency. Respondents find PlayStation to be quite easy to use than Xbox because Xbox has a clumsy user interface and confusing menus.
5. CONCLUSION
5.1 Recommendations
Recommendation results in implementing marketing implications based on a strategy in effect which will bring in the desired changes. These changes depend on the goals or objectives set by an organization, which can be changes or improvement in sales, in process, in marketing strategy, in supply chain and other areas having potential of improvement. An organization should be ready for all sorts of outcomes when implementing a marketing implication as they can be either positive or negative.
To increase their sales and brand reputation in the gaming industry, a few recommendations will be provided to Xbox. First, Xbox should work on their performance of the console. To do this, they should hire more experienced and skilful scientists which will help Xbox in improving their hardware specifications, like GPU clocking, CPU clocking, Graphics card, Processor, Signals and sensory systems, frame rates, shadow scaling and other hardware and software related innovations or improvements. Through this, Xbox can claim to be the next generation console and be ahead of PlayStation in terms of Hardware and Software.
Since we noticed through our data analysis that both the designs lack in design, Xbox should take this as an opportunity and get serious on designing their console to give a look of what their customer wants. For example, if the customers want a design which gives them a feel of “Out of the world” or “Alien object”, they should hire designers which speciality in the following genre to design their console which gives their customers a different unique feel and experience.
One of the major reason for the success of Sony PlayStation is that they have an in-house game production company which develops games exclusive for PlayStation owners. The customers who own a PlayStation will only have an access to these games and others who don’t own a PlayStation cannot play this game on any other console. To make this more interesting, Sony has open source gaming communities, where Gamers give them ideas or even work on an open source game to suit their preference. Hence they make tailored games based on the needs and requirements of their customer.
In the same way, Xbox should start open source gaming community, like Sony PlayStation and develop tailor made games for their customers. Sony has a great relationship with Nvidia and AMD graphic card manufacturers, similarly it is recommended to Microsoft to tie up with “MSI”, “ASUS” or “ZTI” Graphic card suppliers and manufacturers to stay on top of the game when it comes to graphics. Because these graphic card manufacturing companies are rivals and would want their graphic cards to be the best, hence Microsoft should tie up with them and push them harder to deliver top quality and next generation product.
This will help in increasing the reputation of both Microsoft Xbox and the graphic card manufacturing company. It will be a win-win situation. Since they have positioned Xbox as a family gaming console, per the survey, 1% respondents play with their family whereas 64% play with their friends and 30% play alone. So Xbox should re-position their console from a family gaming console to a console on which you can play with your friends or against your friends. They should position it as a console which strengthens their friendship if they play Xbox with their friends. Add multiple multiplayer games which allows friends to play online or on Lan with their close friends as a team or against each other. Microsoft has been working on a breakthrough device called Microsoft HoloLens. Microsoft HoloLens is a mixed reality smart glasses which works under Windows 10 OS. It is used to multiple augmented reality applications and would be recommended to Microsoft to bring in HoloLens in to the gaming industry to make their games more immersive and realistic as it would give the gamers an out of the world experience since they would see the world in the game right in front of the eyes surrounding them in their room.
Recommendations for Sony PlayStation as per the data, design of both the console is not great, Sony could as well try to improve their design by making it look more attractive and unique using the recommendations given by their customers through open source communities. Sony should work more on their in-house gaming production as there are only few exclusive games releases in a year.
To maintain or increase their hold on the market share of gaming industry, they should increase their production house, add more teams and try to work on releasing more unique and next-generation graphics exclusive games titles to attract more and more customers. Make the availability of exclusive games as one of the major factors of driving the preference of customers towards Sony PlayStation. Since as per to the current market would be to firstly reduce the price of the PlayStation 4 Pro, since the price of the latest Xbox One S is less than the PlayStation 4 Pro. This will affect the sales of the latest Sony console.
5.2 Conclusion and key learning
Through this research, we get to know the insights of the customer which drives their preference or choice of a brand. The two branded products, Sony PlayStation and Microsoft Xbox have been rival for years. They are in a battle which is being fought for years and as it looks like it will be fought for many years to come. Both the companies are trying harder to attract customers towards their console and make them loyal to their console only. They are doing it by providing them the social status, brand names, exclusive games, next-generation graphics, unbelievable hardware specifications and what not. These companies are going out of the way to make their customers satisfied. But still there is something missing in the strategy of Microsoft Xbox which results in their lack of hold on the market share. Sony PlayStation is still winning over Xbox. So through this research we have concluded what were the main strengths and weaknesses of each console, where it needs to improve and what are the other strategies that they should adopt in order to gain more market share in the gaming industry.
5.3 Future scope of research
This research has quite a lot of opportunities for further research. Since through this research we have only captured the insights of the customers through a survey with limited and designed answers, failing to capture the real spontaneous thoughts of the customer. This research can be taken further using ZMET. Through ZMET, which is Zaltman Metaphor Elicitation Technique, we can capture both conscious and unconscious thoughts of the customers by exploring their metaphoric or non-literal expressions. We can capture the hidden thoughts or unconscious thinking of the customer. This can be done by asking the respondent to look at the collection of pictures and represent their thoughts and feelings on it. The goal of this research would be to uncover the relevant fundamental structures which guides the respondent’s thinking about the console.
Cite This Work
To export a reference to this article please select a referencing stye below:
Related Services
View all


Related Content
All TagsContent relating to: "Video Games"
Video games are an electronic form of entertainment, typically played on a console, computer or other type of machine. Video games can be enjoyed by people of all ages regardless of interests, with games covering a wide range of genres.
Related Articles

DMCA / Removal Request
If you are the original writer of this dissertation and no longer wish to have your work published on the UKDiss.com website then please: