Co-op Software Tester for Nokia- Network Functions Manager for Packet
Info: 9340 words (37 pages) Dissertation
Published: 9th Dec 2019

Summary
The Network Services Platform (NSP) is a software product for IP/MPLS management under which the Network Functions Manager for Packet (NFM-P) is an important module. It enables end-to-end network and service management across all domains of the converged, all-IP network–delivering unified operations, whether network services are running in a virtualized environment or on specialized hardware platforms. This NSP module helps service providers quickly maximize operational efficiencies through fast provisioning and troubleshooting, proactive assurance, and flexibility that eases integration into the network. In addition, visually insightful approaches to network and service management, deliver enhanced network operations tools for meeting next-generation network assurance challenges, such as for Virtual Network Functions (VNF) assurance [1].
Tightly integrated within the NFM-P module, the Control Plane Assurance Manager (CPAM) provides unprecedented visibility into the dynamic multi vendor IP/MPLS routing plane. Turn-key service portals are also optionally available to provide enhanced customization for the NFM-P module. And to speed IT/OSS (Operations System Support) deployment and simplify integration into the network, the NSP[13] pre-certifies application interoperability with leading vendors in OSS fault management, performance and SLA management, inventory, network planning, offline traffic engineering and more [1].
Main benefits of SAM/CPAM deployment are that fault correlation and troubleshooting tools show impacted services and the root cause of problems, service assurance capabilities enable performance management and SLA reporting, script management and GUI design tools plus custom workflow builders simplify integration. It also helps reduce time-to-market and increases flexibility when launching new and advanced services and enables better operational fit to customize to existing operations environment and leverage current OSS/BSS investments.
As required for any software product, software testing is necessary to point out the defects and errors that were made during the development phases. It’s essential since it makes sure of the customer’s reliability and their satisfaction in the application. There are numerous teams here on campus at Nokia that carry out testing for different domains of the SAM/CPAM software. There are more than 60 teams each have their own test branch to carry out testing and they find bugs and fix them. Each team faces different issues and they try to resolve those issues before the software is released to the customers.
This report will cover, in detail, information about Nokia and its role in the telecommunications industry. It will describe my duties and responsibilities of the position of Software Tester during the work term. Some major components include an overview of the main project involved and my experience in an agile scrum team environment. Furthermore, this report will include an analysis of the general nature of the work, challenges encountered and their solutions, and my contributions made to the company. The reflection portion of this report compares the knowledge that I have gained throughout the term to my academic studies (i.e. which courses and skill helped me succeed in tasks assigned to me).All relevant material will refer to multiple appendices located at the end of the report. These include visual elements along with a detailed description of them. There will be multiple usages of abbreviations and acronyms throughout the report, so a list is provided at the end as well.
Table of Contents
3. Duties and Responsibilities
3.2.1 Lab Context and Production Context
3.2.2 Test Automation through XML
a) Scrum Regression Overview [4]
b) CVS Repository and Ossi_Testlab[5]
c) Script Development and SAM API[5]
4.1 Functional Regression Test Bed
4.2 Design Verification – BGP Feature Testing Framework
5. Issues and Challenges faced
6. Personal Reflections / Observations
7. Learning Objectives Revisited
1. Introduction
This report will provide the reader with an insight of how the work experience was at Nokia. The purpose is to illustrate as closely as possible, what it may be like if the reader were to be in the position of Software Tester for Nokia, working on the NFM-P application. Some major components of this report include description of the main objectives for the position, the challenges encountered, as well as their solutions. The reflection portion encompasses the lessons learned during the work term, contributions made to the team/company, any relations to academic studies, and how this co-op experience influenced future study and career goals.
The structure of this report can be summarized as below.
- Section two introduces the background of Nokia
- Section three describes my job duties and responsibilities
- Section four describes my testing projects in detail
- Section five provides personal reflections and observations
- Section six revisits the learning objectives that had been set up at the beginning
- Section seven makes some recommendations to the employer and program of study
- Section eight concludes the report
1.1. Organizational Context
Nokia is a leading corporation specializing in the field of telecommunications and information technology. Their main headquarters is situated in Espoo, Uusimaa, in Finland, and offices/Research & Development centers span worldwide, including Ottawa (Kanata). With the recent acquisition of Alcatel-Lucent in January 2016, Nokia was able to control the management of the company, developing networking products and solutions for various mobile and enterprise service provider networks [2]. This alone strengthened Nokia’s brand significantly, since enormous telecom operators like Bell, Verizon, and AT&T are some of their main clients. Competitors of Nokia include Ericsson Canada Inc, and Huawei Technologies.
The main focus for this co-op work term was to work with the Quality Assurance team for the Service Supervision web application. This web application is a module within the Nokia Network Functions Manager for Packet (NFM-P) application. It presents the customer with a user-friendly graphical user interface (GUI) in which they can monitor all of their IP objects using concepts such as ‘summary views’ and ‘supervision groups’. The customer can troubleshoot problematic services using the many tools provided by the app, such as Key Performance Indicators (KPIs), Operation, Administration, and Management tests (OAM), and more. Further details about the Service Supervision App will be covered later on in this report.
The reporting structure/hierarchy for this work term is as follows – the QA team lead Kwesi Nkansah, acted as the supervisor during the work term, thus he was always aware of the co-op software tester’s activities and tasks. Status and/or completion of a task were always reported to Michael at intervals of 2-3 days. Jelena Krstic manages multiple QA teams, including Service Supervision, so any required reporting from Service Supervision QA was to be reported to Jelena, usually done by the QA team lead.
2. Employer Background
2.1 Overview
With the acquisition of Alcatel-Lucent, Nokia is a global leader in the technologies that connect people and things. Serving customers in over 100 countries across the world, Nokia is driving the transition to smart, virtual networks and seamless connectivity by creating one, single network for all services, converging mobile and fixed broadband, IP routing and optical networks, with the software and services to manage them seamlessly [8]. Since the sale of its mobile phone business, Nokia began to focus more extensively on its telecommunications infrastructure business, marked by the divestiture of its Here-Maps division and its foray in virtual reality industry, and the acquisitions of the leading French telecommunications company Alcatel-Lucent and digital health maker Witlings in 2016. [6][7] From early 2017, Nokia’s name will return to the mobile phone market through HMD global.
2.2 Work Environment
As an organization within the IT industry, the work environment is fast-paced and innovative. All my colleagues in my department are working really hard to ensure the success of each release of Nokia product. For our co op students, we have a big special room just for us, and it is actually really nice because it creates an opportunity for me to communicate with the other coop students from different universities.
2.3 Products and Services
There are two main products in my department (IP/Optical Networks-Network and Service Management) which are the 5620 Service Aware Manager (SAM) and 5650 Control Plane Assurance Manager (CPAM). The 5620 SAM, proven with more than 500 deployments globally, delivers powerful capabilities that simplify operations of IP Core, Wireless, and integrated IP/Optical networks. On the other hand, tightly integrated with the 5620 SAM, the 5650 CPAM is a multi-vendor route and path analytics solution to deliver unprecedented real-time visualization, surveillance and troubleshooting for dynamic IP/MPLS networks [9]. For this coop term, I am working for the CPAM team.
3. Duties and Responsibilities
3.1 Background
The following duties are performed as part of the Software Tester.
- Development of scripts or applications (XML) to simulate various management activities and network scenarios
- Development and execution of test plans to validate functional aspects of the product
- Monitor and maintain automation regression runs for Errors, Exceptions, and Trace Error Alarm etc.
- Investigation of product defects encountered during test scenarios;
- Execute the test scripts to reproduce the test errors found during the Automation runs
- Create PTS (Defect) for any error, exception found related to automation script, network environment, GUI, Nodes behavior etc.
- Testing of various features on different network nodes to validate the functional aspect of the features
There are different regression test beds (RTB’s) that are tested daily as part of automation regression runs. Functional Regression Test bed is one out of these RTB’s. The Primary task is to look into Functional Regression every day to monitor it for different Errors, Exceptions, differences etc. If any error is found, then a detailed investigation happens as to verify whether the error is a real issue and raise a PTS (Problem tracking system) in case it appears to a real issue. Sometimes, the error seems to be a script error and it requires the XML script to be changed and pushed onto the production to reflect the changes.
3.2 Testing Environment
3.2.1 Lab Context and Production Context
Before each release of SAM/CPAM software can be delivered to our clients, we have to ensure that all features in that particular release work nicely and fine in our production context. Both of the lab context and production context consist of all kinds of nodes, which actually are different types of network objects such as routers. When I manually test the features I am responsible for locally in my SAM/CPAM client, I use lab context rather than production context by discovering lab nodes into my local testing environment. On the other hand, for the development of testing automation framework, lab nodes will be used for the testing run before all newly-developed automation frameworks can be deployed onto the production nodes. A sandbox virtual network consisting of all router nodes that will be used for testing purpose is set up by the virtual SAM server which is being pointed by my local SAM client. The whole network is monitored by a special static router called Control Plane Assurance Appliance (CPAA) which is essentially a route listening and route processing hardware device that non-intrusively participates in routing plane signaling.
3.2.2 Test Automation through XML
a) Scrum Regression Overview [4]
Scrum Regression is a framework that provides provision to add different tests into a common framework, run the tests and receive the detailed result.
Automating a feature requires creation XML/CLI scripts which consist of creation, modification, deletion scenarios for the classes respective to the feature.
- High Level Workflow
- Scrum Network
The team can design and create a network based on the network topology that includes predefined number of network simulators for Test Automation.
- Script Development
This includes creation of script for the feature and adds to the CVS repository.
- Test Execution
The entire test created and added to the CVS can be executed with the help of the interface.
- Result Analysis
After all the tests are executed, results for each test are generated and can be viewed with the help of the interface.
- Network Topology
Each Team is allotted a predefined number of simulators (nodes) and then these nodes are interconnected to form a network. For example, “Topology A” defines a network of 4 interconnected nodes [12] with the below node types.
| Node A | 7750 | SR-12 |
| Node B | 7450 | ESS-12 |
| Node C | 7710 | SR-c12 |
| Node D | 7750 | SR-12 |
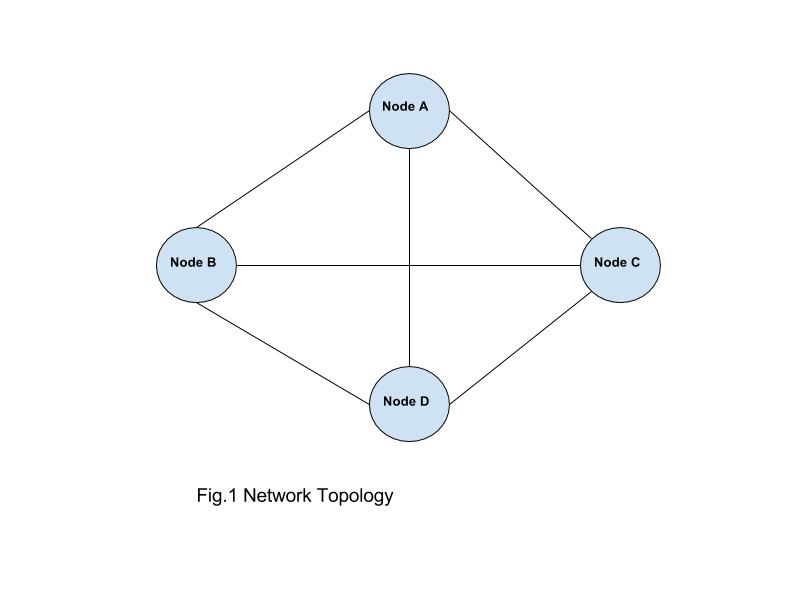
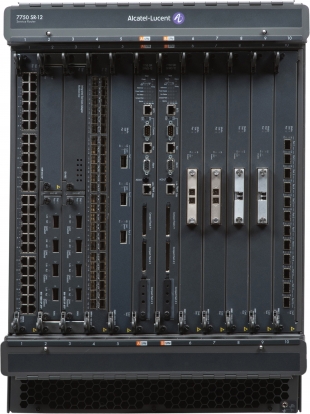 Fig.2 7750 SR-12 Node by Nokia [11]
- XML Root Context
XML Root Context file consist of different node elements in the network topology with different attribute variables and values like system IP, IP address, type, Mode, release, version etc. The login information for the network is also mentioned in this file.
- Test Execution
After writing the scenario and templates files that form the new test, it is important to execute the test “locally” prior to checking the new files into CVS. The local run will not cause changes to the SAM server or nodes, rather its purpose is to verify the syntax. Xml and CLI files are generated successfully and adhere to the conditions set in the scenario files. To execute a local run open a command terminal in Windows, navigate to the checked out version of ossi_testlab module and run “execSandbox.bat” with the required parameters. You will have to setup the SAM_HOME environment variable prior to running execSandbox.
CVS [5]
Once execSandbox shows that the test(s) has executed as expected, proceed with checking the files into CVS.
A script called pollCVS runs every 15 minutes to verify that the newly checked in scen and template files are acceptable (execSandbox). It will send an email to the user who submitted the files letting them know whether their files “Passed” or “Failed”. If the files are acceptable the new test will now be available for execution by the automated regression framework. If the files fail the verification by pollCVS, then they will still be present in CVS but the automated regression framework will not run them. This explains how newly submitted scripts can be seen in CVS but are not available for execution by the framework
- Results
Upon completion of the test run a summary of the results are sent via email to the scrum team member who launched the run. The email is also forwarded to the scrum owner and the regression team. The email contains details of the number of Passed, CLI Failures, Deployment Failures, Skipped and Total Tests.
Also included are server log exceptions that have been parsed from the EmsServer.logs after the run. It is important to look at the exceptions in this list because it provides a quick way to catch errors such as Null Pointer, ClassCastExceptions etc. The email also includes a link to the Results webpage that shows a more detailed view of the test results.
The webpage initially loads with a filtered view of only failed test cases
To see all the test cases remove the filter by clicking “Show all results (Clear all filters)” at the top of the page. Tests are listed according to the order in which they were executed.
The name of the tests consists of the “testId’” assigned to them in the Scenario files
The following links are available for each test that was executed in the run:
Req – Request: The XML Request sent via OSS to SAM.
Resp – Response: The Response sent by SAM to the XML request
Verif – CLI Verification: The CLI that will be executed on the node to verify changes made by the Request.
Res – Result: The result, PASS or FAIL of the CLI verification
At the bottom of the results page is information regarding the nodes that the tests were executed against as well as other important links.
The XmlRootContext file link shows the “updated” rootContext file that the tests were executed against.
The AutoRunnerLog link shows a log of the entire run. It is useful to look through when troubleshooting errors with the run (e.g. failed node discovery).
Below is an example of a Failed Test
The error could be caused by either an exception thrown by SAM or a CLI verification error. In this example it was an exception in SAM which can be verified by clicking the Resp link. In this example the test failed due to an error during CLI verification. Clicking the “Res” link will show which specific verifications failed.
- GUI Test Framework
Test framework is used to test various scenarios and test cases by executing them locally that includes whether
- Network nodes are configured properly
- Nodes are connected to each other and responds correctly to a particular request
- Routing protocol techniques
- Different services like tunnel management, VLL, VPLS etc are working as expected
- Ports are correctly configured with different equipments
Test framework can be launched using the file “runGUI.bat” that comes with the Ossi_testlab folder fetched from the CVS repository. It requires including the RTB folder on which testing is to be performed and also the Root XML context file that has all the configurations about the network nodes to be used for testing.
There are two ways to provide the setup for test framework
- Open the runGui.bat file in an editor and edit to include the path for the RTB folder and Root Context file.
- Run the runGui.bat file using the command line and enter the path of the RTB folder and Root Context file on the popup screen displayed
Once the setup is completed and the runGUI.bat is launched with the command line, Test framework window is displayed with all the test cases that are present in the RTB folder. User can select the test module that needs to be tested and click submit. All the test cases in that test module will start executing automatically in proper order and the status for each test can be seen in the command window running. After each test is completed executing, the corresponding result is displayed in the buttons Req, Resp, Verif, Res.
Req – Request: The XML Request sent via OSS to SAM.
Resp – Response: The Response sent by SAM to the XML request
Verif – CLI Verification: The CLI that will be executed on the node to verify changes made by the Request.
Res – Result: The result, PASS or FAIL of the CLI verification
This is how different test modules are executed and results can be viewed for each test running. Thus helping the tester to evaluate whether the tests are passed or failed and if the tests are failed then the Resp for that particular test can be viewed to find out the reason for the failure.
The regression framework infrastructure provides the ability to add tests into a common framework in Nokia and execute the tests via a web based tool and receive detailed results via email. There are many scrum teams within the organization. Each scrum team adds tests to the framework and all tests are organized by network and each team has their own network regression test bed (RTB).For this term, I work on RTB. Basically, every team has their own RTB which is a collection of test cases to be executed on the production nodes or network. Any new test written is first added to the local IDE.
I worked on Intellij as my team worked on it. After adding the tests into the framework, an email is sent to the team members indicating that new tests were successfully added. For the daily test execution (normally three times every day), the result of each run will be sent back to the team members in the form of an HTML formatted email [7]. We keep a track of the tests that pass and fail through the results sent in these emails. The tests that fails are to be fixed first and the tests are run again to check if the tests that failed previously are passing now once fixed. These tests happen regularly every day and we keep getting results for them regularly. [I1]
b) CVS Repository and Ossi_Testlab[5]
- Introduction to the ossi_testlab Module
Ossi_testlab is basically a module where all the Regression tests are placed and it is possible to change these XML scripts at any time in a format that supports the scripts to be reused to execute different tests.
This module consists of XML request files that are send to the 5620 SAM server by utilizing XML/SOAP SAM OSS client. CVS is the repository from where ossi_testlab can be downloaded to the local.
- Structure
The ossi_testlab module comprises of the following files and directories:
Executions: Directory that contains the results for the last run. The previous results are erased after each run.
Cli: It consists of the scripts that are used for validation.
Results: It contains the results for the CLI Verification.
Lib: It consists of all the library files required to run different tools
XML: Contains the XML request files sent to the server and XML response files received from the server.
Rtb → templates: This is the directory that contains the XML and CLI template files. The XML template file consists of the operation that needs to perform and uses variables that are replaced by values passed. CLI verification file consist of commands to verify the operations that are performed on the product have actually been executed correctly.
Rtb → scen: It consists of the different collection of scenario tests which calls the tests defined in template file
runTest.bat: This is command line interface executable file to run the Test Framework.
runGui.bat: This is graphical user interface executable file to run the Test framework.
defaultXmlRootContext.xml: This is the config file that contains the different variables declared, different network nodes against which test should be run etc.
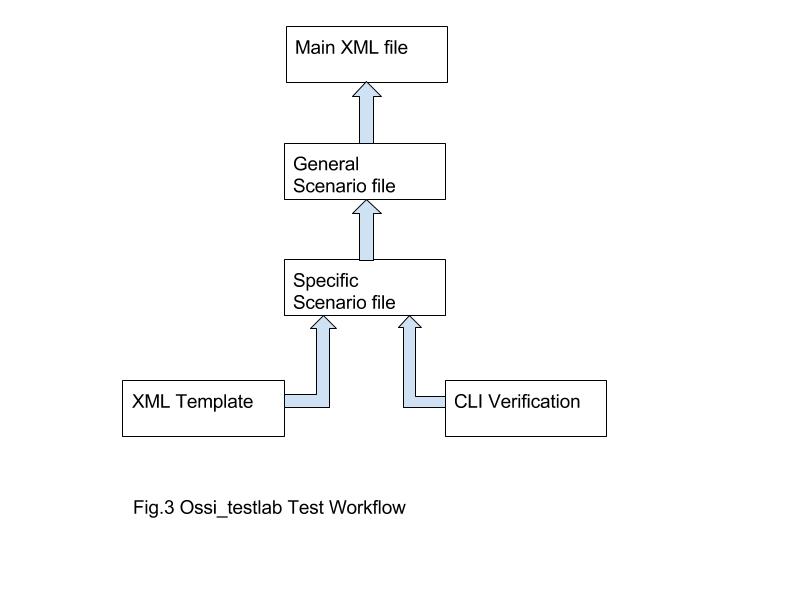
- Workflow
Step 1: Create XML template
Step 2: Create the corresponding CLI verification file for the XML template
Step 3: Tests are created by combining elements of (1) and (2) to form sequence of scenario tests.
Step 4: Different functional areas like services, policies consist of general scenario file that is linked to the above scenario tests. In some cases, this step is not required and element (3) is directly linked to (5).
Step 5: Finally, the general scenario file is linked to Main.xml file
- XML Request Template
XML Request Template has the following structure.
<?xml version=”1.0″ encoding=”UTF-8″?>
<SOAP:Envelope
xmlns_SOAP=”http://schemas.xmlsoap.org/soap/envelope/”
xmlns_xsi=”http://www.w3.org/2001/XMLSchema-instance”>
<SOAP:Header>
<header xmlns=”xmlapi_1.0″>
<security>
<user>$login-user</user>
<password>$login-password-md5</password>
</security>
<requestID>client1:0</requestID>
</header>
</SOAP:Header>
<SOAP:Body>
<generic.GenericObject.configureChildInstance xmlns=”xmlapi_1.0″>
<deployer>immediate</deployer>
<synchronousDeploy>true</synchronousDeploy>
<distinguishedName>Parent Name</distinguishedName>
<childConfigInfo>
<packageName.ClassName>
<actionMask>
<bit>create</bit>
</actionMask>
<!– Object configuration added here –>
<serviceId>$serviceId</serviceId>
<children-Set>
<!– configuration of the children objects is done here –>
<childObjectPackageName1.ChildObjectName1>
<actionMask>
<bit>create</bit>
</actionMask>
<!– configuration of child object ChildObjectName1 –>
…
…
</childObjectPackageName1.ChildObjectName1>
<childObjectPackageName2.ChildObjectName2>
<actionMask>
<bit>create</bit>
</actionMask>
<!– configuration of child object ChildObjectName2 –>
…
…
</childObjectPackageName2.ChildObjectName2>
</children-Set>
</packageName.ClassName>
</childConfigInfo>
</generic.GenericObject.configureChildInstance>
</SOAP:Body>
</SOAP:Envelope>
The header section in the above template defines the variable for login username and the password which are referenced in the Default XML Root Context file.
The body section declares the method to be used to perform the request operation. In the above sample example, configureChildInstance is used. The parameters <deployer> denotes whether to deploy the request on the object immediately and <synchronousDeploy> denotes whether to continue the request until the request have been deployed correctly. The <distinguishedName> segment tells the server which object to be modified. The configuration of the objects is completed on the tag <childconfigInfo> for example ospf.site. This is achieved by changing the <actionMask> state.
<actionMask>
<bit>create</bit>
</actionMask>
or
<actionMask>
<bit>modify</bit>
</actionMask>
If the XML request fails to perform the operation on the object, then the server will respond with an error as to why the request is unsuccessful and a corresponding RESPONSE file will be generated. After the completion of the XML template, corresponding CLI verification template is created to check whether the request is correctly deployed on the object.
#SETUSER:$node-user
#SETPASSWORD:$node-password
## Now, we check that the Dgd Service has been created:
#INFOCHECK:$node-current-ip:configure service: dgd $serviceId customer $customerId create:PASS:The DGD service $serviceId has been created.
The first two line define the username and password to be used to login into the node. The #INFOCHECK will fire a info command on the particular object attribute and verify the service have been created. If the command is executed successfully with the correct match, then it will return PASS or else FAIL will be returned and corresponding RESULT file will be generated.
c) Script Development and SAM API[5]
The networks or sandbox regression test beds (RTB’s) are named “rtbxx” where xx is a number corresponding to the scrum team. ossi_testlab is the module where all the Automated Regression test scripts are kept. It can be downloaded through CVS. The ossi_testlab application supports Velocity, which means that it is possible to transform XML requests with hard-coded values into flexible templates that can be reused to run multiple tests. The ossi_testlab module sends those XML requests to the 5620 SAM server by using the XML/SOAP 5620 SAM OSS client. All new tests should be added under the scrumRegression directory within the module. There is doubtlessly the testing scripts are the center of the whole structure. It includes looking at the Ossi_Testlab module in the CVS and including the robotized tests (XML/CLI code) straightforwardly into CVS. One essential element of the XML documents in the CVS is Velocity, which implies that it is conceivable to change XML asks for with hard-coded values into adaptable layouts that can be reused to run various tests. To discuss data with the server, the XML data set is organized utilizing SOAP. The XML scripting dialect has its own special API. Each time while managing the XML scripts, a proper reference is to made through this API. The SAM API has comparable structure as Java API, for example, bundles, classes, objects, properties, strategies, legacy and so on.
4. Testing Projects
4.1 Functional Regression Test Bed
● Introduction
Functional Regression Test Bed is one of the test bed that includes different functionality to be tested on different network topology. Each RTB has its own functional tests to be executed on different networks that it consists of. The network present in this RTB is divided into two main areas.
Network – It consists of different networks that include all the tests related to Functional Regression.
Sanity – It consists of different networks that include a part of the Functional Regression tests.
● Galvatron
Galvatron is a web portal internal to Nokia company which is designed to display the Automation results for all the networks that are running on different branches daily. The galvatron captures all the results from the automation runs and displays it on the portal in such a manner that the results can be analyzed properly and it’s easy to the user to go through results properly. It acts as a center point for all the results thus providing an intelligent way to determine which networks are running correctly and which networks have issues. Let’s look into the different features and functionality that this web portal offers.
○ Automation Results
There are different regression test bed’s with different set of network topology consisting of different network nodes and these regression test bed’s execute test modules with different functionalities, services, equipments, ports etc. When a galvatron web portal is launched, there is an option to select the RTB for which the automation results to be viewed. On selecting the Functional Regression from the list, the results are displayed for different networks in this network. Below is the sample display of how the results look on the galvatron portal.
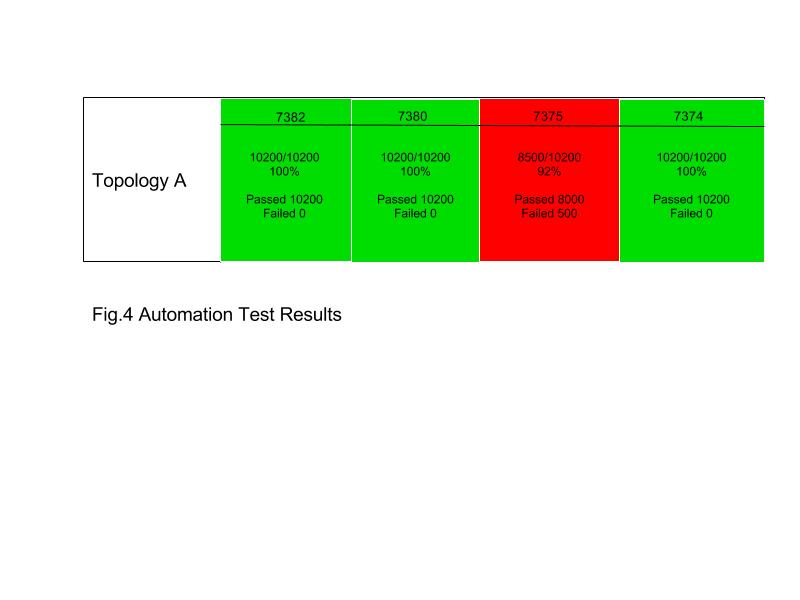
Topology A defines a specific network wherein set of network nodes are connected to form a network. Similarly Topology B is another network with different set of node elements connected in different fashion. Likewise, there are ample amount of networks formed for which the tests are run and results are imported to galvatron. The above sample result shows 4 different runs for Topology A that are happened with run 7374 executed first followed by 7375, 7380, 7382. Each run displays the following details:
Load: Load is the build number of the SAM on which test is to be performed. Example – 7382
Number of Tests: This field shows the number of tests that are executed out of the total number of tests present.
Test Percent: It displays the percentage of the number of the tests executed.
Passed: This field shows the number of tests passed.
Failed: This field shows the number of tests failed.
Date/Time: It displays the date and time when the run started to execute and how long it took to execute the total number of tests.
With the help of above details, it becomes clear that which runs are failing, how much tests are passing for all the runs, which build version is having issues etc. If the runs are continuously in red for more than three to four number of times for the same network topology then it means that there is error that needs to look upon and investigate for the same network. If the runs are randomly displaying red or green status then it can be predicted that there may be a network issue or node issue. After collecting these details, more can be digged about the runs that are displayed in Red by just right clicking on the run and following options will display.
Test Errors: This option will display all the errors that occurred with the run one below the other. The errors are divided into two categories – New Errors and Existing Errors. New Errors are the errors that are newly occurred and have not seen in the previous runs while Existing Errors are the errors that are existing ones and have seen in the previous runs. Each error displayed has the Request file, Response file, Verification file and Result file which will show the root cause of the error and also the log file which will show the detailed operations happened along with the issue caused before and after which operations. If the error has already been investigated with a corresponding ticket raised, then the ticket number is added to that error. With the help of the Response output from the server and the verification output, decision can be made as to what the issue is all about.
Test Results: This option will display the results of all the tests that are executed. The results can be viewed as part of different categories.
All Results – It will output the result of all the executed tests.
Passed Results will show the passed tests results.
Failed Results will display the failed test’s results.
Results are displayed in a hierarchy pattern with module result overview first and then on navigating to that module will display the results for all the tests executed for that particular module. Each Result has the following fields.
Date/Time: It displays the date and time for all the tests.
Res: It shows the response generated from the server.
Result: This field displays the verification result.
Network node: This field will display the tests passed/failed for all the nodes available for the Network Topology.
Exceptions: Exceptions are unwanted events that occur during the execution. This option helps to see all the exceptions that trigger during the tests execution. It displays the description of the exception, log file, date and time, number of times the same exception is occurred. These exceptions are analyzed and investigated to come to a decision whether they are real issue or have no impact on the software.
XML Root Context: This option will display the configuration file used for the test’s that will include the network nodes used, credentials details, SAM version and release etc.
Autorunner: Autorunner is a log file which generates the run time log for automation execution. It is helpful to read whether the automation runs are executing successfully or it has stuck due to some failure.
○ Schedule the Runs
Basically, there is provision to schedule runs for different rtb’s network topology. If any network run has failed in automation and requires the execution result, then the failed runs are executed again with this feature. Also, the ongoing runs can also be stopped at any time with the help of stop button that appears beside the run.
○ Different RTB’s
Once galvatron is launched, there is a drop down to select the RTB’s for which the results are to be viewed. After selecting the required RTB and hitting submit, the results will be displayed for the selected RTB. Likewise, other RTB’s can also be explored for automation results.
● PTS
After the real problems are identified in the automation runs, corresponding PTS (Problem tracking system) ticket should be raised in JIRA. While raising a PTS, following fields should be considered and correct format should be used to determine the PTS.
Problem description – Short description about the defect
Found in build and release – The build and release of the software used
RTB – Error found in which RTB
Steps to reproduce – Detailed steps to navigate to error and prerequisite required. Also mention the network topology and network node used.
Gating – Any impact on the existing functionalities
Impact – Provide whether the impact is Major/Minor
4.2 Design Verification – BGP Feature Testing Framework
4.2.1 Project Background
Border Gateway Protocol (BGP) is a standardized exterior gateway protocol. This project is essentially the development of an automated testing framework in terms of all relevant BGP features in SAM/CPAM. In today’s telecommunication industry, the BGP is becoming one of the most vital protocols in that it is designed to exchange routing and reachability information among autonomous systems (AS) on the internet [10].
4.2.2 Testing Methodology
The central idea for the BGP testing project is to use various BGP features to test the same set of preconfigured test actions in order to get the same passing results. The BGP features that are tested include:
- BGP partition manager
- BGP routing / CPAA alarm
- BGP network data
- BGP prefix monitor
- BGP route profile / prefix list
- BGP impact analysis
For the set of test actions, it basically triggers different BGP events that can be tested by those BGP features mentioned above. Each testing action is combined with an XML file to check whether that particular test action successfully happened. The set of test actions include:
- VPRN service injection / withdrawal
- IPv4/6 route injection / withdrawal
- BGP local preference testing action
- AS path length testing action
- MED testing action
- Route flapped testing action
- Route community testing action
- Route redundancy testing action
- Next hop switch testing action
For the test actions regarding VPRN services, both VPRN IPv4 (type 0, type 1 and type 2) and IPv6 (type 0, type 1, type 2) are considered.
4.2.3 Testing Framework
Before the actual testing framework can be established, I have to discover all relevant nodes into my SAM client and create two sub AS (AS 7000 and AS 7001) under one single confederation AS (AS 70). It is worthy to mention that for the BGP feature, the CPAA can only monitor sub AS 7001. However, for the IGP features, the CPAA can monitor the entire confederation AS 70.
The structure of the testing framework is based on a single XML file called “BGP_tests.xml” which includes all relevant scenario XML files calling the corresponding template XML files. The BGP testing framework is further organized block by block to make it more readable and testable. At the beginning of “BGP_tests.xml”, all scenario files are imported using <include> tag. The name of the main test is called “CPAM_BGP_FT_TESTS”, which is the main test that is being called every time with a <description> tag indicating that this test will execute the complete suite of available tests of BGP features. Under the main test which is “CPAM_BGP_FT_TESTS”, there are altogether 13 code blocks which represents the actual testing sequence.
- Code block one: “PRE CLEAR BGP EVENT FOR TESTS”
In this block, the BGP partition manager will automatically clear all historical BGP events in the memory in order for the verification XML files to capture the results of test actions. Due to the properties of SAM server, I code this section in a way that the BGP partition manager can automatically clear the BGP events multiple times. At the end of this code block, there is a final test to ensure that there is no information in the BGP partition.
- Code block two: “ENABLE BGP SITE SERVICES”
The purpose of this code block is just to find and discover the BGP services for all participating nodes.
- Code block three: “ENABLE MANUAL ALARM DELETION”
Due to the fact that the BGP alarm instance cannot be deleted manually, I have to send XML request to configure the setting to enable the manual alarm deletion option. The reason for this code block is to ensure there is no alarm triggered by the BGP test is left in the alarm window because these alarms are just for testing purpose rather than real alarms.
- Code block four: “CHECK BGP AS NETWORK DATA”
This code block tests the relevant BGP network information including the AS numbers, RIB values, and route target values.
- Code block five: “CREATE PREFIX MONITORS / ROUTE PROFILE / IMPACT ANALYSIS / CPAA ALARMS”
This code block creates all necessary BGP feature objects by sending XML request and check the creation of each object by verifying the corresponding XML response.
- Code block six: “INJECT INITIAL ROUTES”
In this code block, various routes / services are injected into the sandbox network and verified by the BGP features objects created above. To be specific, all VPRN services routes including all types of VPRN IPv4 and VPRN IPv6 and regular IPv4/6 are injected into the virtual sandbox network.
- Code block seven: “USE PREFIX MONITORS / IMPACT ANALYSIS / ROUTE PROFILE / CPAA ROUTER ALARM TO TEST DIFFERENT BGP FEATURE BEHAVIOURS”
This code block is the core of the entire BGP testing framework which implements the testing methodology mentioned above which is to use various BGP features to test the same set of preconfigured test actions in order to get the same passing results. The test action sequence in this code block consists of 16 inter-related test actions including the change of local preference, the change of AS path length, the change of community string, the change of MED, the change of next hop, route injection/withdrawal, and route flapped detection. However, not all BGP features are applicable to each test action. For instance, the test action regarding the change of community string only can be tested by using route profile and impact analysis.
- Code block eight: “RESET TEST SETTINGS”
In this code block, all configurations on the nodes in the sandbox network are reset to the original state to be ready for the next test run.
- Code block nine: “VERIFY ALARMS TRIGGERED BY SETTING RESET”
This code block simply tries to catch the additional BGP events which can be tested by BGP alarm features during the code execution in code block eight.
- Code block ten: “VERIFY BGP NETWORK DATA CLEARED”
This code block verifies there is no BGP network data after the all testing action sequence.
- Code block eleven: “DELETE PREFIX MONITORS/IMPACT ANALYSIS / ROUTE PROFILES / ALARMS”
This code block deletes all BGP feature objects.
- Code block twelve: “DISABLE MANUAL ALARM DELETION”
This code block sends XML request to set the alarm configuration to its default setting.
- Code block thirteen: “CLEAR BGP EVENTS”
This code block requests the BGP partition manager to clear the BGP events caused by this BGP tests.
5. Issues and Challenges faced
Initially, when my first work term started, I faced some of the challenges and issues like:
- The environment setup required for the tasks assigned to me took a lot of time and I get stuck few times to complete the setup and this caused delay in starting my testing. John, my coordinator helped me with this every time when I got stuck at something.
- The task of monitoring the network for errors required a specific skillset of finding what errors are and determines the root cause. Since, the Nokia product and network is very huge, earlier it became difficult to identify the real errors, sporadic errors and to investigate it. But later I acquired the skillset and it was smooth going for me. My Supervisor, Kwesi really helped me in this task a lot by providing the knowledge required and skillset on how to tackle this task correctly.
- The task of XML scripting/CLI scripting required knowledge about XML and CLI commands to design scenarios and test cases. I had to learn proper CLI commands to test and investigate the errors and also to configure the network elements correctly.
6. Personal Reflections / Observations
The Co-op involvement in Nokia is amazingly helpful as it fills in a stage towards a good profession. It gives a head start to the career growth and provides with proper exposure in the IT industry as to how the company works and how different tasks are carried out. This experience helps to become a good test engineer and excel in future opportunities.
The courses and projects that were learned in University are really helpful and valuable. For instance, the course “Software System Architecture” teaches some of the network knowledge that is used as part of the work term. This co-op term also provides a lot of experience in Network technology job skills, Automation and Manual Testing, Intellij – IDE for developers etc.
7. Learning Objectives Revisited
As part of the work term at Nokia, there were some planned goals that needed to be accomplished before the completion of the work term. The first goal was to learn different programming languages, different networking technologies, routing protocols and which was satisfactorily achieved by learning XML, CLL scripting, Investigation, BGPA, VPRN etc. The next goal was to become part of the team and establish a good relationship with the co-workers and team members. This goal was also completed by making some good friend at the workplace, helping co-workers, being nice and friendly to supervisor and managers. The third task at Nokia was to work hard at critical stages of the project and was also accomplished easily by working hard during the DV testing and patches related deadlines, staying late to complete the allocated work and communicating with the other team members to understand project work. The final goal was to work parallely and multi-tasking different tasks which were also achieved satisfactorily by setting and planning priority tasks. At the end of the work term, the planned objectives were properly taken care of and fulfilling the required expectations.
8. Recommendations
To be quite honest, the work term at nokia was very fulfilling and satisfactory with all the aspects like experience, work environment, team, co-workers, meetings, kind of work etc. The work at Nokia requires specific skills and technical knowledge about networking and telecommunication. The suggestion is to provide this knowledge as part of training at Nokia.
9. Conclusions
This co-op report summarizes the work that was performed at Nokia, details description about different tasks and projects, employer description, goals and objectives achieved.
10. References
[1] Network Services Platform. (2016, November 29). Retrieved July 02, 2017, from https://networks.nokia.com/products/network-services-platform/nfm-p
[2] Nokia expects to cross 95% ownership thresholds in Alcatel-Lucent and announces intention to file a public buy-out offer in cash for the remaining Alcatel-Lucent securities followed by a squeeze-out. (n.d.). Retrieved July 02, 2017, from http://www.nokia.com/en_int/news/releases/2016/06/16/nokia-expects-to-cross-95-ownership-thresholds-in-alcatel-lucent-and-announces-intention-to-file-a-public-buy-out-offer-in-cash-for-the-remaining-alcatel-lucent-securities-followed-by-a-squeeze-out
[3] Regression testing. (2017, June 28). Retrieved July 02, 2017, from https://en.wikipedia.org/wiki/Regression_testing
4] Nokia Internal file “Scrum Regression”
5] Nokia Internal file “Creating Scripts for 5620 SAM Automated Regression”
6] Nokia plans to acquire Witlings to accelerate entry into Digital Health. (n.d.). Retrieved July 02, 2017, from http://www.nokia.com/en_int/news/releases/2016/04/26/nokia-plans-to-acquire-withings-to-accelerate-entry-into-digital-health
7] Nokia celebrates first day of combined operations with Alcatel-Lucent. (n.d.). Retrieved July 02, 2017, from http://www.nokia.com/en_int/news/releases/2016/01/14/nokia-celebrates-first-day-of-combined-operations-with-alcatel-lucent
8] Our vision. (n.d.). Retrieved July 02, 2017, from http://www.nokia.com/en_int/about-us/who-we-are/our-vision
9] Product Information and Downloads. (n.d.). Retrieved July 02, 2017, from https://support.alcatel-lucent.com/portal/web/support/product-result?entryId=1-0000000002906
10] Sample Configuration for iBGP and eBGP with or Without a Loopback Address. (2017, May 11). Retrieved July 02, 2017, from http://www.cisco.com/c/en/us/support/docs/ip/border-gateway-protocol-bgp/13751-23.html
11] 7750 SR. (n.d.). Retrieved July 02, 2017, from http://alu-catalog.maarkprod.com/en_us/products/7750-sr
12] 7750 Service Router. (2017, June 14). Retrieved July 02, 2017, from https://networks.nokia.com/products/7750-service-router
13] NSP Connected Partner Program Overview. (2016, November 16). Retrieved July 02, 2017, from https://networks.nokia.com/network-services-platform-connected-partner-program
10 Abbreviations
| API
Application Program Interface |
App
Application |
Co-op
Co-operative Education |
| DOM
Document Object Model |
E-mail
Electronic Mail |
GUI
Graphical User Interface |
| IP
Internet Protocol |
VSAM
Virtual SAM |
VM
Virtual Machine |
| MD
Material Design |
NFMP-P
Network Functions Manager for Packet |
NPM
Node Package Manager |
| NSP
Network Services Platform |
OAM
Operation, Administration, and Management |
OS
Operating System |
| QA
Quality Assurance |
SAM
Service Aware Manager |
SAP
Service Access Point |
| SC Locator
SmartClient Locator |
SDP
Service Distribution Point |
UI
User Interface |
| UX
User Experience |
Cite This Work
To export a reference to this article please select a referencing stye below:
Related Services
View all


Related Content
All TagsContent relating to: "Information Technology"
Information Technology refers to the use or study of computers to receive, store, and send data. Information Technology is a term that is usually used in a business context, with members of the IT team providing effective solutions that contribute to the success of the business.
Related Articles

DMCA / Removal Request
If you are the original writer of this dissertation and no longer wish to have your work published on the UKDiss.com website then please: