Snapchat's Competitive Environment: Success Factors and Future Sustainability
Info: 8122 words (32 pages) Dissertation
Published: 25th Aug 2021
Tagged: Social MediaBusiness Strategy
Chapter 1: Introduction goals and expectations for the study
My research aims at providing a general understanding of the competitive environment that characterizes Snap, Inc. striving to explain what lies behind the recent success of the company’s IPO. The goal of this study is to analyse the firm’s success factors and their future sustainability in an attempt to generate a potentially successful strategy for the firm.
To begin with, it is of utmost importance to understand who the main competitors in the social media industry are and to which branch they belong to. Secondly, after having identified the segment of interest for the firm, a competition analysis is needed to grasp its full potential in relation to its competitive position. The third step, and most crucial one, focuses on the importance of network externalities and positive feedback within communication and information markets in predicting Snapchat’s future direction. Finally, the study will conclude with the analysis of its current financial performance and the identification of a potential strategy for it to strive.
Chapter 2: The company’s background.
Snapchat was founded on July 8, 2011 by Evan Spiegel and Bobby Murphy. The company started off as Picaboo, a picture messaging app on iOS, it was renamed Snapchat a few months later, as its features started to be implemented. Over the years it went through substantial changes, the introduction of video messaging, smart filters and stories quickly brought the firm to obtaining a strong success. From 2014 onwards, daily active users (DAU) started increasing at an average rate of 50m per year and the application quickly became one of the most famous messaging apps among millennials.
In September 2016, Snapchat Inc. was renamed Snap, Inc. The company went public on March 2017, pricing its shares at $17 above the $14-$16 range. The offering makes it the largest U.S tech IPO since Alibaba raised $25 billion in 2014. After its first day trading, its stocks soared 44% at a valuation of over $33 billion, attracting the attention of investors. The size of the offering was of 200 million shares, accounting for more than 10% of the total trading volume that day on the New York Stock Exchange. Despite its initial success, the value of the stock quickly started to drop until it finally went below its IPO value in July as the lock-up expiration date was approaching. Shares are currently trading at around $13, showing that the company had mostly probably been overvalued.
Snapchat defines itself as a camera company, with the mission of reinventing the camera in order to improve the way people live and communicate. The former poses a clear interrogative on the firm’s future direction, which seems to be far detached from its current position. Although 98% of its revenues come from advertising, we expect a shift towards hardware investments, striving to create a new market in which the firm could eventually held a dominant position. The former radical change had been mostly dictated by the harsh competition against Facebook, slowly determining the impossible coexistence of two market standards.
Chapter 3: Social Media Industry.
Identifying competitors in the industry is not an easy task as it requires a clear understanding of what is meant by Social Media. Researchers[1] believe that a formal definition of the term requires the interpretation of two related concepts: Web 2.0 and User Generated Content (UGC). The term Web 2.0 was first coined in 2004, it describes a new way in which developers and users started to utilize the World Wide Web. It describes a collaborative fashion according to which contents and applications are no longer created and published by individuals, instead they are continuously modified by all users. On the other hand, UGC represents the ways in which users interact with Social Media. According to the Organization for Economic Cooperation and Development (OECD, 2007) UGC needs to fulfil three basic requirements in order to be considered as such: first, it needs to be published either on a publicly accessible website or on a social networking site accessible to a selected group of people; second, it needs to show a certain amount of creative effort; and finally, it needs to have been created outside of professional routines and practices. Consequently, according to Andreas M. Kaplan and Michael Haenlein, “Social Media is a group of internet-based applications that build on the ideological and technological foundations of Web 2.0, and that allows the creation and exchange of User Generated Content”.
- Identification of main competitors.
It would be misleading to assess the competitive environment of the single platforms without further distinction of their characteristics. Andreas M. Kaplan in 2009 identified six different categories of Social Media generated by the interaction of two key elements: social presence or media richness and self-presentation or self-disclosure. Social presence has been derived from the social presence theory developed by John Sort, Ederyn Williams and Bruce Christie. Its founders defined it as “the degree of salience of the other person in the interaction and the consequent salience of the interpersonal relationships”, hence awareness of others and degree of appreciation of the interpersonal relationship. The concept of media richness is instead based on the work of Daft and Lengel. They stated that “Organization process information in order to reduce uncertainty”, for this reason Media richness defines Social Networks on the basis of their ability to reduce ambiguity. Consequently, the value of common SNSs increases according to the amount of information that can be shared in a given time span. On the other hand, the theory of Self-presentation or Self-disclosure is a widely studied one in modern social psychology. Erving Goffman first studied this concept in 1959, his book “Presentation of self in everyday life” explores human behaviour applied to social contexts. The author explains that we as humans are social animals and as such, we are interested in the impressions other people form of us and this leads us to try and control such impressions by sharing specific experiences. This theory applied to modern web applications defines the different types of users’ behaviour on the internet.
The following graph shows the industry segmentation according to Andreas M. Kaplan:
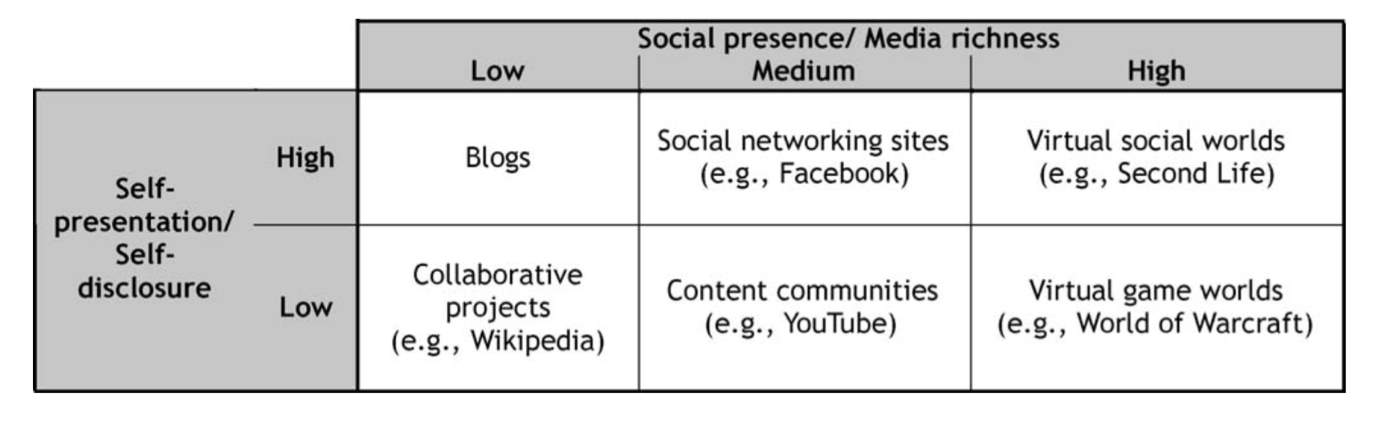
The Social Media industry is a fast changing one, hence I believe that this specific segmentation requires to be updated to the modern competitive landscape. More precisely, Virtual Social Worlds in the high-high sector are currently a declining reality. Communities like the previously widely adopted Habbo Hotel or Second Life are coming to an end as users are becoming more interested in sharing real life experiences and connecting to their peers rather than living the virtual world. In my opinion the category should be renamed “Media sharing platforms” and that is were Snapchat and Instagram should be collocated. Messenger and WhatsApp Status represent other competitors, though much smaller in terms of users’ interaction and market share. This analysis will then consider those firms competing in the branch renamed “Media sharing platforms” that are similar in terms of market share and target reach.
Chapter 3.1: Industry Analysis
After having carried out a segmentation analysis and having selected a sample of competitors, it is time to introduce the forces that shape the industry. The following section examines Porter’s five forces, namely: Existing competition, threat of new entries, threat of substitutes, bargaining power of suppliers and bargaining power of customers. Our interest is directed at those companies showing high Self-disclosure and high Social Presence within the social media industry.
- Existing competition
Existing competition represents a moderate to high threat. Success is mostly determined by network externalities and positive feedback, making size and penetration rates two of the most important assets for profitability. Positive feedback makes the niche under examination a “winner-takes-all” market, determining the impossible coexistence of more than one market standard.
On the other hand, a niche targeting strategy could potentially be effective as the population of interest of existing competitors is particularly narrow. In fact, the largest percentage of “Media sharing platforms” users are represented by Generation Z and Millennials, only a low percentage is older than 35 years old. Taking Snapchat as an example, in its S-1 the company expressed the intention of boosting monetization over its existing user-base, without showing any particular interest for older customers. However, being it a public company since March 2017, we expect the company to come under the pressure of investors aiming at increasing its size and value. Consequently, this does not simply imply the enhancement of monetization’s efficiency, but rather increasing the company’s scale[3]. The introduction of new applications presenting specific features with the ability of attracting a broader audience might eventually represent a source of income for late-comers.
In the end, competition is mostly regional and the birth of new regions is determined by two key factors: smartphone penetration and cellular based data networks expansion. For this reason, the largest markets are the US and the European market, whereas the rest of the world accounts only for a small percentage of users. Expansion within new potential markets then, does not depend strictly on internal factors, but rather on external non-modifiable ones.
- Threat of new entrants
The threat of new entrants is moderate. Any new incumbent wishing to compete in the market should take into account two barriers: fixed costs and marketing costs. Fixed costs do not represent a major obstacle as nowadays the cost of producing new sites or applications is sufficiently low to be considered affordable by the general public. On the other hand, marketing costs are able to raise barriers to entry to an extent as the process of gaining brand recognition and acquiring new customers is not an easy one. Moreover, new ventures are not required to be backed by expensive or unreachable assets, making ex-ante barriers low.
New ventures have the opportunity to compete through innovation or even avoid competition by creating an entirely new market. The latter strategy has recently been named “Blue Ocean Strategy” and represents a clear example of what Snapchat did back in 2011. Although, innovation is not always the key, especially within branches of the information technology industry. Incumbents have a very effective way of defending themselves from innovation: consolidation. Facebook is a clear example of a widely consolidated firm. Buying over Instagram and WhatsApp, it was able to control images and texts, consequently making Snapchat a simple feature of its vast array of social platforms.
- Threat of substitute products
Threat of substitutions is moderate to high. Its magnitude shall be assessed by considering a few key elements of the industry: switching costs, platforms specificity, developing trends and potential imitation. Costs of switching to another platform are low, as Snapchat pointed out in its S-1 filing the majority of users are 18-34 years old, this demographic may be less brand loyal and more likely to follow trends than other demographics. Moreover, social networks in general are becoming more and more specific as they cater specific interests of the public. An eventual increase in the popularity of one trend over another may lead customers and users to switch to a new platform.
In the end, the largest threat is posed by imitation. Whenever imitation comes from a larger and better consolidated firm user retention, growth and engagement may end up being seriously harmed. Constant innovation and ability to change are then two of the most effective way of remaining competitive.
- Bargaining power of suppliers
Platforms in the market depend heavily on suppliers of mobile operating systems, hardware, networks and regulations. Consequently, compatibility to specific standards, not directly controlled by competing firms, is an essential source of profitability and potential cause of harm. For this reason, we expect the bargaining power of suppliers to be moderate to high, depending on the size of the competitor under consideration. Moreover, the amount of suppliers of certain hardware and software is limited and this raises their bargaining power by an extent.
The largest suppliers of Snap, Inc. are Apple and Google. As pointed out in S-1 the largest portion of user engagement is on smartphones having an IOS operating system, improving the relationship with suppliers of Android systems will be key to future earnings. Google instead, represents the largest supplier of the firm as the vast majority of its computing power, storage and bandwidth relies on Google Cloud. A relationship-specific investment of over $2 billion dollars has recently been carried out by the firm making the costs of switching cloud services to a new provider extremely high. Any significant disruption of their operations would represent a serious harm to their business.
- Bargaining power of customers
The market is characterized by two different types of customers: users and marketers. Users hold a high bargaining leverage as the costs of switching to a new platform are low. Retaining their engagement and ensuring a good user experience is key for extracting sufficient profits from marketers, being the real paying customers of the firm. The degree of bargaining power held by marketers is instead inversely related to the amount of users of a given application. The larger the user-base the greater the interest in investing of marketers will be, the opposite is also true. Consequently, competing firms should aim at increasing their user-base as much as possible in order to increase their value as marketing service providers.
Snapchat’s decreasing rate of adoption is also causing advertisers to shy away from influencer’s marketing, proving our previous thesis according to which the company’s interest should be directed towards increasing the existing user-base rather than enhancing Ads efficiency.
- Industry dynamics
After having examined the main forces shaping the competitive environment, our attention will now turn to the industry dynamics. It is in our interest to understand at which stage of the Industry Life Cycle (ILC) the social media sector is located in order to grasp its potential future expansion. The four stages of the ILC are the following:
- Introduction
- Growth
- Maturity
- Decline
As previously pointed out, sector development is strongly regional and its growth depends on two main factors: smartphone penetration and cellular based data networks expansion. The Pew Research Center began tracking social media adoption in the US in 2005, since then the percentage of American adults adopting at least one of these platform went from 5% to 69%. It is interesting to notice that a very high percentage of internet users are also using social networking sites, results are summarized in the following graph:
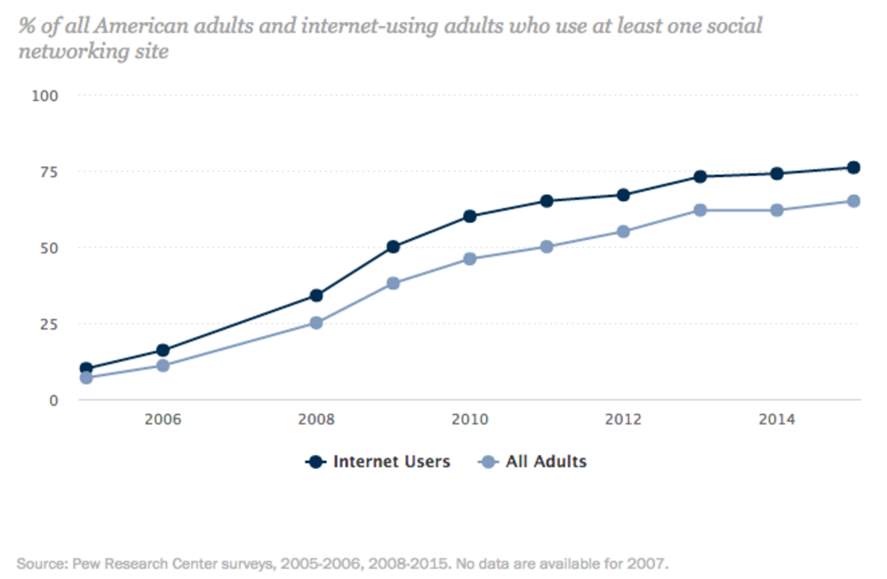
Although, our focus shall not be directed merely at the US market, but at the global landscape. By looking at the global rate of adoption of social media platform, it results obvious that the industry is currently still in its growth phase and that it will probably be for many more years. Annual growth continues apace, since January 2016 the percentage of mobile social users increased by more than 21%, hitting a 37% penetration rate of global population. Asia-Pacific is driving much of this growth with active social users increasing 25% since January 2016. Consequently, as smartphone penetration and cellular base data networks expansion keep increasing, there will always be room for growth in the social media industry. Being it strictly depending on regional constituencies, policies, innovation and cultures, we expect growth to follow the pace of regional development.
Chapter 4: Network externalities and positive feedback.
Despite Snapchat being a camera company, the firm still belongs to the wider environment of Social Media. For this reason, in order to assess the profitability of the firm in terms of its competition against external major players, we shall consider the relationship occurring between companies and Social Networking Sites. Firms and individuals tend to use SNS differently, the former are mostly interested in attaining marketing and advertising effectiveness [Kazuhiro Kishiya], while the latter are concerned with the creation of a virtual connection with their peers. Moreover, SNS belong to the Information Technology market, where information is anything that can be codified or encoded in a stream of bits [Shapiro]. IT represents a relatively new economy in which prices depend on perceived value rather than costs, characterized by increasing returns and positive feedback rather than decreasing returns and negative feedback. Consequently, drivers of expansion differ with respect to those of more traditional industries. Factors influencing individuals’ behaviour of accepting information technology are then driven from two fundamental theories: Motivation theory and Network Externalities.
Motivation is divided into Extrinsic and Intrinsic [Deci 1975]. Extrinsic motivation refers to committing an action because of its perceived helpfulness in achieving value, while intrinsic motivation refers to committing an action because of interest in the action itself, rather than external reinforcement [UGUALE A TESTO]. We can translate these two aspects of motivation into usefulness and enjoyment. Both usefulness and enjoyment will have a positive effect on the attraction and retention of customers if backed by a substantial Network Effect. Shapiro defined Network externalities as “the value or effect that users obtain from a product or service will bring more values to consumers with the increase of users, complementary products or services”. The theory is in line with the concept of increasing returns to adoption, as the installed base of a product increases, more customers will have an incentive towards adopting the technology. [Page 1153 – read the texts by other scholars]. According to researchers, there are three sources of Network Externalities: direct, indirect and peer. We refer to Direct Network Externalities when the increase in users of a particular product or service is driven by an increase in user’s benefits and value. Indirect Network externalities represent a higher sense of user value due to higher benefits deriving from complementary products. When referring to Social Networking Sites, peer network externality becomes the most important source of user’s utility maximization. In fact, utility depends on the development and retention of individual social circles, the greater the amount of friends joining the network, the greater the intention to use the platform will be.
Both of the analysed theories are necessary for studying the outcomes of the direct competition between Snapchat and Instagram, in order to understand whether two market standards could eventually coexist. In its S-1 filing Snapchat specified that the key for becoming successful in this industry is given by customers’ retention and innovation. Focusing on the first element, we shall make a parallelism between the observed theories and the Hooked Canvas developed by the economist Nir Eyal in recent years. “The Hook” model is a recipe for creating habit-forming products and can be used for assessing the ability of a product to retain customers’ interest over time.
After a brief explanation of the overall mechanics of the model, it is in my interest to compare the two canvases for both Snapchat and Instagram. The results will highlight the substantial differences in the reward systems of both corporations, providing essential information regarding their strengths and weaknesses in terms of users’ retention.
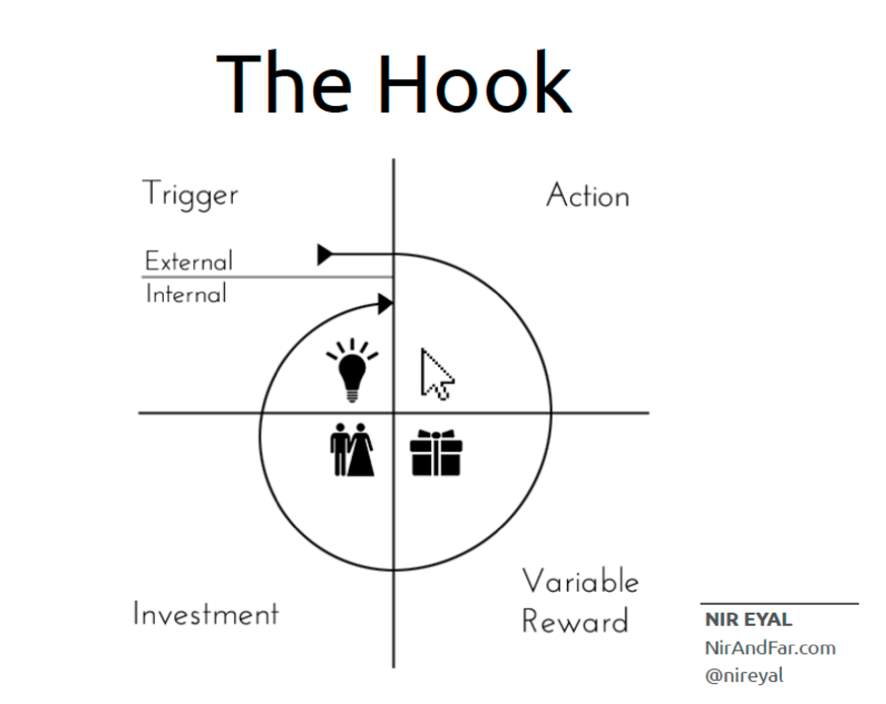
We already specified that both external and internal drivers can lead to the adoption of a specific technology. Here we identify such External and Internal drivers as triggers of a specific action, performed while using the considered platform or product. In order for the product to be appealing, the action performed must produce a variable reward, which is the first most essential step for the establishment of a Hook system. After that, the constant investment of time, effort, and eventually money will generate new triggers causing the cycle to start back again.
Let’s now detach from the generic representation of the model to go more in depth analysing differences among the two companies’ strategies:
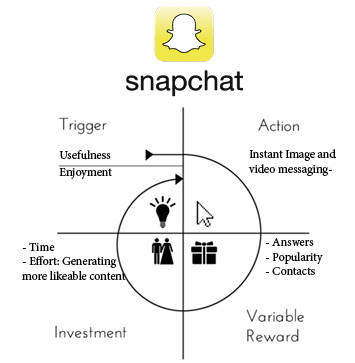
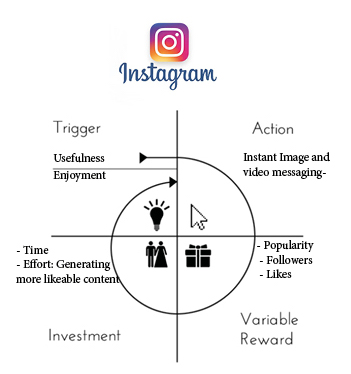
Graphs 2 and 3 show in details the dynamics of the hook model applied to Snapchat and Instagram Stories. According to my analysis, such products present the same triggers, actions and average investment, although they differ substantially in their rewards mechanisms. Usefulness is the external trigger attracting users to the platforms, while enjoyment is instead the internal trigger working in favour of user retention. The actions performed by users are similar for both applications and do not represent a source of advantage for neither one of the two. Moreover, in both cases the investment comes in the form of time and effort directed at the development of interesting stories or direct messages. The nature of the technology, causing the deletion of both images and videos after a few seconds, is such that time lost at creating content is reduced to a minimum, enhancing the likeability of both platforms. As previously pointed out, the reward system is what poses a substantial difference between the products. Snapchat is not directly compatible or connected to any other social networking site, instead Instagram Stories is one of the many features of the widely adopted social network Instagram. Consequently, while the former has a unique system of rewards, strictly connected to its features, the latter presents a mixed system, directly connected to the wider scope of the entire application. Interesting stories may lead your peers to view your Instagram profile and pictures and to express their appreciation through a simple “like”. The greater level of interaction and dynamicity is what allowed the company to compete in the market despite its late entrance.
A second way to look at the phenomenon is to confront users’ growth through the years for both applications. The following graph provides a snapshot of their expansion:
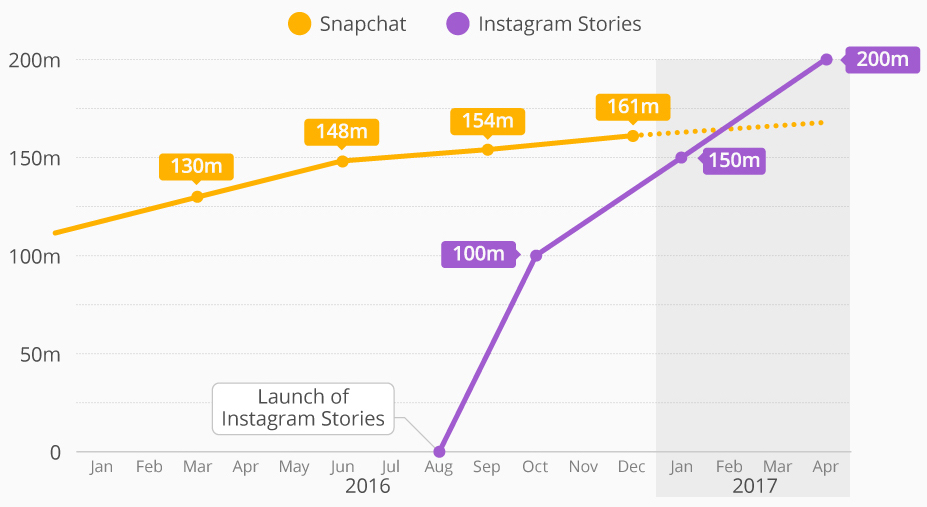
Instagram Stories was launched in August 2016 outperforming Snapchat in terms of Daily Active Users roughly seven months later. Its growth was exponential, despite its product being a clear imitation of Snap, Inc. core offering. There are many possible reasons that might have led the public to choose a product over the other, although the most obvious and important one must be “customers’ perceptions”. Instagram Stories was able to exploit the momentum deriving from the strength of its original application, the likeability and size of its core business brought the public to experience and like the new feature of the platform. Consequently, the collective switching costs deriving from network externalities were overcome through the exploitation of an already existing larger user base.
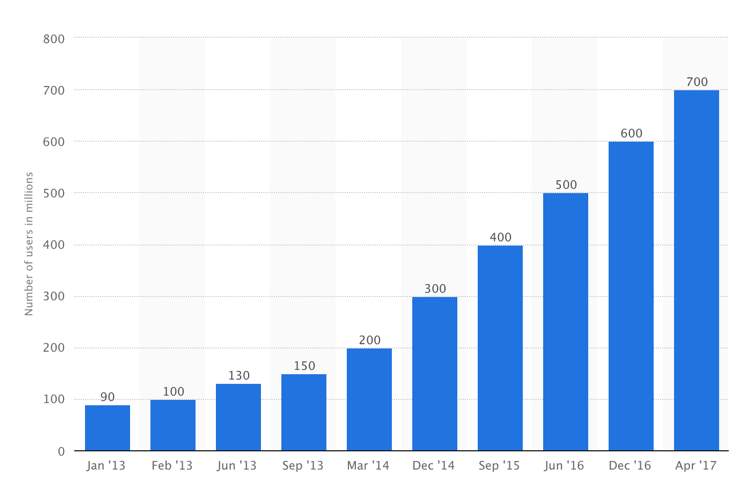
As it can be seen from the graph, currently more than 700m people are using Instagram and this figure has been increasing at a constant rate since March 2014, we are not expecting it to slow down in the near future. Furthermore, competing with Instagram Stories meant a direct competition against the larger and stronger Instagram platform, with the inclusion of all of its features. Having the possibility of accessing both Instagram and Snapchat-like features in the same platform increased customer’s utility and, consequently, their perceived value.
The ultimate equilibrium, seeing Instagram at the top of the camera market, is explained through the application of the modern theory of positive feedback. In 1989 Sciamer Arthur pointed out an important characteristic of economics, according to him conventional economic texts would portray the economy as a system characterized by a unique solution determined by the intersection of demand and supply. He stated that “Economic actions engender a negative feedback that leads to a predictable equilibrium for prices and market shares”. Modern Positive-feedback economics instead, assumes the existence of many possible configurations. The final outcome of the economy would in the end be strongly determined by history and occasional unpredicted circumstances. Hence, if the outcome of competition in more traditional markets could still be interpreted adopting the assumption of diminishing returns, the same is not true for modern, less conventional economies. In fact, the presence in the market of two firms offering similar products (Snapchat and Instagram) creates an industry instability, the market is then regarded as “tippy”. Within a similar environment the concept of “survival of the fittest” is generally not regarded as reliable due to the greater uncertainty generated by the eventual circumstances’ change.
To better understand the increasing returns problem economists adopted a general non-linear probability schema, offering a clear solution regarding the possible patterns’ outcome. The problem is the following: There is a gigantic table to which balls are added one at the time; they can be of several possible colours – white, red, green, or blue. The colour of the ball to be added next is unknown, but the probability of a given colour depends on the current proportions of colours on the table”. This system demonstrates positive feedback as an increasing proportion of balls of a given colour increases the probability of adding another ball of that colour. The solution to the current mathematical problem shows that not only a single solution exists, instead the solution lays within a wider set of fixed events which may or may not occur on the basis of probability. This schema brought about the wider definition of positive feedback proposed by Shapiro: “Positive feedback makes the strong grow stronger and the weak grow weaker”. The parallelism of the previous theory with our case is provided by the economy at stake, Information Technology is not driven by economies of scale, but rather by economies of networks. To be more specific, the larger the installed based is expected to be, the larger the installed base will become following what is called a “virtuous cycle”. This explains why the coexistence of two almost identical standards is impossible, eventually the market will tip towards one or the other, revealing the “winner-takes-all” intrinsic nature of the economy.
Chapter 5: Business model and profitability.
Snapchat Business Model, just like other big players in social media business, is all about trends. The main revenue source for the company is advertising, although, unlike most corporations in the market, the firm does not sell any of its users’ information. In fact, the big difference between Snapchat and other big players like Facebook are the economies of learning generated by having the team that designs consumer products also design the advertising products. This leads to the creation of Ads perfectly reflecting the company style, fully camouflaged with consumers’ content. The way in which they are able to achieve this is through Sponsored Creative Tools. People can create Snaps using sponsored lenses or sponsored geofilters realized by the design teams in collaboration with companies or event organizers. Snap ads with attachments are then a second way for delivering specific advertisements through stories. Interactive attachments allow the viewer to respond to an advertisement directly through a Snap Ad without having to leave the application.
It is then obvious that the amount of advertising revenue generated is a function of both time spent on the application by each single user and the size of the user-base. Consequently, this highlights the necessity by the firm to direct its efforts towards attracting more users and at increasing Ads and content efficiency. Snapchat has partnered with publishers to provide daily news and feeds on its own platform with the intention of increasing the amount of time spent by users on the application. Not just that, publishers are also paying a lot of money for gaining these advertising spaces as they generate a win-win situation for both companies. On the other side, the firm seems to have no intention of expanding its platform to meet the needs of an older audience. This is causing the rate of adoption growth to slow down.
Comparison to other Business models.
Let’s now take into consideration some of the most known SNSs and their business models to make a comparison in terms of revenues. Facebook is probably the most direct competitor in the industry, its business model is similar to that of Snapchat, although it differs on some key features. Its primary source of revenue is Advertisement, which involve the use of user data for targeting. Hence, we notice the main difference between their business models, Facebook on his side has huge amounts of data which are sold to increase its advertisements’ efficiency. The newsfeed algorithm has been changed such that it is much harder for marketers to get more reach organically, which in turn increased its profits substantially worldwide. Furthermore, Facebook truly understands the importance of increasing its user-base, which is now its top priority. With more than 1 bn. DAU, they understood that the secret for expanding their business is to provide internet to those areas worldwide that never had access. The introduction of internet.org and solar drones were the first steps towards the realization of their strategy. Moreover, the introduction of new products like Instagram, Messenger, WhatsApp, etc… also provided additional streams of revenues to the corporation.
In between Facebook’s products, Instagram features are the most similar to those of Snapchat, although its revenue model is still much different and not as polished. Instagram makes money through Sponsored posts, Carousel advertisements and stories. Despite their current effectiveness, they might lose their efficiency in the future as users can easily differentiate them from organic posts, this results in less clicks through rate and engagement. Consequently, we expect Instagram to copy more of the Snapchat’s features in the future, especially for what concerns its revenue earning strategies.
ARPU: Measure of business efficiency
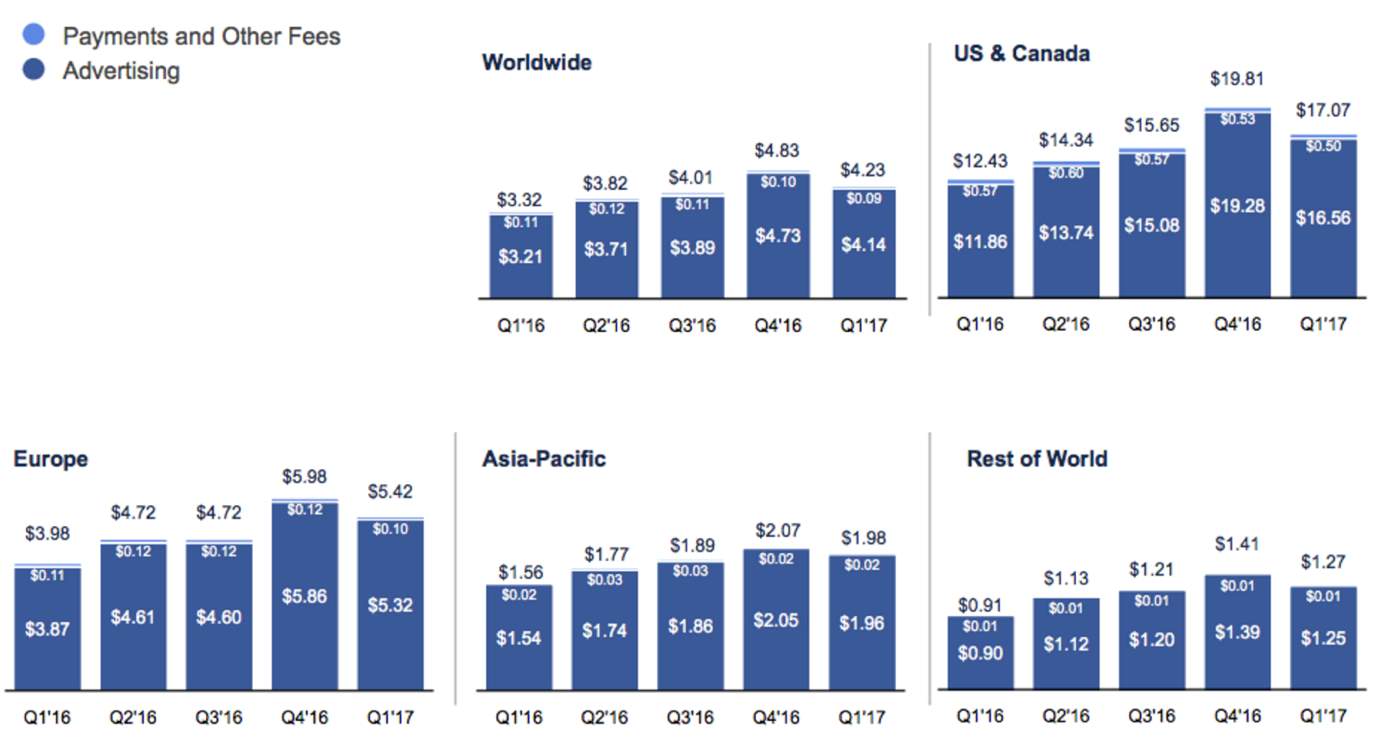
The average revenue per user (ARPU) is a measure of the revenues generated per user or per unit. It is most often used by technology and telecommunication sectors to assess the profitability of their operations, in this case it will help us assess the potential profitability of Snapchat compared to other SNSs. The ARPU is simply calculated by dividing the total revenue of the firm within a given time span or location by the total amount of Daily Active Users in that location. The following graph shows the amount of Average Revenue Per User generated by Snapchat over the last five quarters:
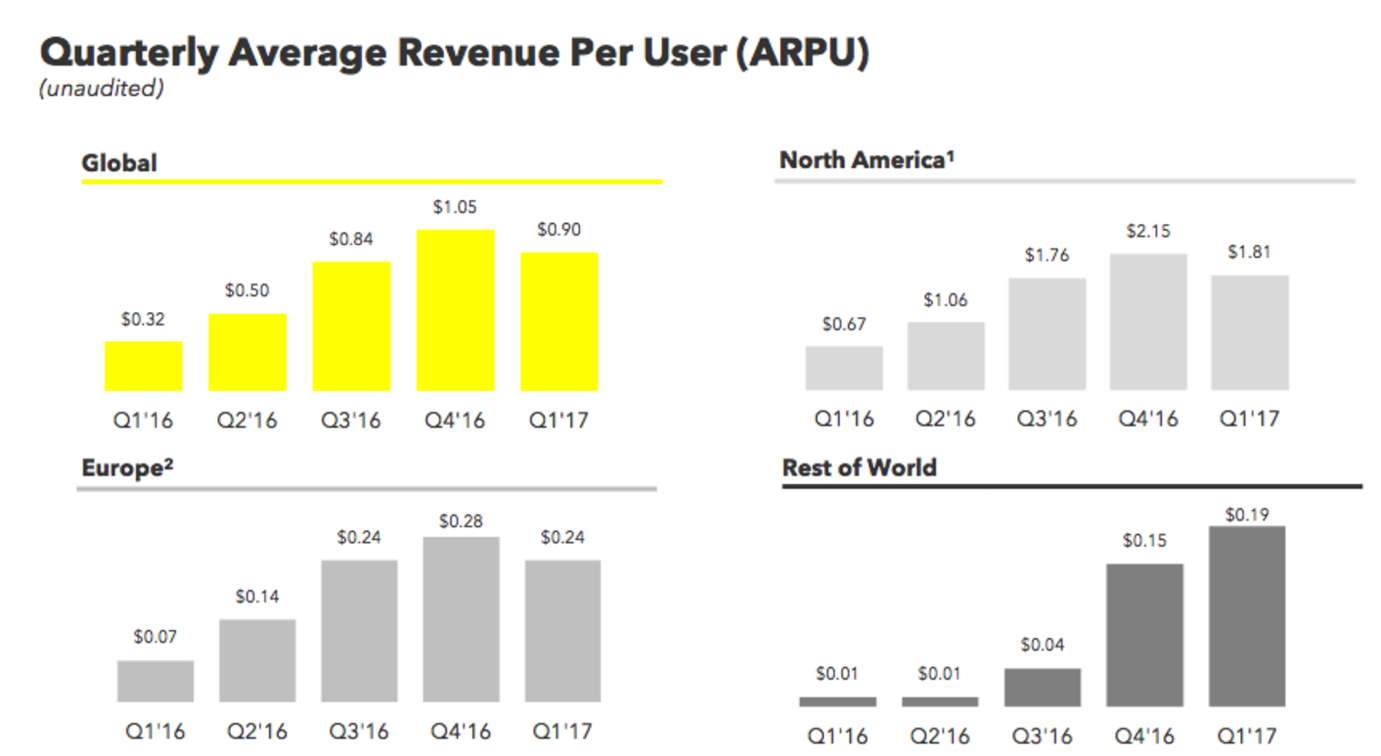
Snapchat experienced a substantial increase in revenues, the company recorded revenue of $404,5 million in the year ended December 31, 2016, as compared to revenue of $58,7 million for the year ended December 31, 2015, representing more than a 6x year-over-year increase. Despite it’s apparent growth, Q1’ 2017 earnings were highly disappointing for investors. Snapchat missed its first revenue goal as a public company by almost 10 million dollars earning 149.6 million against the expected 159 million dollars, causing the stock to go down more than 20%. Moreover, the ARPU levels are still very low if compared to other established corporations in the market. An optimist investor might simply look at how much room is there for growth, although there are many more factors to be taken into consideration. Let’s now look the ARPU for Facebook:
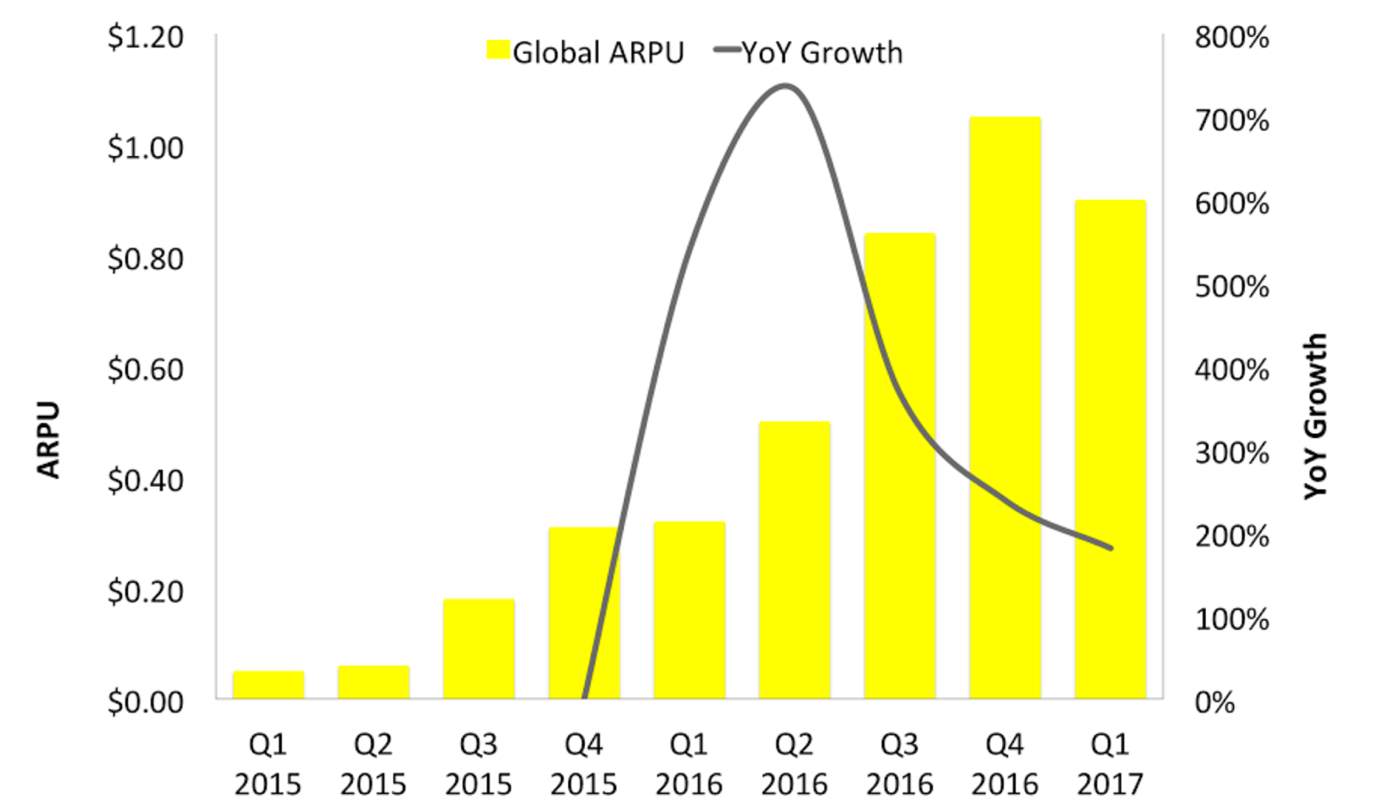
As it can be noticed from the graph, Facebook is much stronger than Snapchat both in terms of revenue and in terms of Daily Active Users. The company has the ability to exploit more than one single product for advertising purposes and to keep growing accordingly. Moreover, their strategies are much different, Facebook is concerned with expanding its user-base by bringing internet to the entire world, Snapchat is instead focused on improving user experience by increasing the efficiency of its product. The fallacy of the latter is directly translated in a lower year-to-year growth, both in terms of ARPU and DAU. According to investors, the interests of the company should be mainly directed at increasing its user-base in the hope of meeting market expectations. CEO Evan Spiegel justified the first earning call with investors by saying that over the past quarter the firm had been “working on the quality of the application” especially on Android in an attempt to make it easier for Android users to access it. According to him, the slow growth was mainly due to the vast array of Android bugs slowing operations down. For what concerns investors though, the strategy is not proving successful, the following graph shows the strong decline in year-to-year growth currently posing a threat to the value of the stock:
The previous graph does not consider earnings for the second quarter of 2017 released on August 10. Here are the results of the financial highlights for Q2’ 2017:
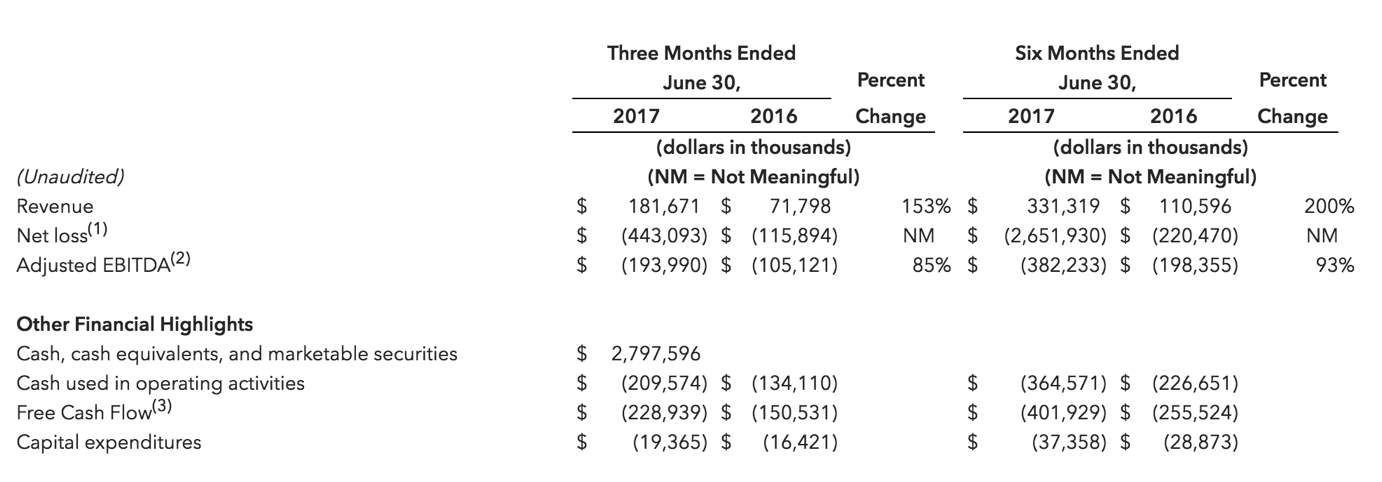
Over the last quarter the company experienced a 153% increase in revenue. A similar growth would seem decent for almost any company, but not for Snapchat which is required to raise much more than that due to its highly expensive cost structure. On top of that, not many companies with the size of Snap’s revenue base have 1.2 billion shares outstanding. The only reasonable level of growth seems to be the ARPU which increased by 109% since the previous year and more than 16% over the last quarter. Although, the ARPU is also positively affected by the slower growth in terms of DAU being of 4% quarter-over-quarter, in turn being a strongly negative sign for the future of the corporation.
Average Margin Per User.
Although most firms in the telecommunication industry use ARPU in order to assess the profitability of their business, Average Margin Per User (AMPU) is a more reliable metric of potential success. AMPU measures the margin made by the firm on each customer, it is calculated as revenues minus costs, divided by the number of Daily Active Users (DAU). The following graph provides a snapshot of AMPU for Q4 of the years 2015 and 2016 compared to Q1’ 2017 and Q2’ 2017[2]:
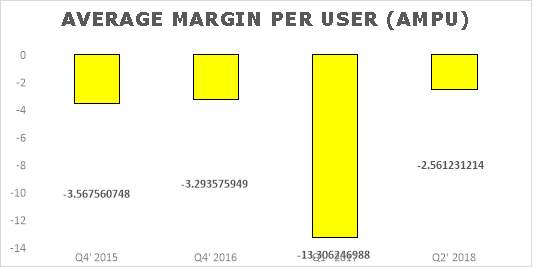
As it can be noticed, such a measure of profitability highlights the fallacy of Snapchat’s expensive cost structure. The company experienced constant losses over the years in proportion to their revenues and growth in DAU. Snapchat faced substantial losses of more than $2 billion in Q1’ 2017, although this specific amount should be considered as an outlier as expenses were mostly coming from investments in innovation and general and administrative expenses most probably covering the IPO costs. Consequently, the real disappointment comes from the cost base of the company, not yet seeing any leverage. Based on the current trajectory, revenues come in at a rate of $750 million a year, while expenses are over $1.8 billion a year. Snapchat should be ready to fight on all fronts in order to face the problem, firstly by trying to increase their user-base and secondly by trying to differentiate within new branches of the market.
CHAPTER 6: Innovation
The prospectus filed in March 2017 refers to Snap, Inc. as a camera company, although the firm has always been regarded by the public as a social media company, operating primarily in the smartphones’ applications market. As pointed out during the introduction of the study, this suggests – at least theoretically – a potential shift to a fully hardware base corporation.
The first real attempt to revolutionize the camera market came at the end of September 2016 with the release of Snapchat Spectacles, $130 sunglasses with a camera inside granting the user to take snaps directly from their point of view, without ever taking them off. Despite their original marketing campaign and the strong appeal generated, especially within the US market, spectacles represented only a small portion of the company’s total revenue in Q1’ 2017. In fact, total revenue in the quarter were $149 million, eight of which had been generated by Spectacles[3]. Current rumours reveal that Snap, Inc. is currently working on its next hardware attempt by trying to enter the drones market. According to buzzfeed.com, last year the firm acquired a drone startup based in Venice (CA) called Ctrl Me, which seems to suggest more than a passing interest in the drone market. The relationships with the new venture are still unclear, moreover it is still unknown whether the startup has already started working on their own prototype or not. The only certainty is that we shall expect more to come from a hardware perspective and that the strong spending in research and development occurred during Q1’ 2017 may be suggesting a similar change.
CHAPTER 7: Conclusions.
The goal of this study was the one of evaluating Snapchat’s competitive positioning in the market and to develop a potential strategy for the company to become highly successful in the future. The following conclusions are based on both industry analysis and profitability analysis providing fundamental feedbacks regarding the firm’s potential direction.
The Social Media industry is a highly competitive one, competition is characterized by the presence of very large players holding the largest portion of the market share. Snapchat’s main competitor is Facebook, owner of Instagram, Messenger and WhatsApp, being three applications sharing common features to the reviewed platform. In terms of its competition against these major players, the company is now facing some difficulties, mainly due to its low market share. Consequently, the theories of Network Externalities and Positive Feedback suggest the impossible coexistence of two market standards, in turn proposing an immediate strategy change. To begin with, Snapchat, which is currently mostly millennials based, should start implementing new features aiming at making the application suitable for an older audience. This would in turn increase the current user-base and boost monetization coming from advertising. Advertising revenues, now representing the main source of competitive advantage for the firm, will be good in the short term, although they are expected to diminish as Instagram keeps copying Snapchat’s features.
The next step for the creation of a sustainable business is differentiation. Snap, Inc. should be ready to increase its investments in consumer products while still developing their advertising business with better targeting tools for advertisers. Innovation will then be the key for competing against highly consolidated firms, granting itself a sufficient market share. Moreover, the firm should be immediately ready to address the issue coming from its expense base. The cost of revenue should be reduced drastically in order to meet quarterly requirements by investors and register profits in the near future.
In conclusion, Snapchat’s current strategy, aiming at boosting advertising efficiency, shall be abandoned in favour of a larger scale. It is currently impossible to predict the company’s future moves, although what is certain is that the company’s possibilities are endless. This analysis shows that the firm has already started its shift to consumer products with the intention of truly becoming a camera company and that is what everyone should expect from it. Nevertheless, this explains the extremely its extremely high valuation, deriving entirely from its disruptive potential.
REFERENCES
Daft, R. L., & Lengel, R. H. (1986). Organizational information requirements, media richness, and structural design. Management Science, 32(5), 554—571. Source: http://pubsonline.informs.org/doi/abs/10.1287/mnsc.32.5.554
Arthur, W. B. (1990) “Positive Feedback in the Economy”, Scientific American, 262(2), 92. Source: http://www.jstor.org/stable/24996687
Katz, M. L., & Shapiro, C. (1994). Systems competition and network effects.The journal of economic perspectives, 8(2), 93-115. Source: http://www.jstor.org/stable/2138538?seq=1#page_scan_tab_contents
Lin, K. Y., & Lu, H. P. (2011). Why people use social networking sites: An empirical study integrating network externalities and motivation theory.Computers in human behavior, 27(3), 1152-1161. Source: http://www.sciencedirect.com/science/article/pii/S0747563210003766
Snap, Inc. (2017). From S-1 2017. Retrieved from SEC EDGAR website: https://www.sec.gov/Archives/edgar/data/1564408/000119312517029199/d270216ds1.htm
Kaplan, A. M., & Haenlein, M. (2010). Users of the world, unite! The challenges and opportunities of Social Media. Business horizons, 53(1), 59-68. Source: http://www.sciencedirect.com/science/article/pii/S0007681309001232,
Abbas, S., & Singh, A. K. (2014). Media Industry Trends and Dynamics: The Social Media Boom. Procedia-Social and Behavioral Sciences, 155, 147-152. Source: http://www.sciencedirect.com/science/article/pii/S1877042814057371
Global Social Media Statistics Summary 2017. (2017, May 17). Source: http://www.smartinsights.com/social-media-marketing/social-media-strategy/new-global-social-media-research/
Johnathan Galt Value, Growth, long-term horizon. (2017, May 04). Facebook Snaps Market Share With Instagram. Source: https://seekingalpha.com/article/4069277-facebook-snaps-market-share-instagram?page=2#
Kurt, D. (2014, September 02). Average Revenue Per User (ARPU). Source: http://www.investopedia.com/terms/a/average-revenue-user-arpu.asp
Oreskovic, A. (2017, May 10). Look at the big gap between Snapchat’s revenue per user and Facebook’s. Source: http://www.businessinsider.com/snapchat-arpu-versus-facebook-arpu-charts-2017-5?IR=T
The Value Investor Long/short equity, special situations, valueMarketplaceValue In Corporate Events. (2017, August 11). Snap Continues To Snap. Source: https://seekingalpha.com/article/4098203-snap-continues-snap?page=3
Snap Inc. Reports Second Quarter 2017 Results. (n.d.). Source: https://investor.snap.com/news-releases/2017/08-10-2017-210950357
Social Media Fact Sheet. (2017, January 12). Source: http://www.pewinternet.org/fact-sheet/social-media/
We Are Social Singapore Follow. (2017, January 26). 2017 Digital Yearbook. Retrieved August 20, 2017, Source:
Eyal, N., & Hoover, R. (2014).Hooked how to build habit-forming products. Princeton, NJ: Princeton University Press.
Short, J., Williams, E., & Christie, B. (1976). The social psychology of telecommunications. Hoboken, NJ: John Wiley & Sons, Ltd.
Goffman, E. (1959). The presentation of self in everyday life. New York: Doubleday Anchor Books.
[1] Andreas M. Kaplan, Michael Haenlein; Users of the world, unite! The challenges and opportunities of Social Media
[2] AMPU has been measured as: (Revenue – Expenses) / DAU.
Data regarding revenues, expenses and Daily Active Users have been taken from the S-1 filing.
[3] Source: https://www.cnbc.com/2017/05/10/snap-earnings-spectacles-sales-revenue-q1-2017.html
Cite This Work
To export a reference to this article please select a referencing stye below:
Related Services
View all


Related Content
All TagsContent relating to: "Business Strategy"
Business strategy is a set of guidelines that sets out how a business should operate and how decisions should be made with regards to achieving its goals. A business strategy should help to guide management and employees in their decision making.
Related Articles

DMCA / Removal Request
If you are the original writer of this dissertation and no longer wish to have your work published on the UKDiss.com website then please: