Unsupervised Root Cause Analysis of LTE Networks
Info: 8359 words (33 pages) Dissertation
Published: 16th Dec 2019
Tagged: Information Technology
- Why An Unsupervised Root Cause Analysis of LTE Networks?
Providing a good service to customer is the utmost priority of a mobile operator, on which their revenue is dependent on. Wireless networks today have grown in large size which makes management tasks difficult. To troubleshoot and recovery actions self healing (SH) architectures have been employed. Such SH uses cell level indicators (i.e. data collected by OAM task). The main barrier of this technique is that cell-level indicators represent statistical data, which do not suggest user level behavior and thus prevent the technician from being able to recognize the certain user-level performance resulting in unintended service disconnections, which is the potent reason users usually complain and periodically, lead them to change service provider.
Such user-level analyses have been performed by means of manual move tests. However, this is a time-consuming duty. As a result, experts have to personally go alongside a predefined course of action in order to manually make the user-level measurements. Thus, the hit or miss focuses specially on those areas sampled neglecting the rest of area. Furthermore, manual move test does not support operators to analyze the rule of the connection of each specific user. Given this condition, the Third Generation Partnership Project (3GPP) has standardized the automatic aggregation of user-level information by means of mobile traces and the minimization of drive test (MDT) [22]. In contrasting, traces and MDT manage cases are especially focused on troubleshooting and on analyzing the LTE radio access network (RAN) performance of a particular cell [23]. More especially, they had the means for experts to search the radio coverage, try new features, and conform or optimize their network parameters. furthermore include the analysis of user gadget when it does not operate correctly or the identification of network-wide issues that cause a consistent subscriber suffer some service degradation [24].
However, MDT solo automates trace collection, whereas posterior experiment of the traces for troubleshooting purposes is further a manual process. As a result, troubleshooting experts have to invest a lot of time in analyzing the mobile traces in verdict to seize the problems that each user has suffered over its connection. A thorough analysis go for user-level data would allow operators to look the cause for the release, which make out be coverage problem, unavailable cell, problems in authentication etc. We assume that the technicians collect the user level data and depending on this sampled data we analyze the problems. However we only consider certain samples and neglect the rest of the area. In certain cases, it is necessary to assume probability of a cause so all these systems come under supervisory actions,
Regarding the literature on SH, recent studies show the use of MDT to detect abnormally behaving cells in general [8] and to detect outage cells in particular [9]. Even though the analysis of outage is the most important problem, due to the great impact that it has on the network, there are more types of problems that are worth analyzing. Thus, unlike previous references, this article presents a method to not only detect abnormal behaviors, but also automatically identify a significant group of RF issues, defining the specific cause-indicator relation required to properly automate the root cause analysis. In this context, this article proposes a unified framework to diagnose the reasons for each user disconnection. This allows automatic discernment between problematic and non-problematic connections, and then focuses attention on the particular connection’s stage where the issue lies. Normally, when an undesirable release is caused by problems related to either software or protocols, the events are sufficiently explicit and clear on the cause. However, when there is a radio link failure and thus the release happens due to bad RF conditions, further diagnosis is required. Therefore, the proposed root cause analysis provides a technique to automatically identify the RF problem on the basis of the key indicators reported by the user just moments before the release happened. Then the proposed methodology aims to fully automate the diagnosis of those radio link failures, determining their reason, which is not reported by the RLF event [25].
Furthermore, this approach goes one step further than the RLF event use cases, identifying more variety of RF issues and automating the whole diagnosis process. Automatic root cause analysis is a part of self healing networks which focuses on identification of problems. In a mobile network when a particular call is disconnected abnormally, the service provider is unaware of the cause of disconnections. Providing a good service to users is the utmost priority of service provider on which their revenue is dependent on. Telecom Regulatory Authority Of India has carried out an audit between 3 to 5 May 2016, the result revealed that BSNL’s call drop rate reaches to 22.17% in Bhopal [18], such call disconnection result in poor service and thus affecting service providers revenue.
Thus we require an unsupervised method which can detect actual cause of problems without collecting such data manually with minimum or no user’s interaction. The overall objectives of our project would be:
- To provide unsupervised technique to determine root cause of call disconnections.
- To offer result of automatic root cause analysis of call drops for entire network as well as individual user.
- To find the exact faulty region where the call has been dropped.
- To make self healing networks more accurate.
- To meet the benchmark of TRAI.
CHAPTER 5
———– ————————————————————————————————————————-
LTE Traces and Events
- LTE Traces and Events
The LTE trace function is used to store radio measurements and signaling messages (i.e., events) in order to reflect user-level performance. Therefore, traces do not aggregate any information but instead record the user-specific values of each event (signal quality, serving cell name, etc.). An event is a report consisting of
data related to current system usage and documents all pertinent data regarding the process in question, such as status information (failure or success), a rough idea of the cause of a specific failure (e.g., cell unavailability), the instant when it happened, and even specific measurements and performance information (e.g., signal level, bit rate, timing advance). Those events can be grouped into two categories according to its
origin [Fig. 13].
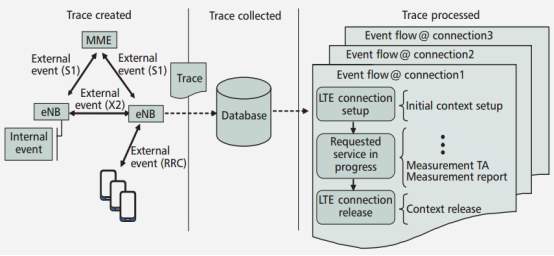
Figure.13 Event Flow of Connections
Internal Events: These events represent the performance of the base station (eNB) in the LTE system, so they are specific to each eNB’s vendor. Overall, internal events contain information related to all processes that take place at the cell or UE level and user measurements.
External Events: These events are external to the eNB and consist of the signaling messages that the eNB exchanges with the rest of the network equipment. Namely, external events are radio resource control (RRC) messages received from the UE through the LTE-Uu interface and protocol messages that the eNB exchanges [fig.14], other eNBs through the X2 interface, or the mobility management entity (MME) through the S1 interface. As a consequence, external events can be divided into three categories depending on the type of message they report.
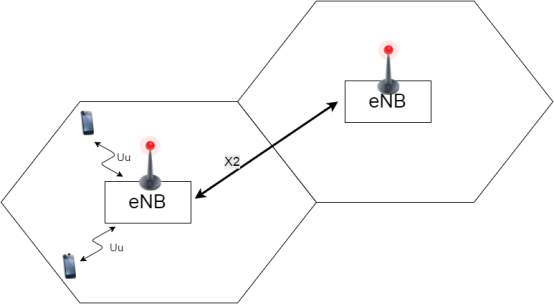
Figure. 14 LTE Interface
Among all types of events, only those chosen and activated by the operator are registered in a trace file. Operators need to find a balance between the amount of events they need to store in order to ensure accurate analysis and the cost of processing them. Note that the greater the number of activated events and traced cells, the greater the processing time. In particular, at each report period (e.g., 15 min), the eNB provides a file containing all received events [Fig.13]. Within these traces, two types can be distinguished depending on the scope of application
Cell Traffic Trace: Used to record all LTE activated events of all users (or a fraction of them) in the desired cells. Thus, they provide enough information to identify the existing problems in those cells and to analyze in detail the quality of the radio environment.
UE Trace: Only stores the events and the measurements of a specific user selected by the operator. Therefore, with this functionality, network operators can choose the user to be traced using the UE’s international mobile subscriber identity (IMSI) or international mobile equipment identity (IMEI). Given that the scope of this study is to analyze the termination of each user, both types of traces may be useful
5.1 RootCause Analysis at the UE Level
To identify the reason for a release and to perform a detailed diagnosis when that release is undesired, the end of the user’s connection should be analyzed. All events belonging to the same connection are aggregated and temporarily stored, building its event flow [Fig. 13]. In general, the event flow can be described in three different steps: first, the connection is established; second, the requested service is maintained and provisioned; and finally, the connection is released. In each of these stages, different protocols (e.g., RRC) and network equipment (e.g., MME) are involved; thus, identifying the phase in which the release occurs provides valuable information on what has happened.
Based on the event flow, UE releases can be grouped into three categories.
Normal Release: A normal release encompasses all releases that happen when the LTE service offered to the user has been completed. The event flow of a UE whose connection ends successfully has a Context Release event indicating that the release has been normal. There are different situations where the finalization of the LTE service is considered satisfactory. On one hand, a normal release occurs when no data is transmitted between the LTE network and the end user because either the user has been inactive during a long period (typically more than 10s) or its session has finished. On the other hand, a normal release can also be due to LTE deployment constraints. For instance, LTE networks that do not support voice call yet have to redirect users who request a voice call to one of the existing 2G/3G networks through the technology known as CS fallback.
Access Failure: It takes place in the connection setup phase, which implies that the user cannot obtain the requested service, so its event flow ends with an Initial Context Setup event with information about the cause of the failure. An access failure can occur due to several causes, including overload, no radio resources being available, no cell being available, authentication failure, and so on.
Dropped Connection : These are the abnormal releases that have negative impact on users because they occur while the requested service is in progress, so there are still buffered data to be transmitted at the time of the release. This kind of release can occur due to hardware errors, breakdown of the interfaces, and failures in any of the processes of the mobile network (e.g., handovers). All these releases can be diagnosed
based on the values of the Context Release event [26,27]. For instance, the connection can be released because of lack of available resources in the target cell during a handover or because a particular timer has expired. However, when the connection drops due to the quality of the air interface, the release cause in the Context Release event does not provide such detailed information. In this situation, the cause indicated by the Context Release event could be something generic, for example, Eutran Generated Reason or Radio Connection with UE Lost, and it may be accompanied by a Radio Link Failure event [25]. Thus, in order to explain the RF cause of these releases (coverage hole, LTE interference, etc.), further analysis based on user measurements needs to be performed.
5.2 Methods To Automate The Diagnosis
The automatic diagnosis of the radio cause can be addressed by using any classification system available in the literature. The difference is that instead of applying the classifier to the statistics from the OAM, as proposed in the literature, the inputs to the classifier will be the mobile traces. In particular, the aim of this diagnosis system is to identify the radio cause for each drop based on a set of standard indicators and measurements provided by the event flow. There are several diagnosis systems available in the literature. On one hand, a rule-based system is the simplest technique to automatically identify the radio cause and it does not require big computational capacity.
A more advanced automatic diagnosis system based on a probabilistic method such as Bayesian networks is proposed in for SH in mobile networks [13]. Both systems require the design of thresholds to analyze the input data. There are different ways of doing that, such as the percentile-based discretization (PBD) method proposed in [5]. This method consists on designing the threshold of each key performance indicator (KPI) based on their Xth percentile defined by the experts. That is, each threshold will take the Xth percentile of the KPI values in the training dataset. For instance, if the expert chooses percentage 90 for the reference signal received quality (RSRQ), its associated threshold is set to the 90th percentile of all the values of RSRQ in the dataset. On the other hand, the root cause analysis of radio problems can also be automated using either the ranking method [11] or a neural network such as the self-organizing map, which do not require any threshold to analyze the input data. Unlike the rule-based system, these methods are more complex and require more computational cost, but if they are properly designed on the basis of a good set of real samples or solved cases, the diagnosis success rate will be improved. Thus, among the available methods, the operator should select the most appropriate technique for its priorities, requirements, and available resources.
5.3 Indicators and Measurements
The proposed indicators are those that provide enough information to analyze the RF conditions of each user when its connection is lost. This information is taken from the required events that have happened just before the end of the event flow. For the proposed framework, only two events are required: the Measurement Report, which provides the reference signal received power (RSRP) and the reference signal received quality (RSRQ) of all the cells measured by the user; and the Measurement timing advance (TA) [28], which determines the value of the timing advance (TA), which represents the transmission delay in the downlink and uplink path between the user and its serving cell. Both the user measurement and its location can also be obtained from the Radio Link Failure event (RLF) [25]. Note that this event is only available when the user has experienced an RLF, so if the values reported by normal users are required in order to compare the values or design thresholds, they should be obtained from the Measurement Report and Measurement TA events. Furthermore, it is worth mentioning that the availability and accuracy of the location information depend on the used location estimation method and LTE release. For example, a precise location can be obtained when the Global Positioning System (GPS) system is available; otherwise, the position can be estimated from the TA. The proposed indicators are:
Serving RSRP: It is the signal strength that the UE measures from the serving cell when its connection finishes. A decrease of the RSRP can be caused by either an increase of the distance or obstacles on the path. Therefore, to distinguish between those situations, this indicator should be complemented with information about the separation between the UE and the site [29].
Serving RSRQ: The quality of the received reference signal from the serving cell is crucial to understanding the cause of the release. RSRQ is defined in [29] as the ratio of total reference power to the total received power within the measurement bandwidth [Eq.2].
RSRQ=
RSRPRSSI* N eq-(2)
Where, N is number of resource blocks over which Reference Signal Strength Indicator (RSSI) is measured and RSSI is total received wide band power by UE. It includes power from serving cell as well as co-channel interference & noise. It helps to determine interference & noise. Here note that when the noise and interference is added, the RSSI will increase which reduces RSRQ.
Strongest non-serving RSRP: The RSRP of the strongest cell (other than the serving one) is also important.It represents the best non-serving cell measured by the UE, thus providing additional information regarding the global LTE coverage. As the distance between UE and its client increases, the value of strongest non-serving RSRP will reduce.
Number of detected cells: The number of non-serving cells that the UE has measured at the time of the release indicates the number of cells that might cause interference to the user’s connection. Thus, this indicator allows areas with large cell overlaps to be distinguished [30]. This parameter is measured by UE which is also helpful while performing handover.
Relative TA: The radio cause also depends on the location where the release has taken place. Therefore, the TA is used to determine the distance between the UE and its serving cell. However, depending on the antenna configuration, height, and location, the service area will be different. This implies that users with the same TA but belonging to different cells could be considered to be near or far according to the service area. This means that the relative TA of the UE with respect to the service area of its cell should be considered. This requires identifying the real distance within which the majority of the users are served by a particular cell, so two regions can be differentiated: the cell center, where the UEs are considered to be near the cell, and the cell edge, where the farthest users are located. The border between those regions can be estimated as the Xth percentile (e.g., 98th) of all TA values reported in that cell. As a result, the relative TA is the ratio of the user TA to the estimated Xth percentile.
5.4 Measurements of RSRP, RSSI ,RSRQ And Timing Advance
Reference signal is used to estimate the channel impulse response (CIR), in other words for coherent demodulation synchronization is necessary. This problem can be solved by sending a known signal. Thus by using reference signal channel impulse response can be obtained. Note that reference signal is transmitted every 6 subcarriers [Fig. 14].
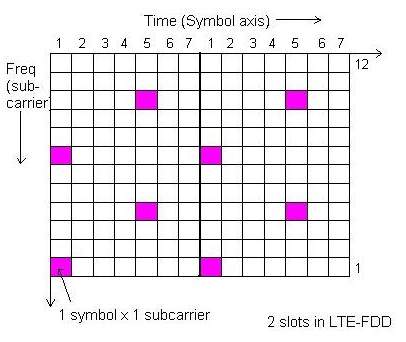
Figure. 14 Reference Signal In Resource Blocks
Lets try to calculate RSRP, RSSI and RSRQ for one very simple case of one resource block with 12 sub carriers and 0.5 ms in time domain. For sake of simplicity, lets assume the power of reference symbols (shown by pink square) and power of other symbols carrying other data channels (shown by white square) is same i.e. 0.021 watt
Since RSRP is linear average of downlink reference signal for given channel bandwidth therefore RSRP is given by eq.3
RSRP = 10*log (0.021*1000) = 13.2 dBm eq-(3)
While RSSI is total received wide-band power. Therefore we have to add power of all 12 carriers in the given resource block [eq.4]
RSSI = 10*log(0.021*1000)+10*log(12) = 24 dBm eq-(4)
RSRQ is now simple ratio of RSRP to RSSI with N=1 [eq.5]
RSRQ = 10*log(0.021/(12*0.021)) = -10.79 dB eq-(5)
When interference from neighboring cell increases the total received power i.e. RSSI increases. Note that as the total received power (RSSI) increases, the received signal quality degrades.
Timing Advance (TA):
TA is used in LTE for following reasons:
- Used to control uplink timing of individual UE.
- Ensures that transmission from all UE are synchronized when received by eNB.
- UE furthest from eNB requires a large timing advance to compensate for larger propagation delay.
The basic time unit is Ts which represents the sampling Time given by Eq.6:
Ts =
1(15Khz*2048)= 32.55 ns eq-(6)
Where 15 Khz is frequency spacing and 2048 is IDFT size.
The timing advance command indicates the change of uplink timing which is multiple of 16Ts
Timing advance of 1 corresponds to : 1* 16 * Ts =0.520 µs.
Thus distance can be calculated given by Eq.7:
Distance =.
(3*108) * 0.520 µs2= 78.12 m eq-(7)
Timing advance of 300 corresponds to : 300* 16 * Ts =156.24 µs.
Thus distance can be calculated as:
Distance =.
(3*108) * 156.24 µs2= 23.43 Km
Timing advance of 900 corresponds to : 900* 16 * Ts =468.72 µs.
Thus distance can be calculated as:
Distance =.
(3*108) * 468.72 µs2= 70.30 Km
Similarly Timing advance of 1282 corresponds to: 1282* 16 * Ts =667.66 µs
Thus distance can be calculated as:
Distance =.
(3*108) * 667.66 µs2= 100.1 Km
For our study, we require TA for timing delay only, i.e. how much the user is close to the current and strongest non-serving base station.
CHAPTER 6
6. Radio Causes
When analyzing the RF conditions of the UE at the time of the release, different radio causes can be found related to both coverage and interference. The specific features of those radio causes along with the expected behavior of the indicators are detailed below and summarized in Table 2.
| Radio Cause | Serving
RSRP |
Serving RSRQ | Strongest RSRP | Number of Cells | Relative
TA |
| CH | < ThrRSRPB | < ThrRSRQ | < ThrRSRPB | < ThrNC | < ThrTA |
| CE | < ThrRSRPB | < ThrRSRQ | – | – | ≥ ThrTA |
| LD | <ThrRSRPB | < ThrRSRQ | < ThrRSRPB | ≥ ThrNC | < ThrTA |
| MP | < ThrRSRPG | < ThrRSRQ | Better
than serving |
– | < ThrTA |
| I | ≥ ThrRSRPG | < ThrRSRQ | – | – | < ThrTA |
Table no.2 Relation between radio causes and indicators
Coverage Hole (CH): It is an area where both the serving and the strongest RSRPs are insufficient to provide and maintain the LTE service with the quality requirements; specifically, they are below the threshold under which values of RSRP are considered bad (ThrRSRPB). This lack of signal power in a zone of the coverage area can be caused by inadequate antenna parameters, wrong RF planning, or physical obstacles. Furthermore, the quality of the serving cell is beneath its corresponding threshold (ThrRSRQ). An area with these RF conditions (low RSRP, low RSRQ, and low strongest RSRP) is considered to be a coverage hole provided that it is located within the coverage area. Thus, the operators should define the threshold ThrTA to determine the border between cell edge and cell center. The lower the ThrTA, the lower the percentage of serving area is considered as a cell center. In addition, since a CH is characterized by low overlap of cells, the number of cells detected by the UE should be lower than the specific threshold (ThrNC).
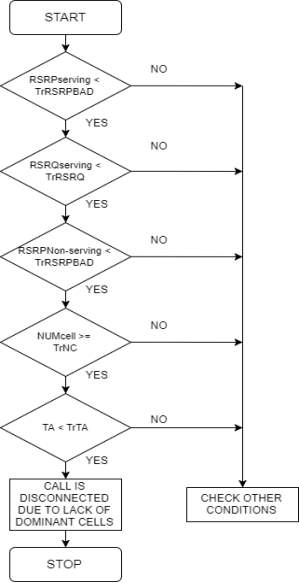
Lack of Dominant Cells (LD): This problem takes place in an interference-limited environment within the cell center of the serving cell, where there are no dominant cells, including the server. Consequently, the user’s relative TA is lower than the TA threshold, and the excessive overlap between LTE cells can be identified when the UE measures a high number of LTE cells (higher than the threshold). Nevertheless,
none of them provides a clear and powerful signal for maintaining the connection (the RSRP of both serving and strongest cells and the serving RSRQ are below the thresholds), and thus the service fails. In some situations, CH and LD can be very similar; however, they can be dis tinguished by either the high overlap (LD) vs. regions that are covered by a few cells (CH). The number of measured cells determining high overlap (ThrNC) is decided by the operator on the basis of the network requirements.
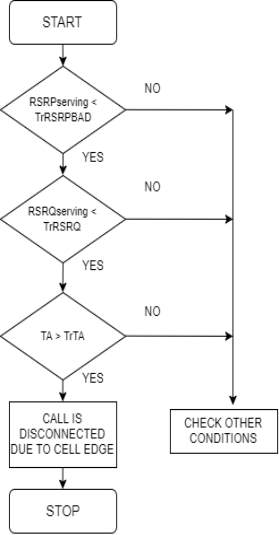
Cell Edge (CE): The serving RSRP and RSRQ are below the specified thresholds mainly because of the high propagation loss caused by excessive distance between the base station and the UE. Therefore, the relative TA is the key indicator to distinguish the CE from the rest of these situations. In particular, it should be above the considered threshold. It can reasonably be expected that users at the CE measure other cells, so the value of the strongest RSRP and the number of measured cells are not considered relevant.
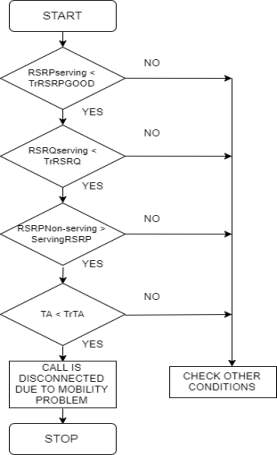
Mobility Problems (MP): The release is caused by MP when the user may not have sufficient signal strength or quality to maintain the session (i.e., serving RSRP below ThrRSRPG and RSRQ below ThrRSRQ). However, there is another cell that could have continued its session avoiding the abnormal release (i.e., the strongest RSRP is better than the serving one), but the user does not carry out the handover to the strongest cell and the connection drops. In this situation the value of relative TA should be small (i.e., below its threshold) in order to ensure that the user is not very far in relation to the coverage area of its serving cell (where the propagation delay could be too high to allow a successful communication with the serving cell to perform a handover). Unlike the other problems, the number of cells is not necessary.
Interference (I): A user suffering from I has an RSRP above the threshold, but its connection is lost due to bad quality of the air interface. Therefore, the serving RSRQ is lower than the corresponding threshold. The number of cells measured by the user could differ considerably, so this indicator is insubstantial for this radio cause.
However the false positive rate increments as any of the thresholds turn out to be less strict [30]. Since the system scope zone may have diverse reach-ability at various cells, we propose distinctive thresholds rather than a single threshold considering nearby local working conditions. Thus, threshold values of various parameters such as RSRP, RSRQ, number of detected cells and timing advance have been set by various experiments conducted by network operator’s technicians and may not be same for all the cells. However we have shown the output of both cases i.e. similar threshold for all the cells as shown in Table 3 which is also compared with live network and threshold values of three cells which are obtained individually are shown in Table 4.
| Parameter | Simulated network | Live network |
| Grid | Urban area | Urban area |
| Number of sites | – | 25 |
| Number of macrocells | – | 75 |
| System bandwidth | 1.4 Mhz | 10 Mhz |
| Max. transmit power | 43 dBm | 46 dBm |
| Handover margin | – | 2 dB |
| Trace reporting Period | 1 simulation loop
(18000 simulation steps) |
15 min |
| Observation period | 4 simulation loops | 11:00-14.00 |
| Days under observation | – | 4 |
| Thr RSRPG | -86 dBm | -86 dBm |
| Thr RSRPB | -111 dBm | -111 dBm |
| Thr RSRQ | -7.5 dB | -7.5 dB |
| Thr NC | 3 | 3 |
| Thr TA | 1 | 1 |
Table no.3 Parameters of LTE Network
Thus, different cells are now configured with different threshold values that are obtained by technicians because of divers reach-ability depending on local conditions.
| Parameters | Cell 1 | Cell 2 | Cell 3 |
| Max Transmit Power | 45 dBm | 47 dBm | 43 dBm |
| Trace Report Period | 1 simulation loop | 1
simulation loop |
1
simulation loop |
| Thr RSRPG | -84 dBm | -80 dBm | -82 dBm |
| Thr RSRPB | -108 dBm | -110 dBm | -102 dBm |
| Thr RSRQ | -7.6 dB | -8 dB | -7.2 dB |
| Thr NC (Number of cells detected by UE) | 3 | 4 | 3 |
| Thr TA (Timing advance) | 1 | 1 | 1 |
| System Bandwidth | 5 MHz | 10 MHz | 4 MHz |
Table no. 4. Thresholds for three different cells
CHAPTER 7
Diagnosing User Disconnections Using Simulator
7. Diagnosing User Disconnections Using Simulator
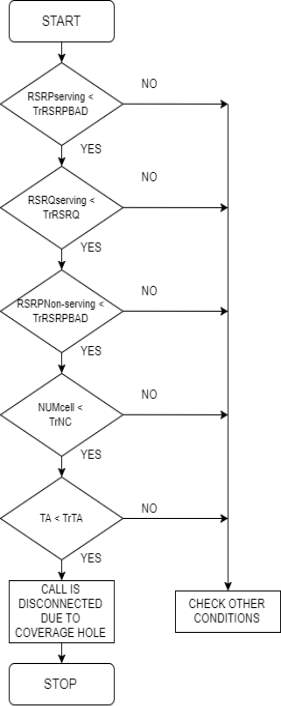
Once the theoretical basis of the framework has been presented, in this section, the method is evaluated using both simulated and real data. In particular, the aim of this feasibility study is to illustrate how the proposed framework works, showing the usefulness and potential of automating the diagnosis of user disconnections using mobile traces. The rule-based system has been chosen among all automatic classification systems proposed in the literature due to its simplicity and similarity with the human thought process. It is characterized by being analogous to the current manual procedure carried out by experts, and thus it provides the diagnosis in a similar manner to human thinking. As a result, the rule-based system is especially suited for demonstrating the proposed framework, providing a straightforward evaluation and easy-to-understand results. To automate the process with a rule-based system, the criterion of each radio cause is translated in terms of IF…THEN rule. In particular, each rule is easily designed on the basis of the relation between the radio causes and indicators (presented in Table 2). For instance, the rule of CH [Fig. 15(a)] would be like this:
“IF (RSRPServing < ThrRSRPB) AND (RSRQServing < ThrRSRQ) AND
(RSRPNon-Serving < ThrRSRPB) AND (NumCell < ThrNC) AND (TARel < ThrTA),
THEN (Radio Cause is Coverage Hole).”
Finally, the required thresholds for the RSRP and RSRQ indicators have been set automatically through the percentile-based discretization (PBD) method [12]. However, the thresholds of the other indicators (NumCell and TARel) have been set according to the operator’s strategy, which defines the acceptable level of overlap (i.e., the number of detectable cells) and the adequate distance to the cell border (e.g., ThrNC = 3 and ThrTA = 1, in this study). The flowchart for radio cause CH is shown in fig.14.
In order to prove the automatic root cause analysis, a real LTE network from an urban area has been simulated with MATLAB simulator. Furthermore, the specific simulation parameters are presented in Table 3. Among all of them, different cells have been configured to have a specific RF problem, which facilitates the analysis of each of them individually.
The rule of CE [Fig. 15(b)] would be like this:
“IF (RSRPServing < ThrRSRPB) AND (RSRQServing < ThrRSRQ) AND
AND (TARel > ThrTA),
THEN (Radio Cause is Cell Edge).
(b)
(a)
Fig.15 Flowchart of (a) Coverage Hole and (b) Cell Edge cause
The rule of LD [Fig. 16(a)] would be like this:
“IF (RSRPServing < ThrRSRPB) AND (RSRQServing < ThrRSRQ) AND
(RSRPNon-Serving < ThrRSRPB) AND (NumCell ≥ ThrNC) AND (TARel < ThrTA),
THEN (Radio Cause is Lack of Dominant Cell).”
(b)
(a)
Fig.16 Flowchart of (a) Lack of Dominant Cell and (b) Mobility Problem cause
The rule of MP [Fig. 16(b)] would be like this:
“IF (RSRPServing < ThrRSRPG) AND (RSRQServing < ThrRSRQ) AND
(RSRPNon-Serving > ServingRSRP) AND (TARel < ThrTA),
THEN (Radio Cause is Mobility Problem).”
The rule of I [Fig. 17] would be like this:
“IF (RSRPServing ≥ ThrRSRPG) AND (RSRQServing < ThrRSRQ) AND
(TARel < ThrTA),
THEN (Radio Cause is Interference).”
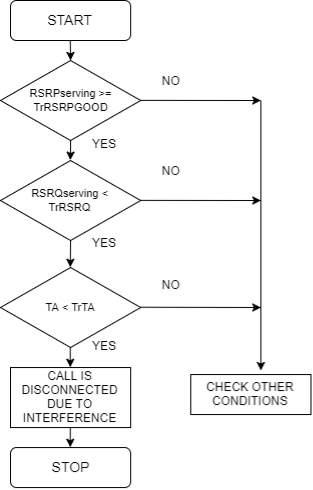
Fig.17 Flowchart of Interference
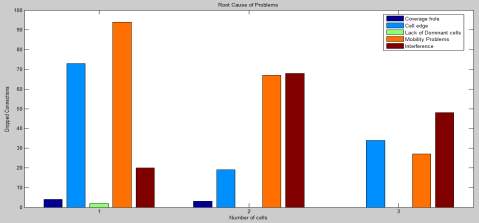
Figure. 18 Identifying Radio Causes with Same threshold
Results of the automatic root cause analysis with same values of threshold for all the cells are shown in Fig 18 .The proposed method has been used to identify the cause of each abnormal release that took place in those problematic cells. It is important to note that the design of thresholds through the PBD method depends on the specified Xth percentile and the characteristics of the dataset. In addition, since the performance of the rule based system depends on the designed thresholds, a sensitivity analysis has been performed.
By comparing the results of the diagnosis for each radio cause with the best ones, it is seen that the false positive rate slightly increases when any of the thresholds becomes less strict (e.g., I when ThrRSRPG = 80th). Conversely, as the thresholds are more strict, the activation of the rule is more difficult, so the true positive rate decreases .Service provider’s technician have to decide the threshold values for each cell which reaches a compromise between false positive rate and true positive rate. Based on this evaluation, the rest of the analysis has been performed with that configuration of thresholds; their values are shown in Table 3 and Table 4.
DETERMINING FAULT LOCATION
The fault location of client can be decided using GPS which is considered as mostly known localization technique [31]. However when GPS is not accessible, other technique such as received signal strength indicator (RSSI) based location determination system [32] can be used by service provider. We propose to maintain a database acquiring the client location towards the end of call instead of obtaining location at call connection request to get a correct area at which fault has occurred.
Since the system scope zone may have diverse reach-ability at various cells, we propose distinctive thresholds rather than a single threshold considering nearby local working conditions thus varying the result of simulation. These values need to be obtained carefully by service providers technician. In Fig. 20, the disconnections that happened in Cell1, Cell2 and Cell3 have been represented over the LTE network. The diagnosed radio cause is plotted with different specific colour.
Cell 1: By carefully looking at the dropped connections of Cell1 it can be seen that there is a high concentration of call drops due to cell edge and mobility problems followed by interference. Call drops due to coverage hole and lack of dominant cell is not of much concern
Cell 2: There might be a large interference source near the user which causes dropped calls thus the major cause of call drops in this cell is interference followed by mobility problems.
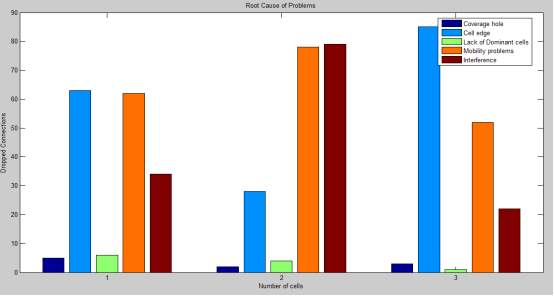
Fig.19 Result of automatic root cause analysis with different thresholds
Cell 3: Here, the majority users are suffering from cell edge problem followed by mobility problems.
Note that higher the number of customers larger will be the processing time. Network operator has to decide whether he wants to analyze the entire network shown in Fig.19 or individual user shown In Fig.20 (a).
If network operator decides to know the call drop reason of individual user, then he can use International Mobile Subscriber Identity (IMSI) or International Mobile Equipment Identity (IMEI) number of user equipment (UE) which is unique in nature after which , service provider can obtain the individual user’s location from database to determine the faulty region [Fig.20 (b)]
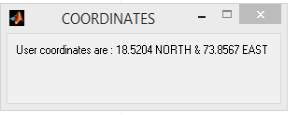
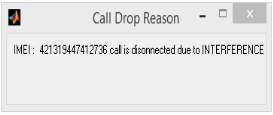
(a)
(b)
Fig.20 (a) Call Drop Reason and (b) Coordinates of Individual Client
Thus, by looking at results a network operator can get an idea about call drops in a network and their specific reason along with fault location using which a network operator can improve the service provided to the clients. The result will also help service provider to meet the benchmark of TRAI .
CHAPTER 8
Applications and Future Scope
8. Applications & Future Scope
Automatic root cause analysis is a part of self-healing network, which is basically focusing on identification of problems at user level. The goal is to improve the accuracy of system which is not achieved in manual drive test method which collects limited sample data neglecting the rest of area. This technique can be used by all LTE operators to enhance the service provided to customer resulting in a increased revenue.
Proposed system not only identifies the exact cause of dropped call but also determines the faulty location at which call has been dropped. Further we can motivate researcher to develop the mechanism to improve the performance of system by taking automatic action in case failure.
The chosen automatic classification system is the simplest one and it uses crisp thresholds, which makes the proper identification more difficult. More sophisticated diagnosis systems should improve those results. In spite of this, the obtained error rate is comparable to that obtained by a human expert.
Another modification can be estimating the exact location of faults using GPS or any other techniques so that service provider can improve the service even further.
Conclusion
An automatic method for root cause analysis of user disconnections has been presented. In particular, this article details an approach based on traces to identify the cause of the release, with a particular emphasis on abnormal release due to RF issues.
In addition, the main challenges of using data traces and performing the diagnosis
at the user level are addressed. Through the use of mobile traces, the automatic diagnosis can be performed almost in real time, providing plenty of detail on the problems in the mobile network eliminating the need to collect data manually.
Proposed strategy only requires a few standard indicators to determine the RF problem. Therefore, with this system the automatic diagnosis of self-organizing networks is substantially improved. The RF classification of the proposed technique has been assessed through a rule-based system in a real and simulated LTE network.
The obtained results show the advantages of knowing the specific radio causes of the problems that adversely affect each user in each location and how the proposed root cause analysis provides sensible and coherent classification.
References
[1] 3GPP, “Self-Organizing Networks (SON); Concepts and Requirements,” TS 32.500
[2] NEC, “Self Organizing Network: NEC’s Proposals for Next-Generation Radio Network Management,” Feb. 2009; http://www.nec.com
[3] NGMN Alliance, “Recommendation on SON & O&M,” 2008.
[4] Self-Organizing Networks (SON); Self-healing concepts and requirements, version 11.0.0 (2012-09),” Third-Generation Partnership Project, Sophia Antipolis Cedex, France, 3GPP TS 32.541.
[5] R. Barco, P. Lázaro, and P. Muñoz, “A Unified Framework for Self-Healing in Wireless Networks,” IEEE Commun. Mag., 2012, pp. 134–42
[6] O. Sallent et al., “A Roadmap from UMTS Optimization to LTE Self-Optimization,” IEEE Commun. Mag., vol. 49, no. 6, June 2011, pp. 172–82.
[7] H. Hu et al., “Self-Configuration and Self-Optimization for LTE Networks,” IEEE Commun. Mag., vol. 48, no. 2, Feb. 2010, pp. 94–100.
[8] G. D. J. Turkka, T. Ristaniemi, and A. Averbuch, “Anomaly Detection Framework for Tracing Problems in Radio Networks,” Proc. 10th Int’l. Conf. Networks, 2011.
[9] J. Turkka et al., “An Approach for Network Outage Detection from Drive-Testing Databases,” J. Comp. Networks and Commun., 2012.
[10] Samira Rezaei, Hamidreza Radmanesh, Payam Alavizadeh, “Automatic Fault Detection and Diagnosis in Cellular Networks Using Operations Support Systems Data,” IEEE/IFIP Network Operations and Management Symposium., 2016, pp. 468-73
[11] P. Szilágyi and S. Nováczki, “An automatic detection and diagnosis framework for mobile communication systems,” IEEE Trans. Netw. Service Manage., vol. 9, no. 2, pp. 184–197, Jun. 2012
[12] R. M. Khanafer et al., “Automated Diagnosis for UMTS Networks Using Bayesian Network Approach,” IEEE Trans. Vehic. Tech., vol. 57, no. 4, 2008, pp. 2451–61
[13] R. Barco, V. Wille, L. Díez, and M. Toril, “Learning of model parameters for fault diagnosis in wireless networks,” Wirel. Netw., vol. 16, no. 1, pp. 255–271, Jan. 2010
[14] G. A. Barreto, J. C. M. Mota, L. G. M. Souza, R. A. Frota, and L. Aguayo, “A new approach to fault detection and diagnosis in cellular systems using competitive learning,” in Proc. VII Brazilian Symp. Neural Netw., 2004, pp. 1–6
[15] A. Gómez-Andrades et al., “Automatic Root Cause Analysis for LTE Networks Based on Unsupervised Techniques,” IEEE Trans. Vehic. Tech., 2015, pp. 2369-86
[16] Małgorzata Steinder and Adarshpal S. Sethi, “Probabilistic Fault Localization in Communication Systems Using Belief Networks,” IEEE/ACM Transactions On Networking, Vol. 12., 2004 809-22
[17] Jessica Moysen and Lorenza Giupponi, “A Reinforcement Learning based solution for Self-Healing in LTE networks,” IEEE Trans. Vehic. Tech., 2014, pp. 2369-86
[18] TRAI, “Report on Independent Drive Test”, June 2016
[19] “An Introduction to LTE”. 3GPP LTE Encyclopedia. Retrieved December 3, 2010.
[20] Hyung G. Myung, Junsung Lim, and David J. Goodman, “Single Carrier FDMA for Uplink Wireless Transmission”, IEEE Vehicular Technology Magazine, vol. 1, no. 3, Sep. 2006, pp. 30–38
[21] LTE Frame Structure and Resource Block Architecture Teletopix.org, retrieved in August 2014.
[22] 3GPP, “Universal Mobile Telecommunications System (UMTS); LTE Universal Terrestrial Radio Access (UTRA) and Evolved Universal Terrestrial Radio Access (E-UTRA); Radio Measurement Collection for Minimization of Drive Tests (MDT); Overall description; Stage 2,” TS 37.320.
[23] Johansson et al., “Minimization of Drive Tests in 3GPP Release 11,” IEEE Commun. Mag., vol. 50, no. 11, Nov. 2012, pp. 36–43.
[24] 3GPP, “Telecommunication Management; Subscriber and Equipment Trace: Trace Concepts and Requirements,” TS 32.421.
[25] 3GPP, “Technical Specification Group Radio Access Network; Study on Minimization of Drive Tests in Next Generation Networks,” TR 36.805
[26] 3GPP, “Evolved Universal Terrestrial Radio Access (E-UTRA); S1 Application Protocol,” TS 36.413
[27] 3GPP, “Evolved Universal Terrestrial Radio Access (E-UTRA); X2 Application Protocol,” TS 36.423.
[28] 3GPP, “Physical Layer procedures,” TS 36.213.
[29] 3GPP, “Physical Layer; Measurements,” TS 25.215.
[30] Ana Gómez-Andrades et al.,“Automatic Root Cause Analysis Based on Traces for LTE Self-Organizing networks,” IEEE Wireless Communications, June 2016 ,pp. 20-28.
[31] P. Enge and P. Misra, “Special issue on GPS: The Global Positioning System,” Proceedings of the IEEE, January 1999, pp. 3–15,.
[32] Mohamed Ibrahim and Moustafa Youssef, “CellSense: A Probabilistic RSSI-based GSM Positioning System,” IEEE Globecom, 2010
Cite This Work
To export a reference to this article please select a referencing stye below:
Related Services
View all


Related Content
All TagsContent relating to: "Information Technology"
Information Technology refers to the use or study of computers to receive, store, and send data. Information Technology is a term that is usually used in a business context, with members of the IT team providing effective solutions that contribute to the success of the business.
Related Articles

DMCA / Removal Request
If you are the original writer of this dissertation and no longer wish to have your work published on the UKDiss.com website then please: