Road Safety Data Analysis and Evaluation Using Accident Database
Info: 12080 words (48 pages) Dissertation
Published: 3rd Sep 2021
Tagged: TransportationHealth and Safety
ROAD SAFETY DATA ANALYSIS AND EVALUATION USING ACCIDENT DATABASE
ABSTRACT
Accidents are events that are unfortunate, occur unexpectedly and unintentionally due to several variables, and result in damage to individuals and property. Such unplanned events can be prevented if circumstances and problems for possible outcomes can be recognized beforehand and effective counter measures taken to prevent it or reduce the impact of its occurrence.
The study provides a brief overview of road accidents statistics for Non-Built up roads, Motorways and Built up roads of Great Britain for the latest dataset published from 2012-2016.
The UK has several roads that can be considered dangerous and accident-prone even though it has one of the lowest rates of road accidents in the world. Considering that Britain had one of the safest road network in the world, accident rates seemed to have stopped reducing with safety practices, infrastructure and countermeasures in place.
High rates of road traffic accidents in built up roads presents a clear picture of violation of traffic discipline with the situation remaining stagnant throughout the past 7 years, not only in terms of the amount of people killed or injured.
An attempt has been made in the dissertation to find trends in British traffic accidents from data analysis of the road accident database published by the dft (department of transport).
and built up road to identify missed trends which could help decrease Britain’s low but stagnant road accident rates. In addition, an attempt to find out trends of accident data in built up roads in conjunction with factors such as road speed limits, weather conditions, road surface condition, junction types and severity of accidents.
Appropriate counter measures can then be suggested from analysis of road safety data to further improve Britain’s road safety.
Table of Contents
Abstract 2
Introduction 4
Literature Review 6
Research Methodology 10
Analysis of Road Accident Data 15
Discussion 34
Conclusion and Recommendations 37
INTRODUCTION
BACKGROUND
Road traffic safety has improved in the UK in recent years; the amount of casualties of all severity could be reduced even further. Through government reports, it can be seen that Built up and Non-built up roads account for the majority of road accidents and casualties in the UK. In 2016, the number of total accidents across built up and non- built up roads had increased with these roads contributing to the majority of fatalities and all other severity of casualty. Although motorways allow for travel at higher speed, they only contributed to 5% of total road casualties in 2016 within GB. In built up regions, the rate of road accidents of GB is greatest.
To enable development of realistic quantitative safety targets, followed by the design of effective strategies, it is paramount that safety developments be measured in order to understand the underlying problem and causes. Extensive and reliable data recorded over a long period will be required. The data will also need to be suitable for interpretation and preferably forecasting of safety developments.
To enable the development of safety improvements and be able to understand the situation of the road accidents within the area under investigation, trend analysis of road accidents in the chosen area is key.
Why use data analysis:
Data analysis is important for implementing essential countermeasures for road traffic accidents. It allows analyzation of historical data and allows the topics to be addressed from a different point of view. Although the external validity of data analysis can be questioned, they are useful since the data itself is of the real world.
Since the amount of casualties and reported accidents have decreased since, the issue most frequent and challenging within the transportation industry is safety with built up roads and urban environments a constant problem.
1.2. Motivation of Study
The study consists of data associated with built up roads (up to 40 mph) in GB. The goal of the study is to encourage the improvement of road safety by analysing several factors that can affect safety in Built up roads. The project aims to utilise related literature along with analyzation of roads to discern any continuously trending factors, which may influence Road Safety and accident rates within the United Kingdom.
1.3. Research Aim
To find, analyse and evaluate trends in road accident data to suggest possible countermeasures to improve road safety in the UK through prevention or reduction of its impact.
1.4 Research Objectives
The objectives of this dissertation are mainly the following:
- Gather a comprehensive database of road accident statistics for built up roads with factors that affect road safety which have been provided by the database.
- Analyse data for the factors, which can impact accident rates (e.g. light conditions, weather, road surface conditions, types of junctions etc.)
- Determine type of road classes with highest and lowest amount of accident rates from analysing tables of road accident statistics and charts created from the database (STATS19)
- Suggest appropriate measures for the factors and the road class determined the most dangerous
2. Literature Review
2.1 Introduction
Although the amount of road accidents and casualties amongst all road types have gradually started decreasing, built up roads are still the major contributors to road accident and casualties in Britain. Built up roads accounted for 72% of road casualties of all severities in Britain for 2016. Additionally, in 2016, built up roads accounted for 789 out of 1792 road deaths in Britain. While accounting for 44% of all fatalities in GB by road type and 66% of seriously injured and 73% of slight injury combined (Dft, Annual Report, 2016). The road type itself accounted for 72% of road casualties of all severities in Britain for 2016.
Comparing it with previous years, there has been a rise in the total number of fatalities of 9 per cent and a fall in slight injury of 7 percent on 30 mph roads while there were falls of 12 percent and 5 percent respectively for fatalities and slight injuries on 40 mph roads.
Pedestrians and bicyclists make up the majority of victims in built up roads. A lack of an outer body or protective shell may have lead to their increased percentage in greater severity types for these casualties. This amount of casualties for all severities could be reduced by improvements in road design, traffic management and enforcement of stricter laws. This will require the public sector to be committed and adequately financed and be capable of taking comprehensive action. The literature review will consist of severity of accidents, common factors that affect road accident rates along with casualty rates.
2.2 Key words and definitions related to accidents and accident classifications
2.2.1 Definition of Accident
Accidents are a general phenomenon. They can occur randomly due to certain factors such as human and mechanical errors where very little can be done since there are no-counter measures that can be taken to remedy this. Since humans are the casualties and involved as the one who can cause accidents randomly, accidents could take place even in well-designed high standard roads. However, when accidents do occur systematically/deterministically, counter measures can be taken appropriately to decrease the chances of accidents. To undertake appropriate counter measures, accident study is essential.
2.2.2 Classification of Accidents
Main Classification
- Road accident with casualty
- Road accident without injury
- Road accident with casualty:
Fatal : Incident involving person’s death
Serious; Incident involving an individual’s hospital admission due to severity of injury
Slight: Where an individual involved is involved in an accident but isn’t injured enough to be considered serious
- Property damage: Road traffic Accident with no injuries
Lower classification
Location: Built up or non-built up
Incident with collision of without collision
Vehicles involved: One vehicle or multi vehicle accident
Vehicle accidents classification based on collision type
- Right angle collision
- Over turning Accidents
- Striking carriage way objects
- Striking objects outside carriageway
- Collision with stationary vehicle
- Sideswipe
- End to End
- Head to head
- Head to end
Source: CE 451: transportation engineering III: Traffic Planning and Management
2.2.3 Key Terminology
Crashes and Casualties:
Traffic safety researchers measure crashes (also called collisions, accidents or incidents), injuries, fatalities and damages. Injuries and fatalities together are called casualties. Many road safety experts prefer the term crash to accident, because “accident” implies a random event, while “crash” emphasizes that such events have a cause (driver error, mechanical failure, poor roadway design, etc.) and so are preventable.
Fatal : Incident involving person’s death
Serious; Incident involving an individual’s hospital admission due to severity of injury
Slight: Where an individual involved is involved in an accident but isn’t injured enough to be considered serious
Casualties of accidents:
Individuals whose are dead or injured due to an accident.
Grouping Accident Factors
- Road Users: Individuals utilising the road as mode of transport (e.g. Pedestrians, Cyclists, Motor Cyclists, Drivers, passengers etc)
- Vehicles: Design condition and faults of vehicles
- Road Environment: Road side environment and its planning, design and care
Others:
Road User’s behaviour
Driver’s Behaviour
Pedestrian Behaviour
Passenger’s Behaviour
- Behaviour of Drivers
Inability in maintaining a safe reasonable speed
Inability in maintaining safe headway
Being occupied or distracted in the car while performing manoeuvres (e.g. changing of lanes, overtaking, while crossing a roundabout or junction. Turning etc)
Pedestrian Interaction while driving
- The physical and mental condition of drivers can affect accident risk
Sex
Driver’s age
Material status
Alcohol levels in the body
Use of drugs
Exhaustion
- Behaviour of pedestrians
Attitudes towards drivers and traffic rules
Amount of knowledge on traffic rules
Unawareness while crossing (no looking around)
Not using pedestrian mode of travel along the side of the road in footpaths
Speed miscalculation of on-coming traffic and vehicles
4. Behaviour of passengers
Distracting the driver
Making loud noise impairing driver’s hearing on junctions with limited view
Projecting their body outside the vehicle
Exiting vehicle on the side of potential on-coming traffic
Road related factors
Road surface conditions
Curvature
Alignment (Horizontal and vertical)
Line of sight
Width of carriageway
Road marking and signs
Pavement surface condition
Formation delineators and guardrails
Light conditions
Type of junction
Source: CE 451: transportation engineering III: Traffic Planning and Management
2.4 EXAMPLES OF NINE CLASSES OF ACCIDENT LOSSFACTORS
Designation Examples
1) Human………………. Seatbelts not worn properly
2) Vehicle………………. Failure of breaks
3) Road Environment………….Roadway surface conditions (slippery)
4) Human……………….. Fatigue leading to sleep
5) Vehicle……………….. .Vehicle’s structural vulnerability on the side
6) Environment…………..Sign post that is unyielding (post – crash)
7) Human………………. Provision of improper first aid by bystanders
9) Road Environment………….Unavailability of emergency telephone
Source: SNPA Foundation Seminar Book by Paul H. Wright
2.5 ACCIDENT REPORT FORM
For most purposes, the database needs to be able to answer the following questions:
- Place of accident
- Time of accident
- Individuals involved
- Results of collision
- Environmental conditions at sight and time of accident
- Cause of accident
3. Research Methodology
Data Collection and Methodology
3.1 INTRODUCTION
Accident Data Analysis is paramount importance to improve safety. Accident related information like accident Severity (Fatal ,Serious and slight Accidents), type of junction, no of intersections, roadway geometry, road surface conditions, weather conditions and traffic are required.
All parameters required were not taken into consideration due to their importance. Taken into consideration all parameters would have made this study and its results more accurate.
This chapter comprises accident data analysis depending on Accident severity (Fatal Accidents, Serious Accidents, and Slight Accidents), type of junction, no of intersections, roadway geometry, road surface conditions, weather conditions and traffic are required.
3.2. Data Collection
Road accident data is reported by DFT using an Accident Reporting Form. This form, is completed for each road accident case. The data is entered into an electronic database after completed forms are compiled.
The software used to compile the database is known as CRASH.
In Britain, development of accident database still depends on police reported accident form. However accident database could not get comprehensive and accurate level up to expectation due to underreporting and under recording. This problem could be addressed by our combined effort. Training and awareness is urgent need to improve present situation.
3.3 METHODOLOGY
3.3.1 Research methodology
3.3.1.1 Obtaining Data
Since extensive accident data including road classifications such as accidents statistics for built up roads, non-built up roads and motorways are required, the stats 19 database will be used. Various forms of RAS (Road accident statistics) will be looked into to find data involving the classification of road mentioned in conjunction with each factors that can affect road safety such as light conditions, road surface conditions, weather type, severity of accidents, types of junctions within the road type. Data will be organized in tables with accident rates, percentage of accident contribution of each factor to the different classification of roads.
3.3.1.2 Determination of road type through data analysis
Road classification provided by the stats19 database will be utilized to determine which classification of road will be analysed further. To achieve this, data obtained from stats 19 will be utilized with tables formed for each road type and the accidents rates for each classification of road. This will include built up roads, non-built up roads and motorways and there accident rates over a recorded five-year span with the spans for each road type all commencing from the same year and ending five years later in the same year too. The reason behind this is to make the results for accident rates of each road class fair since there will be variations in accident rates for each road class in each year. Previous years may have higher or lower rates and comparing accident data of a selected year for a road class to a different year not within the limit of the five year span for another road class will make the results and the study unreliable. Comparing accident rates of the same year for different road classes will ensure increased reliability of the results of the study and ensure that the road class that is actually most dangerous out of the three is selected for further analysis. To determine which road type is the most dangerous, the total number of accidents, along with the amount of high severity for the 5 years will be compared for all three road classes with the class being deemed the most dangerous road class having the highest number of accident rates in the most severe accident types (fatal, serious) etc.
Trends will also be put out through graphs from the data results to see the difference in Road Class X’s accident rates and patterns over the 5-year span with Road Class Y and Road Class Z.
3.3.1.3 Further Analysis of the chosen road type
After the road class is determined, further analysis will be done to find what type of road within this class is most dangerous by categorizing this single road class into smaller ones through the different speed limits and other categorizing factors within each road class.
Factors determined that affect to road accident rates such as light conditions, weather conditions, road surface conditions, Severity of accidents, types of junctions will be used.
Tables of accident data for the selected road class will be made in conjuction with the factors stated above over a recorded five year span (2012-2016). Accident rates and patterns over the 5-year span which include factors for the remaining road types will be compared.
Trends of increase or decrease will be analyzed with suggestions/educated assumption guess backed up by research being made as to the cause of the number of accidents and its increase, decrease or stable rates of accidents.
To determine which road type is the most dangerous, the total number of accidents under the influence of the factors used such as light conditions, road surface conditions along with the amount of high severity for the 5 years under the influence of the factors will be compared for all remaining road categories with the class being deemed the most dangerous road class having the highest number of accident rates in the most severe accident types (fatal, serious) under the influence of the factors determined until the most dangerous road class cannot be categorized down any further and the most dangerous road class provided in the stats 19 accident database is found.
Evaluation Methods:
Analyse trends for the types of roads under investigation.
Analyse trends for the categories of road identified as most dangerous
Trend in Weather
Comparison of Road Surface Conditions
Severity of accidents
Analysis of data over a span of time (e.g. past five years)
Suggesting countermeasures for decreasing accident rates.
2.3.3 Statistical methods for analysis of accident data:
Analysis of accident data is required to find out causes of that accident It is also important to see the effectiveness of accident prevention measures.
Qualitative methods of data analysis of the accident can provide inside into the causes that contributed the accident and often help to identify the black spots on the street System.
Why are Statistical Methods required?
The laws of chance govern accidents and the occurrence of accident is a random event with respect to time and distance. Accident occurrence follows probalistic distribution. To see whether accident data from a particular site follow random behaviour and deterministic in nature. Statistical Analysis is the only available tool for the purpose
A number of statistical methods will be applied in accident research. These includes
Regression methods
Poisson distribution
Use of chi square test comparing accident data
Regression methods
This method is useful to correlate different factors with accident to develop accident prediction model.
Poisson distribution
2.3.4 Limitations of Accident Data:
Under reporting of Accidents: In Great Britain, development of accident database also includes police reported accident forms. However, accident database could not get comprehensive and accurate level up to expectation due to under reporting and under recording even though the police are not the only ones recording or reporting accidents.
The widespread under-reporting and incomplete data collection regarding specific details of accidents are, however major problems. This limits the proper analysis of accidents to be carried out towards improving road safety. Loss of lives, personal injury and property damage because of road traffic crashes are a common daily phenomenon.
Weakness of Institute
Road safety improvement efforts in Britain could suffer some drawbacks. The Impact of budget cuts on local road maintenance and road safety and ignoring targets. The Department for Transport (DfT) has published an independent report, which finds that there has been insufficient central government leadership and funding for British road safety over the last decade with too few resource being directed toward tackling the safety problem.
3.4 Conclusion
This chapter discussed about data collection source, The RAS (Road Accident Statistics) utilizing CRASH, which is used to compile and interrogate the electronic accident database, problems related to interpretation of data means under-reporting and under-recording of accident data is an important issue. The next chapter will concerned about analysis of accident data.
4. Analysis of Road Accident Data
4.1 INTRODUCTION
For targeting built up road safety improvement initiatives, interpretation of accident data
presented to either establish accident profiles by severity level, light conditions, weather conditions, junction type, speed limit, road surface conditions etc. It is important to manage situation of road safety problems well due to the continual economic growth along with expansion of urbanization and motorization.
Road classes provided for all factors will be analysed using the road accident database. From this, corresponding accidents rate tables and graphs will be made and the most dangerous type of road provided for all factors will determined through data analysis in this section.
4.2 Accident Statistics
4.2.1 Accidents in Built up Roads, Non-Built up Roads and motorways
Accident Recorded Year=2012-2016
Data Source= Stats19
Table 4.2.1: Annual road casualty numbers for each category of road
Built-up, Non-Built up and Motorway road’s Individual Percentage Contribution towards the total number of annual accident numbers
| Year | Built Up Road
accidents |
Non-Built up Road
accidents |
Motorway
accidents |
Total | % of Built Up accidents | % of Non-Built Up accidents | % of Motorway Accidents | ||
| 2012 | 125,343 | 68,865 | 9742 | 203,950 | 61.46% | 33.77% | 4.78% | ||
| 2013 | 120,154 | 66,406 | 9163 | 195,723 | 61.39% | 33.93% | 4.68% | ||
| 2014 | 111,599 | 63,339 | 8732 | 183,670 | 60.76% | 34.49% | 4.75% | ||
| 2015 | 119,619 | 65,653 | 9205 | 194,477 | 61.51% | 33.76% | 4.73% | ||
| 2016 | 114,540 | 62,584 | 9065 | 186,189 | 61.52% | 33.61% | 4.87% | ||
| Overall | 591,255 | 326,847 | 45907 | 964,009 | Average | 61.33% | 33.91% | 4.76% |
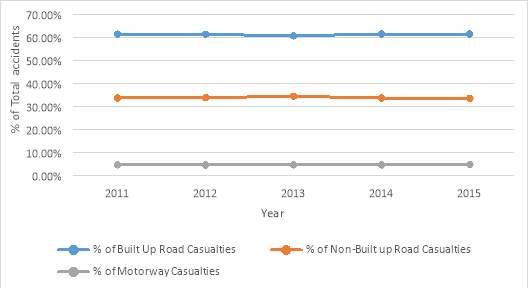
Fig 4.2.1: Graph Showing Yearly Change in Percentage of Urban and Rural and Motorway Casualties
The figure above shows that urban roads have the highest percentage of casualties with a difference of 27.42% with rural roads and a 56.57% difference with motorways. The difference on average in percentage between Rural and Motorway’s contribution to the total amount of accidents is 29.15%.
Although motorways allow vehicle exposure to higher speeds, they have the lowest contribution to accidents. Higher investments in motorways could be the reason for this leading to a more meticulously designed road. Additionally, features such as light bumps on motorway lanes, provide improved visibility at night for drivers and the bumps provide feedback to the driver if they are steering out of lane or act as a warning (steering out of lane at night or day time due to the driver’s condition (if they are fatigued and start falling to sleep).
Additionally, built up roads could have the highest road casualty rates due to the traffic consisting of several conflicting movements. Examples include exiting parking spaces, road crossing, and turning. Large variances in the speed and sizes of vehicles present combined with the highest concentration of vulnerable users with higher possibility of encounters and interaction between such users and drivers could be the reason why there are highest percentages of accident rates and casualties in built up areas. Additionally, due to the density in built up areas, the lack of visibility due to obstructions could have also contributed to the percentage of urban casualties. Additionally blind corners present in built up areas to accommodate the high density of population could also be another reason for the percentage casualties on Built up roads.
Additionally, road user behaviour could also affect this. Red lights violations, technological advances leading to a rise in extensive use of mobile phones could also in tandem with the factors above be the reason why built up/ urban roads have the highest percentage of road casualties.
Number of pedestrian crossings should also be taken into consideration since bad road behaviours by pedestrians can be induced and could be a reason why accident and casualty rates are so high in built up roads as well.
4.2.2 Severity of accidents in Built Up, Non-Built up and Motorway Accidents
Table 4.2.2.1 Number of accidents of Fatal Severity for Built Up, Non-Built up and Motorway Accidents
| Year | Built up Road Fatal Accidents | Non-Built up Road Fatal Accidents | Motorway Fatal Accidents |
| 2012 | 746 | 811 | 80 |
| 2013 | 681 | 830 | 97 |
| 2014 | 752 | 821 | 85 |
| 2015 | 721 | 799 | 96 |
| 2016 | 765 | 843 | 87 |
| Total | 3,665 | 4,104 | 445 |
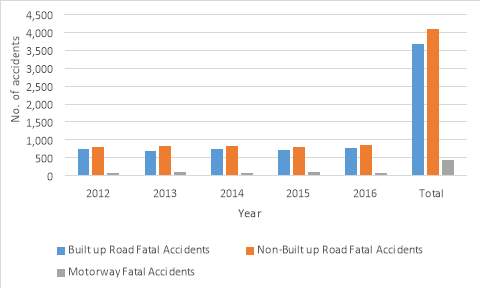
Figure 4.2.2.2 Comparison of number of accidents of Fatal Severity for Built Up, Non-Built up and Motorway Accidents
- Bar Graph above illustrates that the number of casualties of fatal severity are highest in non-built up roads for all five years under investigation with Built up roads having slightly lower accidents rates of fatal severity.
- Motorways have the lowest accidents rates for fatal severity.
Table 4.2.2.2 Number of accidents of Serious Severity for Built Up, Non-Built up and Motorway Accidents
| Year | Built up Road Serious Accidents | Non-Built up Serious Accidents | Motorway Serious Accidents |
| 2012 | 14,812 | 5,543 | 546 |
| 2013 | 13,664 | 5,416 | 544 |
| 2014 | 14,255 | 5,826 | 595 |
| 2015 | 13,909 | 5,513 | 616 |
| 2016 | 15,074 | 5,966 | 682 |
| Total | 71,714 | 28,264 | 2,983 |
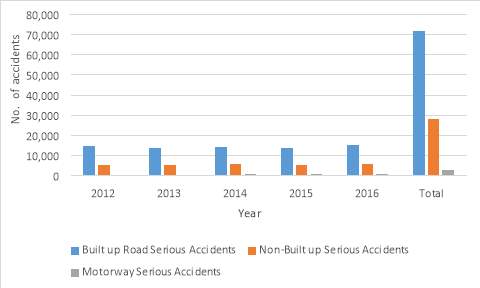
Figure 4.2.2.2 Graph with comparison of number of casualties of Serious severity for Built Up, Non-Built up and Motorway Accidents
- The number of accidents of serious severity are highest in built up roads for all five years under investigation with non-Built up roads having slightly lower casualty rates of fatal severity.
- Motorway accidents rates are rising at a slow rate in the five-year span.
Table 4.2.2.3 Number of accidents of Slight Severity for Built Up, Non-Built up and Motorway Accidents
| Year | Built up Road Slight
accidents |
Non-Built up Road Slight accidents | Motorway Slight accidents |
| 2012 | 93,478 | 24,566 | 4,989 |
| 2013 | 103,536 | 29,727 | 5,397 |
| 2014 | 95,290 | 23,748 | 4,950 |
| 2015 | 90,939 | 22,624 | 4,838 |
| 2016 | 87,191 | 21,340 | 4,636 |
| Total | 470,434 | 122,005 | 24,810 |
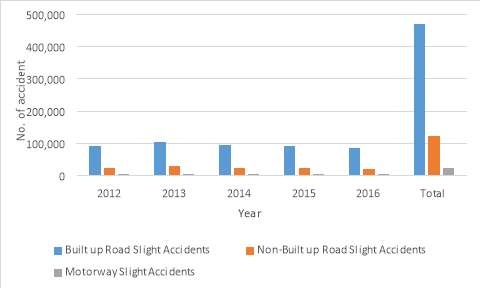
Figure 4.2.2.3 Graph showing comparison of number of casualties of Slight Severity for Built Up, Non-Built up and Motorway Accidents
- Casualty numbers for slight severity are highest in built up roads for all five years under investigation with non-built up roads with slightly lower casualty rates of slight severity.
- There is no significant change in accident of slight severity for Motorways in the five-year span.
- Over the 5-year span, Built up roads have the highest number of accident, 348429 more than Non- Built Up roads and 445,624 more than Motorways.
- For all three types of roads, the numbers of accident are lower in 2016 in comparison to the start of the five-year period in 2012.
Summary
Figure 4.2.2.2, 4.2.2.3 illustrates that Built up roads have the highest accident rates for casualties of Serious and slight severity.
Figure 4.2.2.1 illustrates that Non-Built up roads have the highest accident rates for casualties of fatal severity.
The number of total accidents for the roads over a recorded period of 5 years are:
Built up Roads = 3,665 fatal + 71,714 Serious + 470,434 Slight = 545813 Accidents in this type of road
Non Built Up Roads = 4104 fatal + 282264 Serious + 122005 Slight = 154,373 Accidents in this type of road
Motorways = 445 fatal + 2983 Serious + 4636 Slight = 8064 Accidents in this type of road
The number of accident rates are highest for Built Up roads across all severity categories. Built up roads also have the highest accident numbers for two out of three severity categories (Serious and slight) with the second highest over accident rates in the Fatal category.
Through data collection and analysis, among the types of road provided by the stats19 database and RAS 10 (Road Accident Statistics 10), Built Up roads are most likely to have accidents and therefore could be considered the most dangerous type of road among the three.
- Further Data Analysis of road accident statistics for different factors (Built up roads)
4.3.1 Type of Junction
Road type = Built up Road (Up to 40 mph)
Accident Recorded Year=2012-2016
Data Source= STATS 19
Table4.3.1.1: Annual Number of Accidents for Different Types of Junctions (Excluding Private Drive/Entrance)
| Year | Roundabout | I or Staggered | Cross Roads | Junction with more than 4 arms | Other | Not at or within 20m of Junction | Total |
| 2012 | 11532 | 42375 | 13186 | 1830 | 2756 | 32924 | 104603 |
| 2013 | 11047 | 40156 | 12462 | 1125 | 2398 | 32016 | 99204 |
| 2014 | 11871 | 43675 | 13263 | 947 | 2557 | 33248 | 105561 |
| 2015 | 11218 | 40471 | 12580 | 928 | 2555 | 33599 | 101351 |
| 2016 | 10564 | 38810 | 11961 | 856 | 3017 | 34242 | 99450 |
Table4.3.1.2: Yearly Changes in percentage of Accidents for Different Types of Junctions
| Year | Roundabout | I or Staggered | Cross Roads | Junction with more than 4 arms | Other | Not at or within 20m of Junction | Total |
| 2012 | 11.02% | 40.51% | 12.61% | 1.75% | 2.63% | 31.48% | 100.00% |
| 2013 | 11.14% | 40.48% | 12.56% | 1.13% | 2.42% | 32.27% | 100.00% |
| 2014 | 11.25% | 41.37% | 12.56% | 0.90% | 2.42% | 31.50% | 100.00% |
| 2015 | 11.07% | 39.93% | 12.41% | 0.92% | 2.52% | 33.15% | 100.00% |
| 2016 | 10.62% | 39.02% | 12.03% | 0.86% | 3.03% | 34.43% | 100.00% |
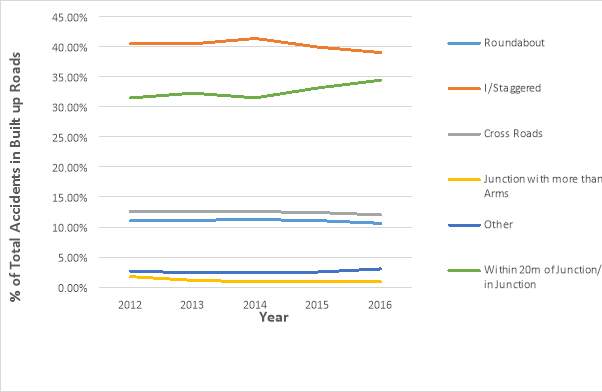
Fig 4.3.1.1 Graph Showing Yearly Changes in percentage of accidents for different types of junctions
- Graph indicates that percentage of accidents for Staggered junction or I is
the highest value in recent years, which is 40.3% .
- At cross roads and roundabouts, there is no significant change in the number of accidents.
- Percentage of accidents within 20 meters of a junction is up 2.95% within 4 years.
4.3.2 Different Conditions of weather (Day and Night time)
Road type = Built up road (Up to 40mph)
Accident Recorded Year= 2012-2016
Data Source = STATS 19
Table 4.3.2.1: Yearly Accident rates for Different weather conditions
| Year | Fine | Raining | Snowing | Fog | Total |
| 2012 | 28862 | 20666 | 519 | 521 | 50568 |
| 2013 | 108,736 | 15240 | 1689 | 367 | 126032 |
| 2014 | 116072 | 18195 | 187 | 405 | 134859 |
| 2015 | 112233 | 16298 | 456 | 427 | 129414 |
| 2016 | 108,673 | 14,445 | 266 | 440 | 123824 |
| Total | 474576 | 84844 | 3117 | 2160 |
Table 4.3.2.2: Yearly Changes in percentage of Accidents for Different weather conditions
| Year | Fine % | Rain % | Snowing % | Fog % | Total |
| 2012 | 57.08% | 40.87% | 1.03% | 1.03% | 100.00% |
| 2013 | 86.28% | 12.09% | 1.34% | 0.29% | 100.00% |
| 2014 | 86.07% | 13.49% | 0.14% | 0.30% | 100.00% |
| 2015 | 86.72% | 12.59% | 0.35% | 0.33% | 100.00% |
| 2016 | 87.76% | 11.67% | 0.21% | 0.36% | 100.00% |
| Average | 80.78% | 18.14% | 0.61% | 0.46% | 100.00% |
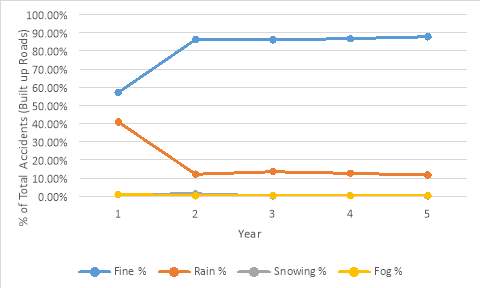
Figure 4.3.2.1: Yearly Changes in percentage of Accidents for Different weather conditions
- Graph shows an increase in percentage of accident rates for fine weather by 30.68% in the space of four years. Additionally, the percentage of accident rates at rainy weather decreased by 29.20 % during a four-year span.
- Fine and rainy weather’s Percentage contribution to accidents in built up roads in the UK can been seen somewhat mirroring each other. This could be an inverse relationship and bolsters the idea that an increase in accidents during fine weather could be a direct indication that accident percentage during rainy conditions dropped. This would not be due to rainy conditions being less risky but rather the possibility of increased frequency of sunshine leading to a decreased frequency of rain hence causing an inverse effect on rainy conditions contribution to the total percentage of accidents.
- Fog and snowing have minimal contribution to percentage of total accidents on built up roads in comparison to fine and rainy weather. This could be due to the lack of frequency of fog or snow in the UK in comparison to fine and rainy conditions.
4.3.3 Different Light Condition
Road Environment= Built Up Road (Up to 40 Mph)
Accident Recorded Year=2012-2016
Data Source= STATS19
Table 4.9.1: Yearly Changes in No. of Accidents for different conditions of Light Conditions
| Year | Daylight | Night (No Streetlights/Unlit) | Night (Lit) | Lighting (Not Reported) | Total |
| 2012 | 79,875 | 1,907 | 25,075 | 2,179 | 109,036 |
| 2013 | 76,075 | 1,816 | 23,982 | 1,663 | 103,536 |
| 2014 | 81,586 | 1,923 | 25,386 | 1,402 | 110,297 |
| 2015 | 77,569 | 1,884 | 24,626 | 1,490 | 105,569 |
| 2016 | 74,652 | 1,995 | 24,624 | 1,753 | 103,024 |
Table 4.9.2: Yearly Changes in Percentage of Accidents for different Light conditions
| Year | Daylight | Night (No Streetlights/Unlit) | Night (Lit) | Lighting (Not Reported) | Total |
| 2012 | 73.26% | 1.75% | 23.00% | 2.00% | 100.00% |
| 2013 | 73.48% | 1.75% | 23.16% | 1.61% | 100.00% |
| 2014 | 73.97% | 1.74% | 23.02% | 1.27% | 100.00% |
| 2015 | 73.48% | 1.78% | 23.33% | 1.41% | 100.00% |
| 2016 | 72.46% | 1.94% | 23.90% | 1.70% | 100.00% |
| Avg | 73.33 | 1.792 | 23.282 | 1.598 | 100.00% |
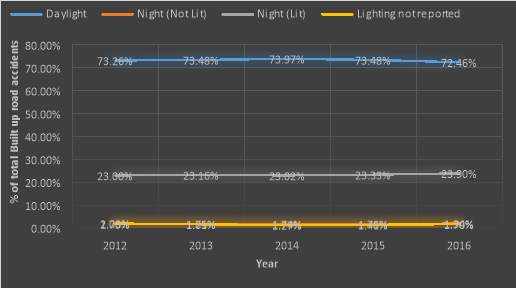
Figure 4.3.2.1: Yearly Changes in percentage of Accidents for Different light conditions
- Graph illustrates highest percentage of accidents in the previous years to be 73.97% with the percentage of accidents occurring during daytime.
- Daytime has much higher activity rates and although visibility may be poorer at night with or without lights, an increase in activity rates could be the reason why day time contributes 48.3% more to accident rates than night time in built up roads with or without lighting for added visibility. However, from the figure above, it can be seen that percentage contribution to accidents in built up roads have not changed much for all lighting conditions.
- Although dark lighting conditions would be make it harder to drive due to lack of visibility, percentage of casualties are higher in good light conditions. This could be due to the road activity levels being higher during daytime when visibility is high in comparison to night time where roads are less active.
4.3.4 Number of Accidents by Type of Road Surface Conditions
Road type = Built up road (Up to 40mph)
Accident Recorded Year= 2012-2016
Data Source = STATS 19
Table 4.3.4.1: Yearly Changes in percentage of Accidents by Different Types of Road Surface Conditions
| Year | Dry | Wet or flood | Snow or ice | Total | Accident % Dry | Accident % Wet Or flood | Accident %Snow or Ice | Total |
| 2012 | 14,460 | 9,899 | 832 | 25,191 | 57.40% | 39.30% | 3.30% | 100.00% |
| 2013 | 13,975 | 9,031 | 710 | 23,716 | 58.93% | 38.08% | 2.99% | 100.00% |
| 2014 | 13,844 | 10,631 | 325 | 24,800 | 55.82% | 42.87% | 1.31% | 100.00% |
| 2015 | 14,294 | 9,093 | 344 | 23,731 | 60.23% | 38.32% | 1.45% | 100.00% |
| 2016 | 14,120 | 8,555 | 447 | 23,122 | 61.07% | 37.00% | 1.93% | 100.00% |
| Total | 70,693 | 47,209 | 2,658 | 120,560 | 58.69% | 39.11% | 2.20% | 100.00% |
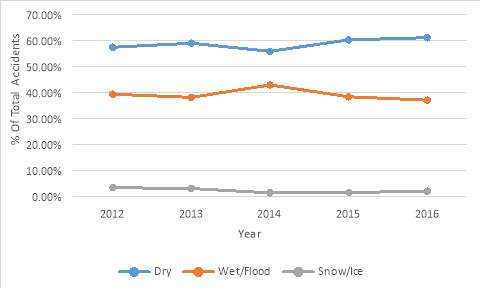
Figure 4.3.4.1: Yearly Changes in percentage of Accidents for Different Types of Road Surface Conditions
- Percentage of Built up road accidents up to 40 mph in dry surface is the highest (59%), than wet/flooded road with snow/ice being the lowest comparatively with Dry or wet surfaces.
- This could be due to the events of snowing being less likely and frequent in comparison to Dry or wet surfaces. If however, the amount of days were kept same for all three types of road surfaces under investigation, ice could have a greatest percentage due to added risk brought by the ice/snowy surface such as skidding due to lack of grip for vehicles making manoeuvring hard which could lead to crash along with braking. Although aware, this makes an individual in a vehicle helpless when put under the situation.
- Figure 4.3.4.1 shows a mirroring pattern for wet/flood road surface conditions and dry conditions percentage of total accident contributions.
4.4 Further Analysis for Built up Roads Accident data
4.4.1 Introduction
It has been determined that built up roads are the most accident prone in terms of the category of road provided in the stats19 database which is present for all road accident safety statistics for factors such light conditions, weather conditions, road surface conditions, types of junctions, severity of accidents.
Since built up roads can also be categorized further by three speed limits according to the stats19 road accident database, factors that can affect road accident rates such as light conditions, weather conditions, road surface conditions, types of junctions, severity of accidents will be analysed for all three speed limits. Total accident rates for the three speed limit for built up roads will be combined for the factors listed that can affect the road accident rates for the three speed limits and the most dangerous speed limit of built up road determined.
4.4.2 Accident rates for built up roads
Accident Recorded Year = 2012-2016
Data Source= STATS19
Table 4.4.2.1: Yearly accidents rates for by speed limit for Built up Roads
| Year | 20 MPH Built up Road | 30 MPH Built up Road | 40 MPH Built up Road | Total |
| 2012 | 2248 | 94928 | 11860 | 109036 |
| 2013 | 2,664 | 89,424 | 11,448 | 103536 |
| 2014 | 3,417 | 94,931 | 11,949 | 110297 |
| 2015 | 4,291 | 89,549 | 11,729 | 105569 |
| 2016 | 6,747 | 84,923 | 11,360 | 103030 |
Table 4.4.2.2: Yearly Change in Percentage of accidents for Built up Roads
| Year | Accident % 20MPH Road | Accident % 30MPH Road | Accident % 40MPH Road | Total |
| 2012 | 2.06% | 87.06% | 10.88% | 100.00% |
| 2013 | 2.57% | 86.37% | 11.06% | 100.00% |
| 2014 | 3.10% | 86.07% | 10.83% | 100.00% |
| 2015 | 4.06% | 84.83% | 11.11% | 100.00% |
| 2016 | 6.55% | 82.43% | 11.03% | 100.00% |
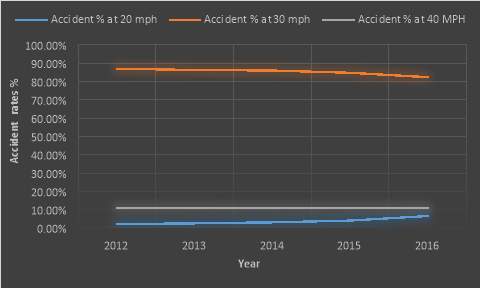
Figure 4.4.2.1: Yearly Change in Percentage of accidents for Built up Roads
- 30mph Built up roads contribute to 85% of total accident rates on all built up roads over a five-year span on average.
- 40 mph built up road’s contribution to total accident rates for built up roads over a five-year span have not fluctuated and is at around 11% on average.
- 20 mph built up roads have had a small and noticeable increase in contribution to total accident rates from 2.06% in 2012 to 6.55% in 2016. Its contribution is up 2.49% from the previous year (2015).
- Graph illustrates a decrease in accident rates for 30mph roads while 40 mph built up road’s accident rates stay roughly around the same region with accident data for all five years staying around the same range (average of 11669.2 accidents).
- An increase in accident rates can be seen in 20 MPH roads over the five-year span with an increase in accidents by 4499 accidents per year when comparing 2012-2016.
- Built up roads with 30 mph speed limits could be considered the most dangerous road type for built up roads due to the contribution to accident rates per year, which is 14.88 % greater than 40 mph built up roads.
4.4.3 Trends by Type of Severity and speed limits
Accident Recorded Year = 2012-2016
Data Source = STATS 19
Table 4.4.3.1: Yearly Change in Fatal accident rates for built up roads by speed limit
| Year | 20 mph Fatal accident | 30 mph Fatal accident | 40 mph Fatal accident | Total |
| 2012 | 9 | 582 | 155 | 746 |
| 2013 | 6 | 520 | 155 | 681 |
| 2014 | 28 | 589 | 135 | 752 |
| 2015 | 12 | 523 | 186 | 721 |
| 2016 | 29 | 571 | 165 | 765 |
| Total | 84 | 2,785 | 796 |
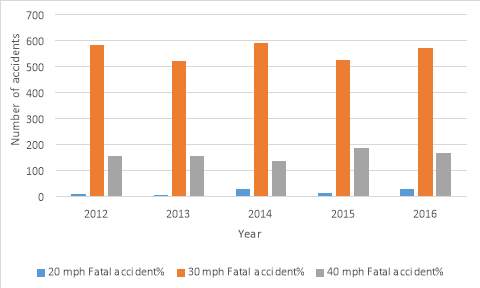
Figure 4.4.3.1 Total number of fatal accident rates for built up roads by speed limit
- Bar graph shows fatal accidents at 30 mph to be the highest for all 5 years recorded.
- 30 mph roads are most likely to have fatal accidents out of the three roads.
- Accident rates falling for built up roads from 2014 to 2015 (12 per cent for fatalities, 3 per cent for serious injuries and 6 per cent for slight injuries on 30 mph roads) is due to
The new 20 mph limited roads were likely to have been 30 mph limited roads before the change. (Department for transport/Gov.uk)
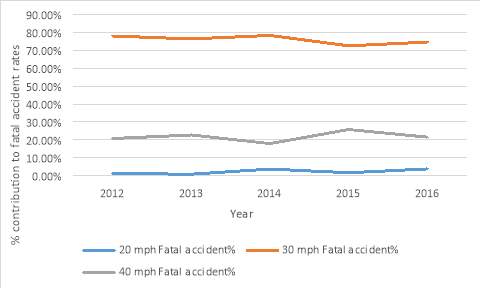
Figure 4.4.3.2 Built up roads of different speed limits percentage contribution to fatal accident rates
- 20 mph roads have the lowest number of fatal accidents due to the speed of travel.
- There is not a lot of difference between accident rates from 2012 – 2016 for all three road classes although fluctuation were present.
- However, 30 mph built up roads have had lower number of fatal accidents since 2014 although not by a lot.
Table 4.4.3.2: Yearly Change in serious accident rates for built up roads by speed limit
| Year | 20 mph Serious accident% | 30 mph Serious accident% | 40 mph Serious accident% | |
| 2012 | 333 | 12,684 | 1,795 | 14,812 |
| 2013 | 420 | 11,582 | 1,662 | 13,664 |
| 2014 | 492 | 11,932 | 1,831 | 14,255 |
| 2015 | 644 | 11,494 | 1,771 | 13,909 |
| 2016 | 994 | 12,199 | 1,881 | 15,074 |
| Total | 2,883 | 59,891 | 8,940 |
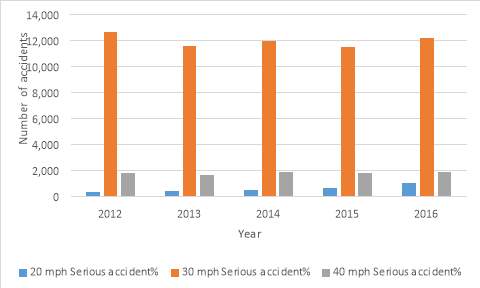
Figure 4.4.3.3 Total number of serious accident rates for built up roads by speed limit
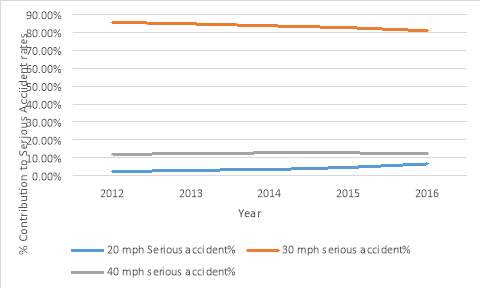
Figure 4.4.3.4 Built up roads of different speed limit’s percentage contribution to Serious accident rates
- The graph shows a negative correlation for the 30 mph built up road over the five year span.
- The slow decrease in percentage contribution to serious accident severity rates for the 30 mph built road is similar to the slow increase of the 20 mph built up road.
- No significant change is present in the 40mph built up roads percentage contribution to accident rates.
Table 4.4.3.2: Yearly Change in slight accident rates for built up roads by speed limit
| Year | 20 mph Slight accident% | 30 mph Slight accident% | 40 mph Slight accident% | Total |
| 2012 | 1,906 | 81,662 | 9,910 | 93,478 |
| 2013 | 2,238 | 77,322 | 9,631 | 89,191 |
| 2014 | 2,897 | 82,410 | 9,983 | 95,290 |
| 2015 | 3,635 | 77,532 | 9,772 | 90,939 |
| 2016 | 5,724 | 72,153 | 9,314 | 87,191 |
| Total | 16,400 | 391,079 | 48,610 |
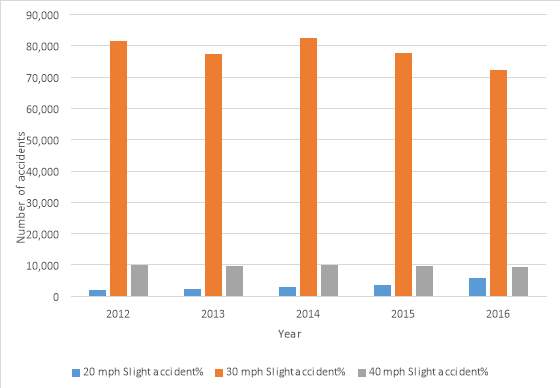
Figure 4.4.3.5 Total number of slight accident rates by speed limit
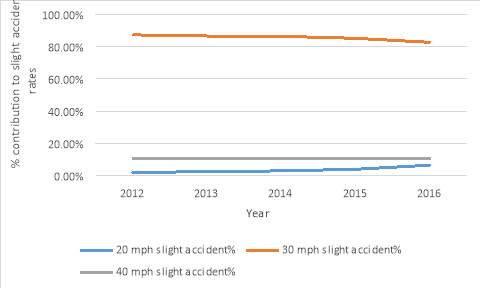
Figure 4.4.3.6 Built up roads of different speed limits percentage contribution to slight accident rates
- Graph indicates that 30mph road have the highest percentage contribution to slight accident rates.
- This correlates with the bar graph where there is a 71% difference in between the number of accidents that occurred at 30mph built up roads and 40mph built up roads.
- There is no significant change in any particular type of severity.
Summary
Figure 4.4.3.1, 4.4.3.3 and 4.4.3.5 illustrates that 30 mph Built up roads have the highest accident rates for accidents of Fatal, Serious and slight severity.
The number of total accidents for the built up roads over a recorded period of 5 years are:
Built up road with speed limits of 20 mph = 84 fatal + 2883 Serious +16400 Slight = 19367Accidents in this type of road
Built up road with speed limits of 30 mph = 2785 fatal + 59,891 Serious 391,079 Slight = 453,755 Accidents in this type of road
Built up road with speed limits of 40 mph = 796 fatal + 8940 Serious + 48610 Slight = 58346 Accidents in this type of road
The number of accident rates are highest for Built Up roads with speed limit up to 30 mph across all severity categories. These category of road also have the highest accident numbers for all three severity categories (Fatal,Serious and slight).
Through data collection and analysis, among the types of road provided by the stats19 database and RAS 10 (Road Accident Statistics 10),it has been determined that Built up roads of speed limit up to 30 mph have the frequency of accident rates for all severities.
Accidents are more likely to occur in this type of road and 30mph Built up roads could be considered the most dangerous road in terms of severity along with the likeliness of accidents occurring on those types of roads
5. Discussion of results
5.1 Introduction
This chapter uses data from the road accident database and introduces the impacts of factors such as road weather and lighting conditions, junctions types, road surface conditions on road accident rates. Using data for these factors in conjunction with trends and ideas formed through analysis of the data for different roads, possible connections can be formed between the two.
5.2 Investigating impacts of lighting conditions on accident rates
Factors that can be measured in relation to road accident rates should be taken into consideration when analysing its impact on accident rates. Visual representation of accident rates in relation to condition of lighting highlighted a higher number of accidents during the daytime (74,652 accidents (2016) at 72.46% contribution to total accident rates for light conditions) in comparison.to night with or without provision of streetlights (26619 accidents(2016) at 25.074% contribution to total accident rates) for light during that year. (Table 4.9.1 and 4.9.2). Night time conditions are undoubtedly riskier to drive in than daytime conditions with or without streetlights. However, the reason for daytime accident rates to be higher by than night time conditions may have to do with road activity levels. During daytime, there is much more congestion and activity on the roads and therefore more potential hazards. Although present during night time as well, the decrease in activity levels of roads ensures there are less hazards to deal with and only the environment to focus on.
5.3 Types of Roads and their effects on road safety
Although motorways allow vehicle exposure to higher speeds, they have the lowest contribution to accidents. Higher investments in motorways could be the reason for this leading to a more meticulously designed road. Additionally, features such as light bumps on motorway lanes, provide improved visibility at night for drivers and the bumps provide feedback to the driver if they are steering out of lane or act as a warning (steering out of lane at night or day time due to the driver’s condition (if they are fatigued and start falling to sleep).
Additionally, built up roads could have the highest road casualty rates due to the traffic consisting of several conflicting movements. Examples include exiting parking spaces, road crossing, and turning. Large variances in the speed and sizes of vehicles present combined with the highest concentration of vulnerable users with higher possibility of encounters and interaction between such users and drivers could be the reason why there are highest percentages of accident rates and casualties in built up areas. Additionally, due to the density in built up areas, the lack of visibility due to obstructions could have also contributed to the percentage of urban casualties. Additionally blind corners present in built up areas to accommodate the high density of population could also be another reason for the percentage casualties on Built up roads.
Additionally, road user behaviour could also affect this. Red lights violations, technological advances leading to a rise in extensive use of mobile phones could also in tandem with the factors above be the reason why built up/ urban roads have the highest percentage of road casualties.
Number of pedestrian crossings should also be taken into consideration since bad road behaviours by pedestrians can be induced and could be a reason why accident and casualty rates are so high in built up roads as well.
5.4 Consideration of Road Surface Conditions
Dry Road surface conditions had a total of 70,693 accidents over a span of 5 years followed by wet/flood road at 47,209, snowing at 2658 and fog with 120,560 accidents.
Percentage of Built up road accidents up to 40 mph in dry surface is the highest (59%), than wet/flooded road with snow/ice being the lowest comparatively with Dry or wet surfaces.
( Figure 4.3.4.1)
This could be due to the events of snowing being less likely and frequent in comparison to Dry or wet surfaces and could also be attributed to experiencing more period of warmer drier weather due to the effects of global warming. If however, the amount of days were kept same for all three types of road surfaces under investigation, ice could have a greatest percentage due to added risk brought by the ice/snowy surface such as skidding due to lack of grip for vehicles making manoeuvring hard which could lead to crash along with braking. Although aware, this makes an individual in a vehicle helpless when put under the situation.
5.5 Weather conditions
Fine weather had higher accident rates (474576) than rainy weather (84844) over a five-year period (Table 4.3.2.1). This could be due to recent effects of global warming where warmer and drier periods of weather were experienced more frequently than rainy periods.
Fine and rainy weather’s Percentage contribution to accidents in built up roads in the UK can been seen somewhat mirroring each other (Figure 4.3.2.1). This could be an inverse relationship and bolsters the idea that an increase in accidents during fine weather could be a direct indication that accident percentage during rainy conditions dropped. This would not be due to rainy conditions being less risky but rather the possibility of increased frequency of sunshine leading to a decreased frequency of rain hence causing an inverse effect on rainy conditions contribution to the total percentage of accidents.
Fog (2160 accidents over 5 years) and snowing (3117 accidents over five years) have minimal contribution to percentage of total accidents on built up roads in comparison to fine and rainy weather. This could be due to the lack of frequency of fog or snow in the UK in comparison to fine and rainy conditions, which could also be due to global warming effects. Additionally, low fog and snowy weather accidents in comparison to fine and raining weather could be accounted for by most people driving more carefully and at lower speeds regardless of driver’s experience.
5.6 Junction Types
Staggered junctions clearly had the highest accident rates over a five-year span with 38810 accidents in 2016 alone, and are not as common as roundabouts. Increase in motorization and less experienced driver interactions with this type of junction could have been the reason for staggered junctions having the highest accident rates. Roundabouts and junctions with four or more arms had the least amount of accidents. (Fig 4.3.1.1)
This was followed by closely followed by accidents that occur within 20m of junction with 34242 accidents where there is an increasing trend in the number of accidents over a five-year span. (Fig 4.3.1.1)
Although the amount of newer less experienced drivers, those who just passed driving tests do encounter these junctions, more frequent lessons around these types of junctions could be the reason why the accident rates are so low. Additionally the junction rule to give way to vehicles at the right is easy to follow for all drivers and therefore could be why these junctions have lower accident rate while young and less experienced driver may get confused while approaching staggered junctions.
6. Conclusion and Recommendations
6.1 Conclusion
For any road safety programme to be undertaken, a collection of comprehensive data is required. The purpose of this research was to use data analysis to determine the most dangerous road class by analysing road accident data for the types of roads provided by the road accident database and evaluating trends and patterns.
To find the most dangerous road provided by the database, accident statistics over a five-year span were taken for different types of roads provided by the stats 19 database and compiled into a table. This was to shortlist the road types with the highest activity in terms of accidents.
Built-up Roads had the highest annual accident rates for the five year span and the highest accident numbers by severity of accidents for two out of three severity classes which were Serious accidents and slight accidents. The accident severity rates were compared graphically with motorways and non-built up roads with total accident rates being highest for built up roads.
However, to further pinpoint the exact class of road within built up roads, accident statistics over a five-year span (2012-2016) were taken for built up roads with speeds limits of upto 20 mph, upto 30mph, upto 40mph. Built up roads with speed limits upto 30 mph was found to have the highest rate of accident rates for the five year span along with the highest accident numbers for all severity types.
Through data analysis from stats19 database, this finding suggested that the main source of accident rates for the built up road with the highest accident rates were built up roads with speed limits of up to 30 mph.
Furthermore, data analysis was also done on factors that impact road accident rates such effect of light conditions, weather conditions, road surface conditions, junction type on accident rate and severity.
6.2 Recommendation
For future academics:
- For detailed research, instead of using only fatalities, use of Fatalities per 10,000 registered vehicles
- For each road class under investigation, use Fatalities per 10km
- This is to improve the reliability of the study since high volumes of traffic in a smaller road and area with higher population density will definitely impact the amount of road accidents and increase road casualties making the finding that Built up roads with speed limit of 30 mph less reliable.
- Separate analysis should be undertaken for different types of casualties
- Development of a regression model would allow for relationship establishment between accident rates and other factors.
- Investigating a relationship between weather conditions and road types could lead to findings that could be inaccurate since weather conditions although the same, may very in intensity. Rainy weather conditions could cause an increase in road accident rates for the roads under investigation. However, the intensity of rain during accidents that occurred on certain type of road may be less than intensity that occurred on another type of road. The intensity could affect the results and comparing these results for different types of roads would lead to findings that may not be completely accurate.
- To get reliable findings, Factors such as weather conditions should be used only if the factor is kept constant throughout for all types of roads.
For example, studying road accidents for different types of roads under rainy weather (rainwater per 10mm) for all road types would make the findings more reliable and meaningful.
- Collect a wider variety of detailed data to ensure findings and assumptions made from data analysis can be supported as a finding rather than just a theory.
For example, if available, data for the amount of money invested into motorways in comparison to built up and non- built up roads
References
Assets.publishing.service.gov.uk. (2018). [online] Available at: https://assets.publishing.service.gov.uk/government/uploads/system/uploads/attachment_data/file/556396/rrcgb2015-01.pdf [Accessed 10 Aug. 2018].
Assets.publishing.service.gov.uk. (2018). [online] Available at: https://assets.publishing.service.gov.uk/government/uploads/system/uploads/attachment_data/file/648081/rrcgb2016-01.pdf [Accessed 10 Aug. 2018].
CE 451: transportation engineering III: Traffic Planning and Management. (2018).
Scribd. (2018). Thesis on road safety | Traffic Collision | Road Traffic Safety. [online] Available at: https://www.scribd.com/document/252052956/Thesis-on-road-safety [Accessed 10 Aug. 2018].
Gov.uk. (2018). Road accidents and serious accidents – GOV.UK. [online] Available at: https://www.gov.uk/transport/road-accidents-and-serious-accidents [Accessed 10 Aug. 2018].
Cite This Work
To export a reference to this article please select a referencing stye below:
Related Services
View all


Related Content
All TagsContent relating to: "Health and Safety"
Health and Safety is a set of regulations, policies, procedures, and guidelines that aim to prevent any accidents or injuries from occurring. Health and Safety procedures are essential to ensuring a safe, efficient working environment.
Related Articles

DMCA / Removal Request
If you are the original writer of this dissertation and no longer wish to have your work published on the UKDiss.com website then please: