Rheological Characteristics of Slurries
Info: 10916 words (44 pages) Dissertation
Published: 9th Dec 2019
Tagged: Farming
1.0 Introduction
1.1 Project Background
The Rheological flow characteristics of clay mineral slurries can have a severe effect on the processing of slurries meaning that research must be conducted to better understand the rheological behaviour of these slurries. Rheology is a branch of study which looks at the flow and deformation characteristics of a liquid or slurry (Schoonheydt and Johnston, 2006). These studies in rheology are based on the relationship between flow rate and the forces required to generate the flow. Major rheological properties that govern the behaviour of these liquids or slurries are viscosity and yield stress. Rheological characteristics of a fluid or liquid are represented by a rheogram which is a plot of the shear stress associated with the shear rate applied to a fluid. The yield stress is known as the initial stress that a solution requires to begin to flow (Scroth 1997).
1.2 Aim
The main objectives of this study are to determine the rheological characteristics such as viscosity and yield stress of various slurries under the influence of a range of physical and chemical parameters. The influence of parameters such as solid concentration, pH and temperature on the rheological properties of clay slurries will be studied in detail with emphasis on how rheology of clay affects flow behaviour.
1.3 Significance
Clay mineral slurries are used extensively in the chemical and processing industry. Clay minerals are naturally occurring materials mainly consisting of fine grained minerals of colloidal sizes. The study of rheology can give a good indication of the inter-particle interaction and aggregation within slurry (He, Wang, and Forssberg 2006). This means that the flow characteristics of slurry can affect the transportation or separation processes like filtration and flotation. Transportation, pumping, hydrodynamics, rate of mass transfer and sludge water separation can also be influenced by the apparent viscosity of the slurry. Consequently, by understanding how the physical and chemical characteristics of clay mineral slurries influence rheology, the performance or economics of a process can be optimised to ensure that clay mineral slurries can be transported efficiently (Ratkovich et al. 2013).
Clay minerals such as Kaolinite and Bentonite are valuable commercial commodities which are used in cosmetics, adhesives pharmaceuticals, drilling fluids and plastics. They are found in large quantities in soils or mine tailing wastes, which means they pose considerable dewatering challenges and environmental problems. Often they are associated with valuable minerals such as copper and gold, placing a widespread problem in mineral flotation. In fact, Past research has shown that high Bentonite concentrations cause the formation of a continuous gel-like structure instead of single flocs, over a set period (Abu- Jdayil, 2011). Therefore, the concentration of Bentonite plays an important role in the behaviour or rheology of slurry, with numerous conclusions that clay minerals have a damaging effect on mineral flotation recovery and grade (Cruz et al. 2013). It is therefore clear that measurements in rheology are necessary for any process design employing the use of clay mineral slurries. Previous studies in slurry rheology have been quite diverse and have led to varying results and conclusions. Despite many studies been conducted on the effect of shear rate on the flow characteristics of slurry, there are inadequate reports about the shear rate effect on the clay mineral slurries. It has been known that clay suspensions exhibit non-Newtonian characteristics while other contradictory opinions show Newtonian properties. Limited research has been conducted on how parameters such as pH and temperature affect rheology, thus making it an issue that needs to be further investigated.
1.4 Scope
This report will examine rheological properties of two different clay mineral slurries; Kaolinite and Sodium Bentonite. Through the development of rheogram plots, various relationships between viscosity and chemical/physical parameters will be analysed and discussed in detail. These rheogram plots will be created for both Kaolin and Bentonite samples, focusing on a range of studies such as:
- Influence of different solid concentrations on viscosity
- Influence of pH on viscosity
- Influence of temperature on viscosity
Various relationships will be analysed in comparison to modelled relationships from past literature. Model parameters will be fitted to the results to analyse how the model fits the experimental data. This will help determine how changes the ideal rheological behaviours under different conditions.
2.0 Literature Review
2.1 Background
There have been many literature papers studying the rheology of various materials and how they behave. Few articles have described the collection of experimental data in detail, but from the ones that have, it can be said that a lot off differences in the experiments have been observed such as the choice of rheometer or exact measurement protocols. There are very few literature articles in the rheology of clay mineral slurries; therefore it is an area of study which needs further development. Because of this there has been very little research and experimentation conducted on the effects of chemical and physical parameters such as pH and temperature on slurry rheology. In contrast to this, studies on how different solid concentrations affect the rheology of various materials are readily available in literature. A Thorough literature review has been conducted with emphasis on recent literature in the rheology of clay mineral slurry solutions.
Bentonite is a sodium aluminate silicate, which exhibits high swelling behaviour. Bentonite is classified as smectite clay, with its main component being montmorillonite. Sodium montmorillonite in Bentonite is responsible for the high-swelling properties of the clay. Smectites are layered silicates and their building elements are made up of two Si-oxygen tetrahedral sheets sandwiching one Al-oxygen octahedral sheet (Kelessidis, 2017). This results in a commonly known term called 2:1 layer structures, with shared oxygen atoms acting as a link for the layers (Kelessidis, 2017). Bentonite at low concentrations is also known to be highly thixotropic, meaning that the apparent viscosity decreases continuously with time under increasing shear stress with high yield stresses (Lagaly, 1989). Kaolin clay on the other hand is different to Bentonite as it is non-swelling clay made up of a hydrous aluminium silicate with the presence of smectites in the clay. In fact, both Bentonite and Kaolinite are known as smectite clays because of the presence of smectites; however Bentonite exhibits high-swelling behaviour due to a larger content of smectites present. As per research conducted by Mooney (Mooney, 1996), smectites play an important role in the viscosity and yield stress changes in both clays. Their effect on rheology is mainly present in the low to medium shear rate range, compared to high shear rate ranges.
Rheological behaviour of these clays is also governed by the shape of the particles, layer charges, exchangeability of the surface layer cations, structure of the particle edges and the edge charge density (Lagaly, 1989). In relation to surface layer cations, smectite clay particles carry exchangeable cations on the external basal surfaces; it is the valency on these cations that has a strong influence on the rheological behaviour of Bentonite and Kaolinite (Lagaly, 1989). Lattice substitutions within smectites create a charge imbalance on the particle surfaces, which is compensated by exchangeable alkali cations. As cations in Bentonite are mostly sodium, the platelets can separate and form a colloidal structure in water. Therefore, increased smectite content in Bentonite causes it to become highly-swelling (Mooney, 1996).
Another influence on rheology is the interaction of inter-particle forces on the anisotropic structure of the clay particles. This causes aggregation of the clay particles to a card-house structure which can be edge-face, face-face or edge-edge (Güngör, 2000). In the case for Kaolinite and Bentonite, particles are connected by edge-face contacts in a three-dimensional network. Based on the card-house model, faces have a negative charge while edges have a positive charge resulting in an attraction that keeps the particle stable (Lagaly, 1989).
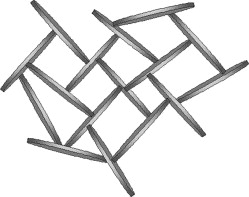
Figure 1 Card-house microstructure of clay gel where positively charged edges are electrostatically attracted to negative charged faces (Laxton et al. 2006)
An article on yield stress of Bentonite dispersions by Vassilios C Kelessidis reports that the elements of Montmorillonite are called platelets and are approximately 1 nm thick and 1000 nm long. Several of these platelets are stacked up together and form a tactoid (Shomer, 1978). These tactoid are held together by interlayer cations (Al 3+, Si 3+, Fe 3+) which as supposed to compensate for the negative charge on the face of the layers. Initially neutral clay sheets carry a negative charge, which will result in positive charged ions loosely absorbing onto the surface of the platelets to electrically balance the sheets.
2.2 Rheological Studies on Solid Concentration
In terms of rheology an article by S. Mueller (Mueller et al. 2010) has indicated that rheology on particles is a ‘complex function of physical properties and processes that occur within suspended particles’. Particle shapes, volume fractions, particle interactions, spatial arrangement of particles and inter-particle forces are all important factors which will ultimately govern the rheology of most slurry suspensions (Mueller et al., 2010). The two clays in suspension, Bentonite and kaolin both display different rheological behaviour due to heterogeneous charge behaviour, platelet morphology and impurities (Au and Leong 2013) .
A Recent journal article on clay mineral rheology titled ‘Rheological properties of clay mineral suspensions in the presence of flotation reagents’ was conducted by some researchers in the University of Queensland. The study analysed the rheological behaviour of Kaolinite and Bentonite suspensions at a range of different solid concentrations and pH values. Researchers found that the Kaolinite and Bentonite suspensions could follow Newtonian flows or non-Newtonian flows with pseudo-plastic properties, but this depended on the solid concentration within the suspensions (Cruz et al. 2013). Bentonite suspensions of 2, 5 and 10 wt. % were mixed with tap water, while Kaolinite suspensions were of 10, 20, 30 wt. % and prepared in similar manner. These suspensions were tested using an Ares rheometer with Coquette geometry at an ambient temperature of 22 °C (Cruz et al. 2013). Here Cruz et al. (2013) showed that at low concentrations of Bentonite and Kaolinite (Bentonite concentrations lower than 10 wt. % and Kaolinite concentrations lower than 5 wt. %) the suspensions behaved as Newtonian fluids, showing a linear relationship on a rheogram plot. However, a higher Bentonite and Kaolinite concentration meant that all suspensions behaved like a non- Newtonian fluid with the rheogram showing pseudo-plastic characteristics.
High swelling clays generally have little effect on yield stress and viscosity per research conducted on clays. Bentonite is highly swelling whilst Kaolinite is non-swelling, meaning that Bentonite can increase to 10 times its original dry volume. Therefore, for Bentonite, the rheological properties are primarily based its swelling components. Whereas for kaolin, the suspension only exhibits significant yield stress and viscosity at high concentrations, usually greater than 40 wt. % (Au and Leong 2013) .
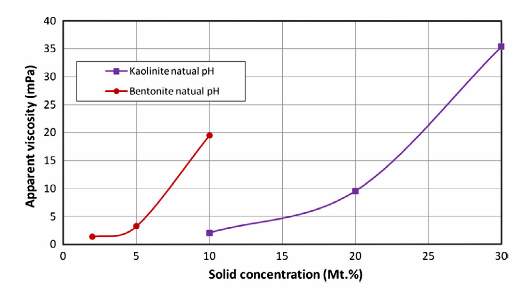
Figure 2 Apparent viscosity of Kaolinite and Bentonite suspensions as a function of their concentrations at a shear rate of 100 s−1 (Cruz et al. 2013).
As Represented in Fig. 1, Cruz et al. (2013) also showed the apparent viscosity of Bentonite and Kaolinite suspensions as a function of their concentration with a sheer rate of 100 s−1. Results of the experiment further proved other past reporting’s in literature showing that Bentonite concentration has a stronger effect on viscosity compared to Kaolinite, with the apparent viscosity being approximately seven times higher than Kaolinite. Goh et al. (2010) showed that this was because Bentonite Suspensions have a high viscosity at low concentrations due to high flocculation and swelling of the fine clay particles creating a viscous gel-like configuration.
These results were comparable to another study conducted by Choo and Bai (2015), but this study purely focused on Bentonite suspensions and how concentration influenced the rheology. Here Choo and Bai (2015) prepared Bentonite concentrations of 5, 7, and 9 wt. %, each mixed with deionised water for 5 minutes and stored for a given period. Bentonite concentration and pH was measured with a Brookfield LVDV-II+ Pro viscometer varied from 10 rpm to 200 rpm. Once again they proved that an increase in the concentration of Bentonite led to an increase in the shear stress of the particles. Compared to past experiments however the study also looked at how the storage time for 5wt% Bentonite affected the rheogram plot. Each sample was stored for 4, 12, 24 and 52 hours respectively. Findings of this experiment showed that an increase in the storage time resulted in a larger initial stress value on the rheogram, indicating that a significant yield value was required to break the particle network due to a large cohesion force between particles (Choo and Bai 2015).
This general relationship between viscosity and solid concentration also seems to be a like past literature articles which have studied various other types of slurries too. Gao and Forssberg (1993) for instance studied how different densities of dolomite (65 to 75 wt. %) effected the viscosity. They found that after increasing the density of the slurry, there was an exponential increase in the viscosity. Bernhardt et al (1999) also studied the effect of solid concentration of limestone on the slurry rheology for effective wet ultrafine grinding, and found that increasing the concentration of limestone in the slurry caused the suspension to become non-Newtonian with shear-thinning characteristics.
2.3 Rheological Studies on pH
From past literature, the pH of a clay suspension has great influence on the rheological behaviour of Bentonite and Kaolinite. Research has found that the relationships between yield stress and viscosity with pH are different for Bentonite and Kaolinite.
Teh et al. (2009) conducted a study on the surface chemistry of Kaolin clay slurries and found that yield stress was very low at pH levels above 10, but found that there was a big spike in yield stress at a pH below 6, the highest magnitude of yield stress being observed at pH 2.5 (Teh et al, 2009). A study by Choo and Bai (2015) investigated pH behaviour of Bentonite suspensions and found a different trend in yield stress with changing pH. Here a Bentonite and water dispersion of 5 wt. % was adjusted to different pH values using a 1M HCl solution. Small amounts of HCl were added to the fresh Bentonite sample of pH 10.3. An increase in the added HCl showed an increase in the shear stress (higher viscosity) up till a pH of 7.2, but above the 5ml mark the shear stress began to decrease (Choo and Bai 2015). Stability of the Bentonite was lowered with a low pH suspension and promoted particle aggregation. Past literature on ultrafine sulphide mineral particles and kaolin (Johnson et al. 2000) discussed that the yield stress of minerals was strongly dependent on the pH value, mainly because the pH changed the surface properties. The figure below shows the effect pH and volume % had on the yield stress of Titania mineral.
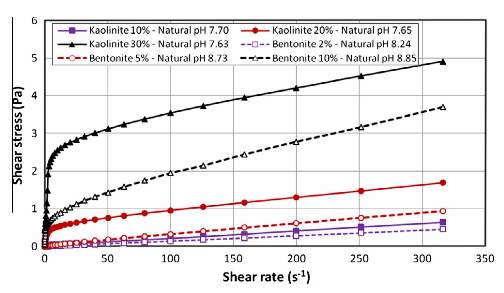
Figure 3 Rheogram of Kaolinite and Bentonite suspensions at different concentrations (Cruz et al. 2013).
Cruz et al. (2013) investigated the effects of pH on the rheology of Bentonite and Kaolinite with use of pH modifiers. The experiment was conducted by preparing various concentration suspensions of Kaolinite and Bentonite with an Ares bob and cup rheometer (8.5mm distance from tip of bob to the base of the cup). Each sample was treated with a pH modifier such as lime (CaO), sodium hydroxide (NaOH) and sodium carbonate (Na2CO3) to change the pH of the suspension from a neutral pH (7-8.5) to a pH of approximately 10. As represented in fig. 2 the results of the experiment showed that low Kaolinite concentration samples (10wt %) did not have any influence on the rheological behaviour of the suspensions, as the solution remained Newtonian. However, at solid concentrations of 20 to 30 wt. % of Kaolinite, Sodium hydroxide had no effect on the viscosity of the Kaolinite samples. Similarly, for Bentonite suspensions, there was no effect on the rheology when low concentration samples were treated with the pH modifiers. These results agree to past literature reports from Abdi and Wild (1993) which show that, for Kaolinite, lime attacks the clay plates at the surface, thus altering the double layer at the surface, resulting in the formation of a gel. Abdi and Wild (1993) also pointed out that sodium carbonate may disperse Kaolinite suspensions at a large Kaolinite concentration triggering a reduction in viscosity.
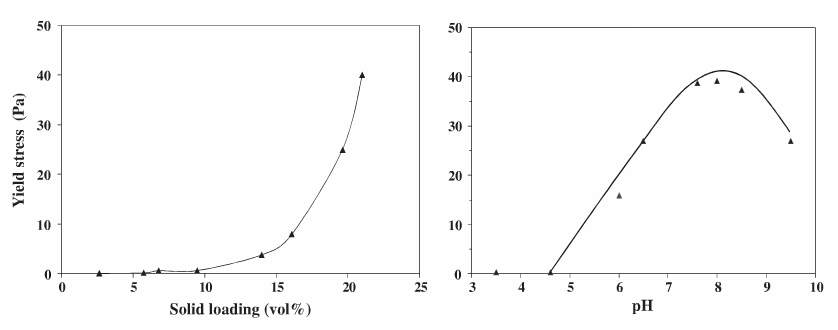
Figure 4 Yield stress of the Titania slurry as a function of solid loading (left) and pH (right) (Farrokhpay, 2012).
A study conducted by Lagaly (1996) aimed to explain why increasing pH reduces viscosity and yield stress of Kaolin. Results showed that in an acidic medium, the edges of Kaolinite particles (positively charged) along with the card-house structure consisting of edge-face contacts are recharged with an increasing pH. The increase in pH recharges the edges and breaks down the card-house structure. This then causes the kaolin particles to be dispersed into a colloidal distribution which is capable of moving freely in a low solid concentrated solution. Lagaly’s study (Lagaly, 1996), reported that that the rheology of water montmorillonite suspensions at 4% mass concentration was highly pH dependent. The findings found that shear stress was at a minimum at a pH of 6 to 7 increasing both at lower and higher pH values.
Results that Choo and Bai (2015) found could be explained by the formation of an isoelectric point (IEP). Depending on the pH of the aqueous solution of the clay suspensions, there is a positive or a negative charge governed by the transfer of H+/OH– from the aqueous solution (Li et al, 2008). Since both negative and positive parts of the clay mineral particles exist simultaneously under acidic condition, presence of more H+ ions would create an isoelectric point where the particles carry no net electrical charge (Li et al, 2008). This would then cause the particle to become unstable and cause a significant decrease in viscosity. Studies by Braggs (1994) and Schroth (1997) found that the isoelectric point of Kaolinite was between a pH of 3 and 5. Braggs (1994) found this exact point to be at a pH of 3.
Further studies on surface charges by Tombacz (2004) and Olphen (2017) report that the faces of the particles have a permanent negative charged, while edges are conditionally charged, meaning they could be positive in an acidic environment or negatively charged in an alkaline environment. But it is the pH at which these edges change their sign which is known as the isoelectric point.
2.4 Rheological Studies on Temperature
Temperature is another influencing factor in the rheology of solid suspensions. There has only been a limited scope of research on the effects of temperature on viscosity and yield stress. Most of these results are from other suspensions other that clay slurry mineral solutions. For instance, Yang et al. (2001) investigated the yield stress and temperature dependences of viscosity for titanium dioxide suspensions. They found that the viscosity declined with increasing temperature, which was consistent with the results obtained by Mikulasek et al. (1997). Results of these investigations found that at low temperature ranges, yield stress decreased as the temperature increased, while at high temperature ranges, yield stress increased. Experiments with limestone slurries are also show that changing the temperature does not change the flow type but does in fact cause viscosity to decrease.
Temperature studies by Vryzas et al (Vryzas et al. 2017), Alderman et al. (Alderman, 1988) along with recent literature on clays has found that as the temperature of the suspension increases, the yield stress also increases. Vryzas et al. (2017) outlines that at high temperatures, particles in a dispersed state move due to Brownian motion (random motion), becoming flexed and associating in a face-face structure. Because of this, clusters are created which increase the yield stress. García-García (García-García, 2006) argued that it was the repulsive energy potential of two neighbouring particles that increased with a rising temperature, directly impacting the yield stress of the clay suspensions. Lin et al. (2016) deduced that the decreasing of yield stress with decreasing temperature originates from the weakening of the repulsive electrostatic interaction between faces of two neighbouring clay particles. Results of Vryzas et al. (2017) found that as flow index for Bentonite increased to 1.0 with a temperature increased, there was clear indication that the dispersions became Bingham plastic.
On separate studies Baudez et al. (2013) studied the ‘impact of temperature on the rheological behaviour of anaerobically digested sludge’ and found that both solid and liquid rheological properties decreased with temperature. Similarly, Baroutian et al. (Baroutian, Eshtiaghi, and Gapes 2013) conducted a study on rheology of primary and secondary sewage suspensions by changing the temperature. Samples with solid concentrations ranging from 4.3 to 9.8 % where tested by temperature changes from 298.15 to 328.15 K. Results shown in figure 3 show that shear stress increased non-linearly with a shear rate increase but decreased with temperature.
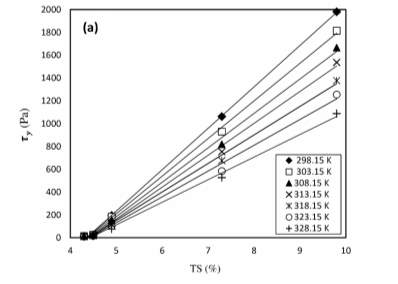
Figure 5 Shear Stress Changes with Temperature (Baroutian, Eshtiaghi, and Gapes 2013)
2.5 Rheological Models:
Some literature reports state that a fluid flow can be Newtonian or non-Newtonian. When a flow is Newtonian there is a usually a linear rise in shear stress as a function of shear rate (Farrokhpay 2012). The yield point is the amount of shear stress needed to initiate flow; therefore it is an indicator of the magnitude of the strength of attraction between particles in the suspension. As represented in figure 6 below, for Newtonian flow, the slope of the flow curve on a rheogram represents the viscosity, whilst the initial shear stress represents the yield stress of a fluid. The slope for a Newtonian flow is always linear meaning that there will be a constant fluid viscosity while for non-Newtonian fluids, viscosity will never remain constant. The equation for viscosity can be represented as:
μ= τγ (1)
Where
μis the dynamic viscosity (Pa s), τ is the shear stress (Pa) and
γis the shear rate (s-1). Since many literature reports have concluded that slurry flow is not Newtonian, different models can be used to analyse the flow of certain fluids. Figure 6 represents the rheological behaviour of various fluids in a rheogram plot. Various models used to describe this behaviour in figure 6 have been summarised in table 1. As presented in table 1, the most frequently used equations to characterize the non-Newtonian behaviour of sludge suspensions are the Ostwald or power law (Eq.3), the Bingham (Eq.4), the Herschel–Buckley (Eq.5), the Casson (Eq.6) and the Sisko (Eq.7). Here τ0 is the yield stress (Pa), n the flow behaviour index, k the flow consistency index (Pa.sn), μ∞ is the infinite rate apparent viscosity (Pa. s) and μ0 is the zero-shear apparent viscosity (Pa. s).
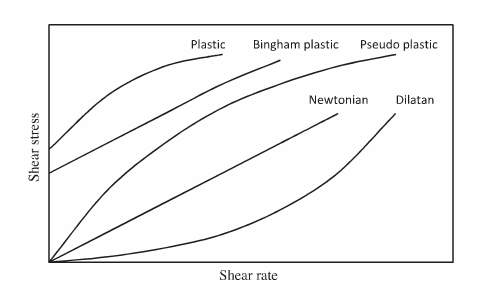
Figure 6 Schematic rheogram of shear rate as a function of shear stress for fluids (Farrokhpay, 2012).
Table 1 Different commonly used non-Newtonian shear stress rate relationships (Ratkovich et al. 2013).
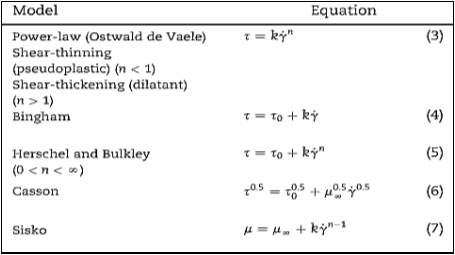
Shear thinning behaviour is known to occur when the apparent viscosity decreases when shear rate increases. Experiments for activated sludge suspensions have been modelled by the Ostwald and Sisko Equations. Out of these models the Ostwald (Power Law) model has been extensively used in past literature due to its simplicity (Seyssiecq, Ferrasse, and Roche 2003). However, per past literature results liquid mineral suspensions typically exhibit Bingham or pseudo plastic behaviour, so the primary equations to estimate viscosity and yield stress have been the Bingham or Casson models. In the Herschel–Bulkley model the, flow index n represents how nonlinear a material is, therefore an n value smaller than 1 means that viscosity of the material decreases as the shear rate increases (Shear thinning behaviour). However, when n is large, the viscosity rises as the shear rate rises, representing shear thickening behaviour (also known as dilatant behaviour). Herschel–Bulkley’s model is one which is well suited to a non-Newtonian material which has a yield stress. In contrast, the Bingham model is primarily used for non-Newtonian materials with a yield stress, but acts Newtonian when the material starts to flow.
A separate study conducted by Choo and Bai (Choo and Bai 2015) investigated how the Herschel–Bulkley model and the Bingham model could be used to analyse rheological behaviour of Bentonite. Results showed that high solid concentrations of Bentonite fitted the Bingham model better. At a low yield stress and low concentration of Bentonite the results showed shear thinning behaviour. But at higher concentration values the thixotropic behaviour (fitting the Bingham model) was found. Choo and Bai (2015) also found that low pH values fitted both the Herschel–Bulkley model and the Bingham model. The results showed that the shear thinning phenomena stood out when the amount of acid added was increased.
3.0 Methodology
3.1 Solid Concentration investigation
A powder sample of Sodium Bentonite was obtained from MP Biomedical Australasia and a powder sample of Kaolinite clay was obtained from Sigma-Aldrich. Preparation of the Bentonite clay suspensions was primarily done so that 4, 6 and 8 wt. % samples would be ready for further investigation. To prepare these suspensions 100ml of deionised water was measured using a 100ml measuring cylinder. Deionised water was then added to 3 100 ml beakers; these beakers were placed on a mechanical stirrer and allowed to be continuously stirred. Meanwhile a 4g, 6g, and 8g sample of Bentonite was measured using a weight scale respectively. As these samples were stirred 4 grams of Bentonite was added to the first beaker, 6 grams of Bentonite was added to the second beaker and 8 grams of Bentonite was added to the third beaker. Samples were continuously stirred with the assistance of a stirrer for up to 3 minutes. Once the samples were prepared each sample was stored in a labelled sample bottles ready to be tested on the rheometer.
Preparation of the Kaolinite clay was primarily done so that 5, 10 and 15 wt. % samples would be ready for further investigation. To prepare these suspensions 100ml of deionised water was measured using a 100ml measuring cylinder. Like the preparation of the Bentonite sample, Deionised water was added to three 100 ml beakers. 5g, 10g and 15g samples of Kaolinite measured from a weight scale were added to the 3 beakers, respectively whilst they were stirred. The stirring process was continued for 2 minutes to allow for complete mixing of clay in solution.
Rheological measurement where conducted after the samples were prepared. An Acres HAAKE MARS iii rheometer with cone-plate geometry was used to conduct the experiment at an ambient temperature of 25 °C. As the slurry suspensions of Kaolinite and Bentonite were stirred, a 15 dm3 sample was taken with a 20 dm3 syringe and placed onto the rheometer. The shear rate range of the experiment was taken between 0 and 1000 s-1 and the gap size was approximately 8.23mm. After testing each clay sample several times in the rheometer, the data was collated and analysed. The data was represented on a rheogram and the most suitable model for the flows was fitted to the data using the built in software.
4.0 Results and Discussion
4.1 Influence of Solid Concentration on clay slurry rheology
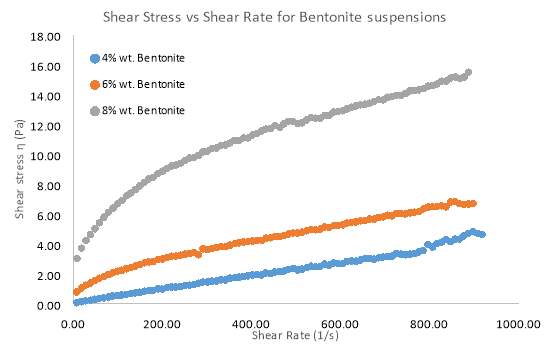
Figure 7 Rheogram outlining the effect of different Solid Concentrations of Bentonite on Shear Stress
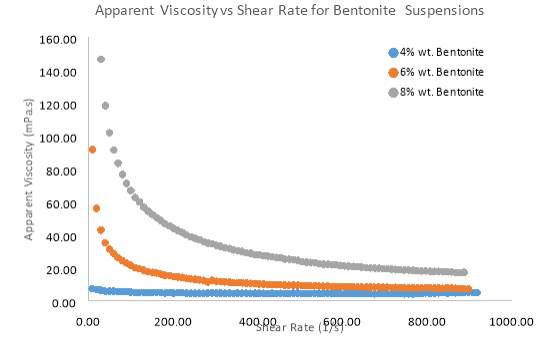
Figure 8 Effect of different solid concentrations of Bentonite on the apparent viscosity
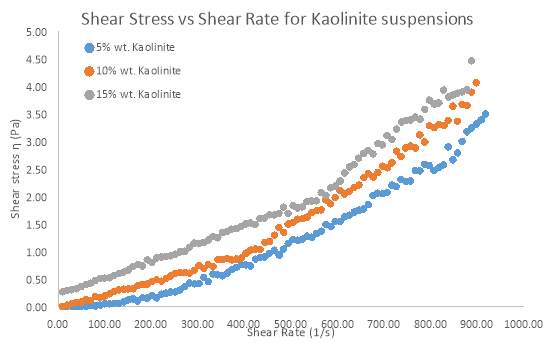
Figure 9 Rheogram outlining the effect of different Solid Concentrations of Kaolinite on Shear Stress
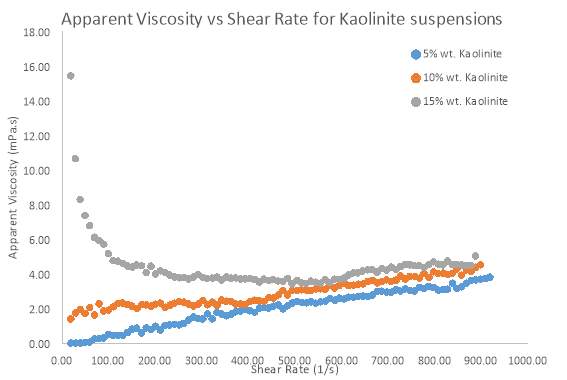
Figure 10 The effect of different solid concentrations of Kaolinite on the apparent viscosity
Solid Concentration of clay suspensions can have a significant effect on clay rheology, however further investigations have been conducted on pure samples of Bentonite and Kaolinite. Figure 7 and 8 Illustrates the behaviour of Bentonite under an increasing shear rate. 4, 6 and 8 wt. % samples of Bentonite and 5,10 and 15 wt. % samples of Kaolinite were tested in this investigation. Figure 7 clearly shows that as the solid concentration of Bentonite is increased, there is more pseudo-plastic behaviour, whereby each shear stress line concaves more towards the shear rate axis. This behaviour is also known as shear-thinning, since apparent viscosity decreases with increasing shear rate (Cruz et al. 2013). Low solid concentrations appeared to move towards more Newtonian flow as represented by a straighter line for the Bentonite sample (4 wt. %) in figure 7. At all shear rates, there was an increase in shear stress as solid concentration went up. Most notably the 8 wt. % sample of Bentonite showed a greater shear stress for each shear rate compared to the 4 and 6 wt. % samples. Even the shear-thinning behaviour was more profound as the sample of Bentonite increased by just 2 wt. %. Kaolinite seemed to behave in a similar manner to Bentonite, but only at a solid concentration of 15 wt. %. Even at such a high concentration, the shear-thinning behaviour was comparable to a sample of 4wt. % Bentonite. However, what was interesting was how Kaolinite began to behave more dilatant (shear-thickening) as the solid concentration decreased below 10 wt. %. As table 2 suggests. From the moment shear stress was applied, the lack in yield stress resulted in viscosity steadily increasing.
Based on flow modelling, it is known that the Herschel–Bulkley model is one which is well suited to a non-Newtonian material which has a yield stress (Ratkovich et al. 2013). All results fitted the Herschel–Bulkley model the best, due to the non-Newtonian nature of Kaolinite and Bentonite flow. Table 1 outlines how the flow index (n) in the Herschel–Bulkley model represents the flow behaviour of a suspension. After fitting the results to the model, table 2 outlines the parameters that were found. Flow index clearly decreases as solid concentration increases, which proves that the flow becomes highly pseudo-plastic. Kaolinite however, does not share this trend, which further explains how different the flow behaves compared to Bentonite.
The results in this investigation are indicative of the high swelling nature of Bentonite. Sodium Montmorillonite in Bentonite is responsible for the high-swelling properties of the clay (Kelessidis, 2017). Montmorillonite is smectite clay consisting of layered silicates which are made up of two Si-oxygen tetrahedral sheets sandwiching one Al-oxygen octahedral sheet (Kelessidis, 2017). This is commonly known as a 2:1-layer structure, whereby shared oxygen atoms act as a link for the layers (Kelessidis, 2017). As the Bentonite particles are dispersed in water, the ions are hydrated and the platelets (tetrahedral sheets) are pushed apart, resulting in the occurrence of swelling (Au et al. 2013). Consequently, increasing the solid concentration means more platelet sheets are pushed apart resulting in more swelling. Reduction in water along with the increased solid content will result in a reduction in distance between the particles (Au et al. 2013). Flocculation can therefore create strong network structures such as the card-house structure. The structures offer an increased frictional resistance to flow, causing the initial viscosity to be very high. As Shear rate increases it is evident from these results that the card-house structure is suddenly broken down or weakened resulting in the shear-thinning phenomena (Lagaly, 1997).
Kaolinite does not have a high swelling nature since there are no interlayer cations present between the tetrahedral sheets; this means that at low concentrations or even higher concentrations, there will still be a relatively large distance between that particles in suspension. As well as this, based on research conducted by Chavali et al. (2017), the low amount of swelling is a direct result of only a small number of exchangeable cations being present at the edges of the sheets in Kaolinite, disallowing the particles to swell. Thus, less network structures are formed, consequently offering limited resistance to flow (low yield stress).
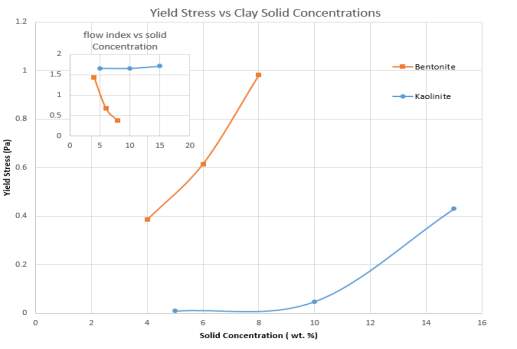
Figure 11 a) Yield Stress vs Solid concentration; b) Flow index vs Solid Concentration for Bentonite and Kaolinite suspensions
Table 2 Key Parameters based on the Herschel–Bulkley model
| Bentonite (wt. %) | Flow index (n) | Yield Stress (Pa) | Kaolinite (wt. %) | Flow index (n) | Yield Stress (Pa) |
| 4 | 1.17 | 0.3848 | 5 | 1.651 | 0.00893 |
| 6 | 0.6148 | 0.6148 | 10 | 1.649 | 0.04783 |
| 8 | 0.3764 | 0.9812 | 15 | 1.709 | 0.4309 |
A common finding for both suspensions was the effect that solid concentration had on the yield stress of all pure clay slurries. Yield stress is the initial stress that is required to cause a liquid to flow, so it is generally found at a zero-shear rate (Scroth 1997). Figure 11 illustrates the data in table 2, showing that yield stress increases exponentially as the solid concentration of both samples increase. Yield stress of Bentonite seems to have a linear dependency on solid concentration compared to Kaolinite. Initially the yield stress for Bentonite is 0.3848 Pa, but increases rapidly to 0.9812 Pa. For Kaolinite, the yield stresses is much smaller (0.00893 Pa) but exponentially jumps to 0.4309Pa at a 15 wt. %. The findings here may be attributed to the fact that, as more solid is added to the suspension, more particles flocculate and form network structures such as the card-house network (i.e. edge-face) (Güngör, 2000). Gelation of the particle double layer turns that structure into a gel through the formation of flocs, therefore the particles tend to behave more like a solid when little shear rate is applied (Lagaly, 1997). This explains the clear trend seen in these results. Kaolinite has a much more loosely packed card-house structure due to its lower smectite composition, so yield stress and viscosity behaviour is very negligible for low concentrations in this investigation.
Compared to Kaolinite, Bentonite experiences shear-thinning behaviour even at low concentrations due to the highly swelling nature of the particles. Shear-thinning is more prominent as the solid concentration increases. But both Clays At high shear rates, behave like a Newtonian liquid. Due to Kaolinites, non-swelling nature, the suspensions had low yield stresses, this resulted in shear-thickening behaviour. More solid concentration was required before a substantial yield stress or initial viscosity could be observed. Solid concentration had a more profound effect on Bentonite suspensions. The stronger card-house structure in Bentonite at high concentrations means that more flocculation occurs at high concentration. For industrial application, pumping costs for Kaolinite would be much lower than Bentonite at a similar concentration due to very low yield stresses. But in regards to Bentonite increasing the solid concentration slightly would substantially increase viscosity at any given shear rate, so it is important that low concentrations are used for applications involving the transportation of the clay.
4.2 Influence of pH on clay rheology
A thorough study has been conducted on the effect of pH on a pure 10 wt. % suspension of Kaolinite and a pure 6 wt. % suspension of Bentonite. The study looks at rheological behaviour of both clays at a pH range of 1.4 to 11. The results below can be observed from a shear rate range from 0 – 1000 s-1. HCl and NaOH where used as the primary pH modifiers to alter the pH in this study.
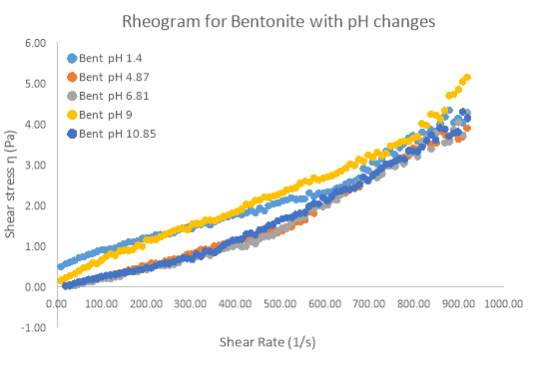
Figure 12 Rheogram plot for 6 wt. % Bentonite with respect to changing pH levels ranging from pH 1.4 – 10.85
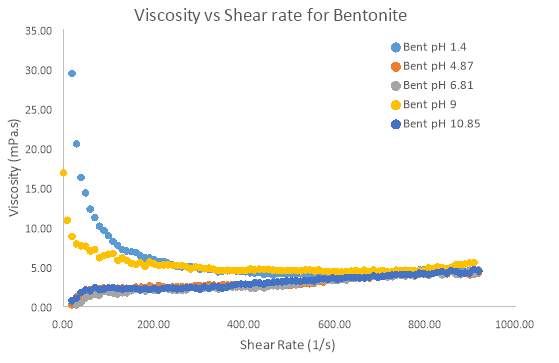
Figure 13 Rheogram plot describing the relationship between viscosity and shear rate with changing pH of 6 wt. % Bentonite
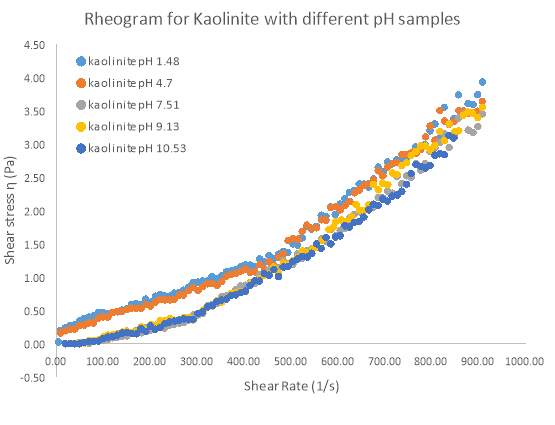
Figure 14 Rheogram plot for 10 wt. % Kaolinite showing the relationship between shear stress and shear rate of samples of varying pH
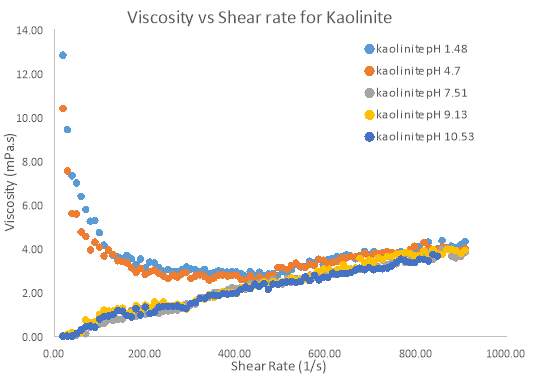
Figure 15 Relationship between viscosity and shear rate for different pH samples of 10 wt. % Kaolinite
Figure 12 and 13 shows how pH affected the yield stress, viscosity and rheogram for pure Bentonite. All the pH samples exhibit non-Newtonian flow, and show similar trends with respect to the increasing shear rate. Based on the non-Newtonian nature of the flow, the Herschel–Bulkley model can be fitted to the results as it gives the best R2 value, thus outlining the suitability of the model to the results. The parameter ‘n’ of the Herschel–Bulkley model indicates the flow index of the material. When ‘n’ is smaller than 1 the liquid exhibits shear-thinning behaviour and when n is equal to 1, the liquid is classified as Newtonian (Ratkovich et al. 2013). As the table below indicates, all the pH samples of Bentonite were observed to have a flow index above 1, which indicates that Bentonite suspensions showed shear-thickening properties. This clearly showed that as the shear rate increases the apparent viscosity will increase. However, while this may be true, not all the pH samples exhibited shear-thickening behaviour between a shear rate of 0 – 400 s-1. The pH samples of 1.4 and 9 in figure 13 clearly shows shear-thinning behaviour of Bentonite as shear rate increases between the 0 – 400 s-1 range. Even the flow index at these pH levels shows a number closer to 1, indicating the inclination towards shear-thinning. Above 400 s-1 all samples of Bentonite showed shear-thickening behaviour. pH samples of 4.87, 6.81 and 10.85 were virtually identical in their behaviour with an increasing shear rate.
So, it is clear from both graphs that pH changes do not influence the apparent viscosity of Bentonite in general, but does cause shear-thinning at certain pH levels on low shear rates.
Table 3 Flow index and yield stress of different 6 wt. % Bentonite pH samples
| pH (Bentonite) | Flow index (n) | Yield Stress (Pa) |
| 1.4 | 1.68 | 0.622 |
| 4.87 | 1.725 | 0.1282 |
| 6.81 | 1.822 | 0.1025 |
| 9 | 1.372 | 0.3366 |
| 10.85 | 1.647 | 0.08541 |
Table 4 Flow index and yield stress of different 10 wt. % Kaolinite pH samples
| pH (Kaolinite) | Flow index (n) | Yield Stress (pa) |
| 1.48 | 1.667 | 0.3194 |
| 4.7 | 1.651 | 0.2439 |
| 7.51 | 1.666 | 0.005293 |
| 9.13 | 1.694 | 0.02647 |
| 10.53 | 1.709 | 0.004896 |
Kaolinite exhibited the same shear-thickening behaviour as represented by the flow index ‘n’ in table 3 above. However, Kaolinite also showed a similar trend to Bentonite, as two samples did not display shear-thickening behaviour between the shear rate range of 0 – 400 s-1. pH samples of 1.48 and 4.7 initially showed this shear-thinning behaviour while all other samples (pH 7.51, 9.12 and 10.53) did not show such behaviour. Again, all samples were virtually identical in their behaviour on the Rheogram suggesting that pH has no effect on the apparent viscosity at high shear rates.
So it is clear that for Kaolinite and Bentonite, pH has no influence on the apparent viscosity of the samples at high shear rates. However it is clear that for certain pH ranges, shear-thinning behaviour can be observed at low shear rates. The cause of this shear-thinning behaviour is because of a large yield stress at these pH levels. If yield stress was not present, all samples showed shear-thickening behaviour for the entire shear rate range.
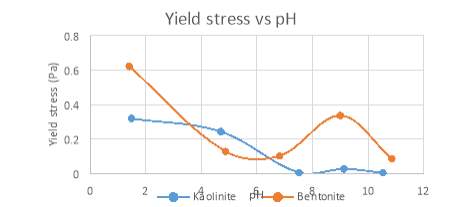
Figure 16 Relationship showing how yield stress varies with pH for 6 wt. % Bentonite and 10 wt. % Kaolinite
From the results in figure 16, the pH of the pure 6 wt. % Bentonite and 10 wt. % Kaolinite suspensions has a profound effect on the yield stress. For Bentonite, the yield stress seems to drop at pH levels above 10, and between the pH ranges of 5-7, while a spike in pH can be observed at pH ranges below 2 and between 8-10. These finding can be attributed to the surface charges of the card-house structure in the Bentonite suspensions.
From literature, it is known that in a clay suspension, the silica basal face sites are always negatively charged because of isomorphous substitution of the Si3+ or Al3+ cations between the tetrahedral platelets that make up a tactoid (Shomer, 1978). Therefore, there is a permanent negative charge on the silica faces of the platelets, so it is not pH dependent (Wang and Siu 2006). This is especially true for Kaolinite where an Aluminium atom from the octahedral layer substitutes into the silica layer, thus making the face charge density independent of solution pH (Laxton et al. 2006). However, as particles are connected by an edge-face, 3-dimensional network, the edges sites can either be positively charged or negatively charged depending on the pH of the solution the clays are in.
As acid is was added to the Bentonite sample, there is a strong decrease in the stability of the card-house structure based on the edge (+) and face (-) contacts. The dip in yield stress between a pH of 5-7 indicates the presence of an isoelectric point (IEP) in Bentonite. At the acidic region, presence of access hydrogen ions decreased the negative edge charge density of the platelets in the particle (Li et al, 2008). Thus, the electrostatic attraction between the (-) edges and (+) faces is reduced and the only main form of attraction remains as Van-der-Waals forces of attraction (Lagaly, 1989). More particles would be dispersed at this pH, resulting in a small yield stress. The presence and effects of an IEP is supported by research from Benna et al. (1999), Abend (2000) and Durán (2000) which all confirm that the isoelectric point of pure Bentonite exists at a pH between 5 – 7.
The rise in yield stress between the pH of 8-10 is indicative of the natural pH and yield stress of a Bentonite suspension. It is at this range where card-house structure is at its strongest. Choo and Bai (2015) noticed similar results in their study and found that this occurs because the thickness of the double layer decreases due to its compression at a higher ionic strength. It is likely in this experiment that at a pH of 9, ionic strength of the particles was strongest. A large amount of initial stress would have to be applied to the suspension to generate flow and thus a high yield strength was observed.
Above pH 9 for Bentonite showed a big drop in yield stress, as literature suggests, this drop-in yield stress could be a result of a change in the particle structure in the suspensions (Lagaly, 1989). Because of high alkaline environment, the net charge of the particles would be negative and repulsion would occur between the particles. This would promote disintegration of the particles resulting in low yield stresses. Au et al. (2013) backed up this finding, instead attributing it to the formation of a face-face, band-like structure in highly alkaline environments.
pH effects on yield stress for Kaolinite suspensions seemed to be slighter then Bentonite. But the general behaviour between pH and yield stress was comparable to Bentonite suspensions. However, unlike Bentonite, the yield stress behaviour above the pH of 7 was very different. At a pH above 7 the yield stress of Kaolinite was observed to be almost zero. This is because, at high pH levels the entire Kaolinite particle surfaces are negatively charged (edges and faces have negative charges) (Au et al. 2013). This causes a breakdown of the house-card particle structures due to electrostatic repulsion among Kaolinite particles. Thus, particles are fully dispersed in the suspension, meaning that a yield stress will not be present.
Below a pH of 5, both Bentonite and Kaolinite exhibited similar trends. The spike is yield stress was observed at pH levels below 5, which suggests that, as pH of Kaolinite and Bentonite decreases below a neutral pH of 7, there is a higher presence of H+ ions. These H+ ions continuously adsorb onto the edge sites of the tetrahedral platelet structures, creating a strong positive charge on the edges of the platelets (Au et al. 2013). Strong electrostatic attraction between the negative charged faces and positive charged edges of the Kaolinite and Bentonite particles strengthens the card-house structure into a 3 dimensional tactoidal network. This network offers a large resistance to flow, thus a large yield stress is observed. The Kaolinite behaviour agrees with similar results observed by Teh et al. (2009) which found that yield stresses where significantly large for pH values from 2-7 but was close to zero for pH values above 7. Au et al. (2007) along with recent studies on pure Kaolin clay further emphasise the acidic behaviour of Kaolinite suspensions.
While pH does not seem to influence viscosity at high shear rates, it is evident from the results in this investigation that the yield stress is impacted by pH. In fact, it can be concluded that the high yield stress of certain pH’s cause the clay suspensions to behave like a plastic (shear-thinning). Thus, high viscosity is observed initially but behaves Newtonian as higher shear rates are applied. Samples with a very low yield stress seem to behave like a Dilatant material and therefore have very low initial viscosities. Low yield stresses for Kaolinite and Bentonite corresponds to a pH whereby the surface charge on the particles are negated or disrupted, resulting in a structure which becomes fully dispersed in the suspension. Bentonite forms an isoelectric point in the pH region of 5-7 while Kaolinite has very low yield stress at a pH above 7. For applications were low viscosity and yield stress are required (e.g. Pumping/transportation), it is recommended that Kaolinite is kept at a pH above 8. Similarly, for Bentonite, pH should either be modified to approximately 6 or above 11 for optimal pumping efficiency.
4.3 Influence of temperature on clay rheology
Temperature studies were conducted using a pure Bentonite (6 wt. %) and pure Kaolinite (10 wt. %) suspensions. Relationships between shear rate and shear stress for both clays can be seen in figure 17 and 19 respectively. For Bentonite and Kaolinite, temperature samples of 25°C, 30°C, 35°C, 45°C and 55°C where set and tested on the rheometer. The common trends in the graph for Bentonite show that the degree of pseudo plasticity decreases as the temperature of the sample is increased. Based on the data in table 5 the Herschel–Bulkley constants were the most accurate parameters compared to other models fitted to the data. In table 5, the flow index sharply increases to 1, indicating that the flow becomes Newtonian as temperatures rise. This means that at every shear rate, shear stress will be larger for temperatures below 30°C. Above 30°C the difference in shear stress at each shear rate becomes smaller for each temperature. Figure 18 illustrates how apparent viscosity decreases with increasing shear rate, given the increasing pseudo plasticity (shear-thinning) behaviour, initially, viscosity decreases more rapidly for high temperature samples (55°C) compared to the room temperature sample of Bentonite. At high shear rates (above 600 s-1) all the Bentonite samples becomes fully Newtonian.
Figure 19 and 20 illustrates the shear stress changes under different temperatures for Kaolinite. The results clearly show that for low solid concentration (10 wt. %) there is virtually no trend as the temperature increases. Flow index (n) in table 5 clearly indicates no change in the flow behaviour as temperature changes. Based on figure 20, higher shear rates begin to show a more Newtonian flow, but at low shear rates the apparent viscosity shows shear-thinning behaviour. The only exception to these results is the flow curve for Kaolinite at 25°C, which may be attributed to the fact that, the yield stress at 25°C is too small to cause any resistance to flow when movement is initiated. Therefore, in figure 19, complete shear-thickening behaviour is prominent for Kaolinite at 25°C. However apart from this exception temperature has no effect on apparent viscosity until extremely high shear rates are applied. It can be said that as the temperature of both pure clay samples increase, the pseudo-plastic properties decrease substantially between a shear rate of 0 – 200 s-1. The common conclusion from these trends show that as temperature increases the apparent viscosity decreases. Reduction is viscosity as shear rate increases (shear-thinning) shown in the results is primarily due to progressive orientation of the individual platelets to the direction of the (Heller 2001).
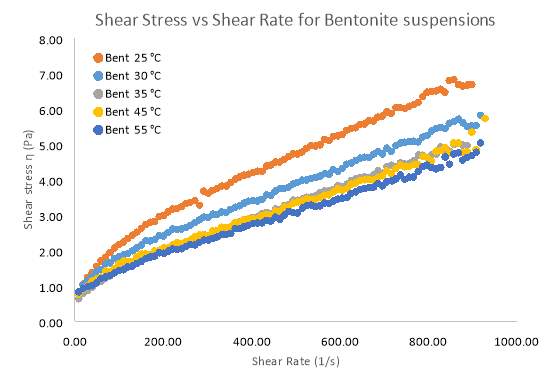
Figure 17 A Rheogram outlining the effects that different temperature samples of 6 wt. % Bentonite have on Shear Stress
Table 5 Flow index and yield stress of different 10 wt. % Kaolinite and 6 wt. % Bentonite samples
| Bentonite (°C) | Flow index (n) | Yield Stress (Pa) | Kaolinite (°C) | Flow index (n) | Yield Stress (Pa) |
| 25 | 0.06317 | 0.6148 | 25 | 1.649 | 0.04783 |
| 30 | 0.6931 | 0.6215 | 30 | 1.635 | 0.06401 |
| 35 | 0.8543 | 0.6456 | 35 | 1.681 | 0.0979 |
| 45 | 0.9472 | 0.9137 | 45 | 1.632 | 0.1185 |
| 55 | 1.05 | 0.9488 | 55 | 1.688 | 0.1631 |
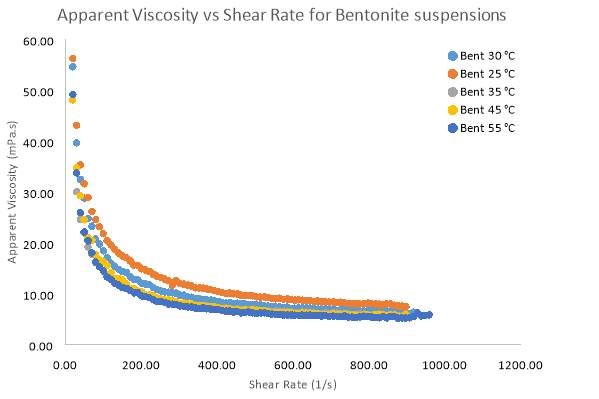
Figure 18 Apparent Viscosity vs Shear Rate for samples of 6 wt. % Bentonite with varying temperatures
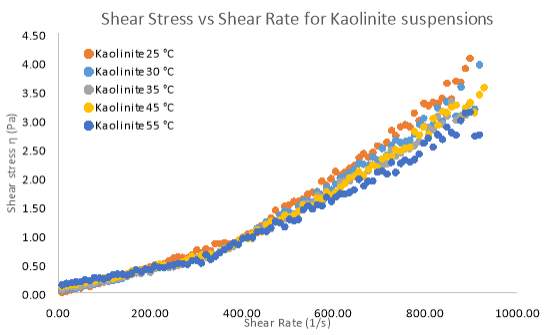
Figure 19 A Rheogram outlining the effects that different temperature samples of 10 wt. % Kaolinite have on Shear Stress
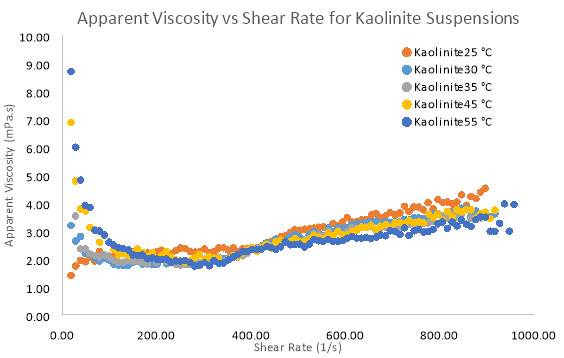
Figure 20 Apparent Viscosity vs Shear Rate for samples of 10 wt. % Kaolinite with varying temperatures
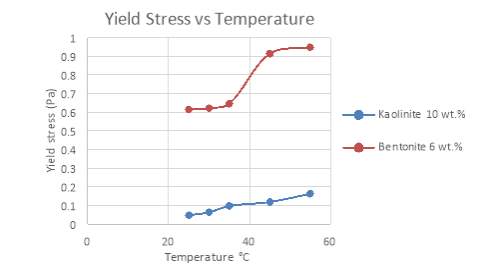
Figure 21 Yield Stress of Bentonite and Kaolinite under different temperature conditions
Another common finding in these results indicates that the yield stresses of both pure suspensions rise as the temperature increases. Figure 21 highlights the relationship between yield stress and temperature for both clay suspensions. Yield stresses of Bentonite seem to steadily increase, but surge at a temperature above 40°C. Kaolinite shows a more linear trend, proving that while yield stress increases, the relationship between temperature and yield stress is insignificant. So, it can be said that Kaolinite has a low sensitivity to temperature changes while Bentonite is quite the opposite. Mikulasek et al. (1997), Vryzas et al. (2017) and Alderman et al. (1988) all verify the behaviour outlined in this investigation in regards to clay slurry solutions.
It is known that the surface of the clay particles is made up of sheets or platelets stacked together forming a tactoid (Shomer, 1978). The structure of both clays is based on the edge- face, card-house model where tactoid faces have a negative charge while edges have a positive charge resulting in an attraction that keeps the particle stable (Lagaly, 1989). When temperatures are high, there is an increased Brownian motion (random motion of the particles) due to increased kinetic energy of the particle structure (Vryzas et al. 2017). Random movement of these particles would result in electrostatic repulsion between faces of 2 neighbouring plate surfaces (of similar charge) as they come into contact because of the random motion (Lin et al. 2016). Repulsion between the tactoids is supported at higher temperatures since motion becomes more Brownian. Consequently, the stability of the particle suspension decreases; particles are fully dispersed in the solution causing resulting in a higher yield stress.
The increasing random motion of the clay particles could also explain the observations of Bentonite and Kaolinite in relation to the rheogram plots. Increasing repulsion between the faces of the platelets means that particle structures would be dispersed in the suspension additionally as temperature increases. As the data suggests, the better dispersion due to weak electrostatic interaction means there is less resistance to motion as shear rates increase (Lagaly, 1997). The increased kinetic energy would also cause breakage of the intermolecular bonds between the particle layers, weakening the network structures of both clays and would explain the decreasing viscosity as temperature increases (Kumar 2009). Figure 17 and 18 illustrates that viscosity is lower at high temperatures when shear rate increases. Low temperatures (25°C – 30°C) show a minor sensitivity to increasing shear stress, resulting in higher constant viscosity at high shear rates. Once again the Kaolinite showed similar trends to Bentonite, however being a non-swelling clay (Goh, 2011) the viscosity effects of Kaolinite on Temperature where minor compared to Bentonite. The shear-thinning nature of all the samples once again coincides with the fact that increasing shear rates will always align particles and cause a decrease in viscosity (Kumar 2009).
In conclusion, temperature increases seem to significantly affect the flow behaviour of Bentonite and mildly affect the flow behaviour of Kaolinite. The general trend shows that as temperature increases, viscosity decreases. in fact, the rate at which viscosity decreases in the initial shear rates is much higher at temperatures above 45°C (shear-thinning). This would mean that the processing or pumping of clay slurries can be more economical at temperatures above 45°C. In addition, for applications requiring low yield stresses, higher temperature clays should be used to obtain the best results.
5.0 Conclusion
Based on the data obtained from these investigations, the Herschel-Bulkley model was the most accurate model to predict the flow of Bentonite and Kaolinite under the changing physical and chemical properties of the clay suspensions. All investigations established the fact that both Kaolinite and Bentonite are non-Newtonian in their flow behaviour further emphasising the use of the Herschel-Bulkley model. All investigations proved that both clays at higher concentrations all showed shear-thinning behaviour due to the progressive orientation of the particles in the direction of flow, thus reducing the viscosity as shear rate increases.
It can be concluded that non-swelling clays such as Kaolinite, have the least effect on both slurry yield stress and viscosity, but highly swelling clays such as Bentonite have a dramatic effect on viscosity and yield stress of slurry. The presence of smectites with interlayer cations between platelets in Bentonite causes the cations to be hydrated when water is added. Adding more solid, causes the particles to flocculate and form strong card-house structures. This was found to linearly increase the yield stress of Bentonite as more solid was added. Pseudo-plasticity dramatically increased for Bentonite as solid concentrations increased. Thus, the results clearly showed increasing shear-thinning behaviour in regards to higher solid concentrations as strong network structures of Bentonite were broken down resulting in a drop-in viscosity. The results showed that non-swelling clays such as Kaolinite at dilute solid concentrations virtually exhibit no yield stresses and experience Dilatant like behaviour for low shear rates and further proves that Kaolinite is experiences shear-thickening by nature. Yield stress did however increase exponentially as the solid concentration was increased, again due to the increased formation of the card-house network structure. Viscosity behaviour was comparable to Bentonite at high solid concentrations of Kaolinite (15 wt. %), but lower concentrations resulted in viscosity increasing as shear rate increased.
Studies on the effects of pH change on suspensions of Bentonite and Kaolinite, gave some interesting results. Firstly, it was clear that pH had no influence on the apparent viscosity of Kaolinite and Bentonite samples when exposed to high shear rates. While all samples generally displayed identical trends with regards to the rheogram, there were pH points for both Bentonite and Kaolinite that showed a sudden change in rheological behaviour of the suspensions. For Bentonite, only pH levels of 1.4 and 9 showed shear-thinning behaviour at a low shear rate (0 – 400 s-1) range. Whilst in general all pH samples of Bentonite exhibited shear-thickening behaviour; in the entire shear rate range. At these pH points the yield stress and viscosity was also recorded as being higher compared to pH levels of 4.87, 6.81 and 10.85 which were virtually identical in their behaviour and had yield stresses which were close to zero. The dip in yield stress between pH 5-7 is attributed to the presence of an isoelectric point (IEP). In this acidic region, the negative edge charge of the particles was no longer sufficient to hold together the network structures, thus reducing the apparent viscosity and yield stress. At a pH of 10 there was a spike in yield stress and apparent viscosity which could be attributed to the decrease in the thickness of the double layer between the particles due to compression. What is clear in this investigation is, just how different the surface charges of Kaolinite are compared to Bentonite. From the results, Kaolinite did not exhibit an isoelectric point in any pH range. In fact, all pH samples above 7 had a very low yield stress and exhibited shear-thickening behaviour, while pH samples below 5 showed a spike in yield stress and exhibited shear-thinning behaviour. this could be primarily attributed to the fact that the higher acidic environments strengthen the edge charges on the particle platelets, resulting in a stronger card-house structure which ultimately results in more aggregation and higher yield stresses.
Common findings in the temperature studies for both Kaolinite and Bentonite show that, as the temperature of the samples increase, apparent viscosity decreases; A discovery that was found to be more prominent in Bentonite. Temperature effects indicate the contribution of Brownian motion to the breakage of particle interaction because of repulsion of electrostatic forces. Another interesting trend showed that yield stress of the Bentonite and Kaolinite samples increased as temperature increased. Therefore, higher temperatures would reduce pumping costs, but higher temperatures would also cause issues in industrial applications due to the increasing yield stress properties. Ideally surface charge characteristics for Kaolinite and Bentonite will play a significant role in the slurry flow. A pH of 5-7 or 11-14 for Bentonite is most suitable in applications where lower yield stress and viscosities are needed. While for Kaolinite all pH’s above 7 would be suitable for applications where transport and pumping of the slurries are required. Finally, rheology, especially for Bentonite has the most sensitivity to solid concentration. Therefore, adding more solid would significantly raise the costs associated with pumping and processing the slurries.
Cite This Work
To export a reference to this article please select a referencing stye below:
Related Services
View all


Related Content
All TagsContent relating to: "Farming"
Farming is the business or activity of working on a farm. Farming activities include ground preparations, sowing or planting seeds, tending crops, or activities involved in the raising of animals for meat or milk products.
Related Articles

DMCA / Removal Request
If you are the original writer of this dissertation and no longer wish to have your work published on the UKDiss.com website then please: