Relationship Between the Internet and the News Industry
Info: 9019 words (36 pages) Dissertation
Published: 16th Dec 2019
How has the internet affected the way in which the British public accesses information?
Abstract
Introduction – Storytelling, then and now
Chapter 1. Misinformation – The repercussions
Chapter 2. The BBC – Our only remaining reliable news source?
Chapter 3. Statistics – A secondary research task
Chapter 4. Primary research methodology
Chapter 5. Primary research – findings and reflection
Summary of findings
Conclusion and evaluation
Bibliography
List of illustrations
Appendix
Summary of research methodology
Throughout this dissertation, secondary research will be carried out, gathering data from a variety of sources. The researcher will make use of books, journals, news articles and online resources.
The data gathered will be studied in order to understand the current trends in the news industry, both on television, in traditional print and online.
Any patterns over time or across demographics will be identified with the intention of better understanding the changes happening within the news industry.
Primary research will also be carried out in order to collect more up to date figures and to provide much more in depth information and personal insights. This will allow the researcher to see things from the point of view of the consumers of the news industry and therefore expand on the knowledge gained from the secondary research. The data will be analysed using Microsoft Excel and the resulting statistics will be processed into graphs and charts to allow for clear visualisation of the findings.
From this collection of primary and secondary data, both quantitative and qualitative, conclusions may be drawn and suggestions made on how best to legislate and plan for the future of news industry.
Abstract
This dissertation will provide insights into the ever changing structure and demands of the news industry. It will look at the shifts and trends of the media over time, from the first broadcast of the British Broadcasting Company in 1922 to the instant Tweets of the 21st century. Changes in television viewing figures over time will be looked at and compared with possible affecting factors such as the use of social media and changes in sales of newspapers.
Conclusions will be drawn from the research which may prove useful for governing bodies and for creating up to date legislation that is more relevant to today’s news industry than ever before.
Introduction – Storytelling, then and now
Journalists and news channel presenters are essentially storytellers, creating their own twist on a piece of information and passing it on to others in a way they see fit. Whilst newspapers, radios and televisions as we know them today, are relatively recent commodities in the timeline of humankind, storytelling is nothing new at all.
The cognitive revolution in humans was the kick start to the world as we know it today (Harari, 2014: page?). Communication was man’s greatest advantage in the animal kingdom and storytelling played a huge role in the development of humankind, allowing us to find ways to pass on knowledge effectively, to warn others of enemy tribes and to give directions to sources of food. Some of the earliest examples of this can still be seen today in the Parietal art created on the cave walls of pre-historic settlements see (fig.1). Some of these pieces are known to be 2500 years old. The purpose of these etchings, paintings and carvings is likely to have a story-telling role, be it religious, instructive or simply to pass the time.
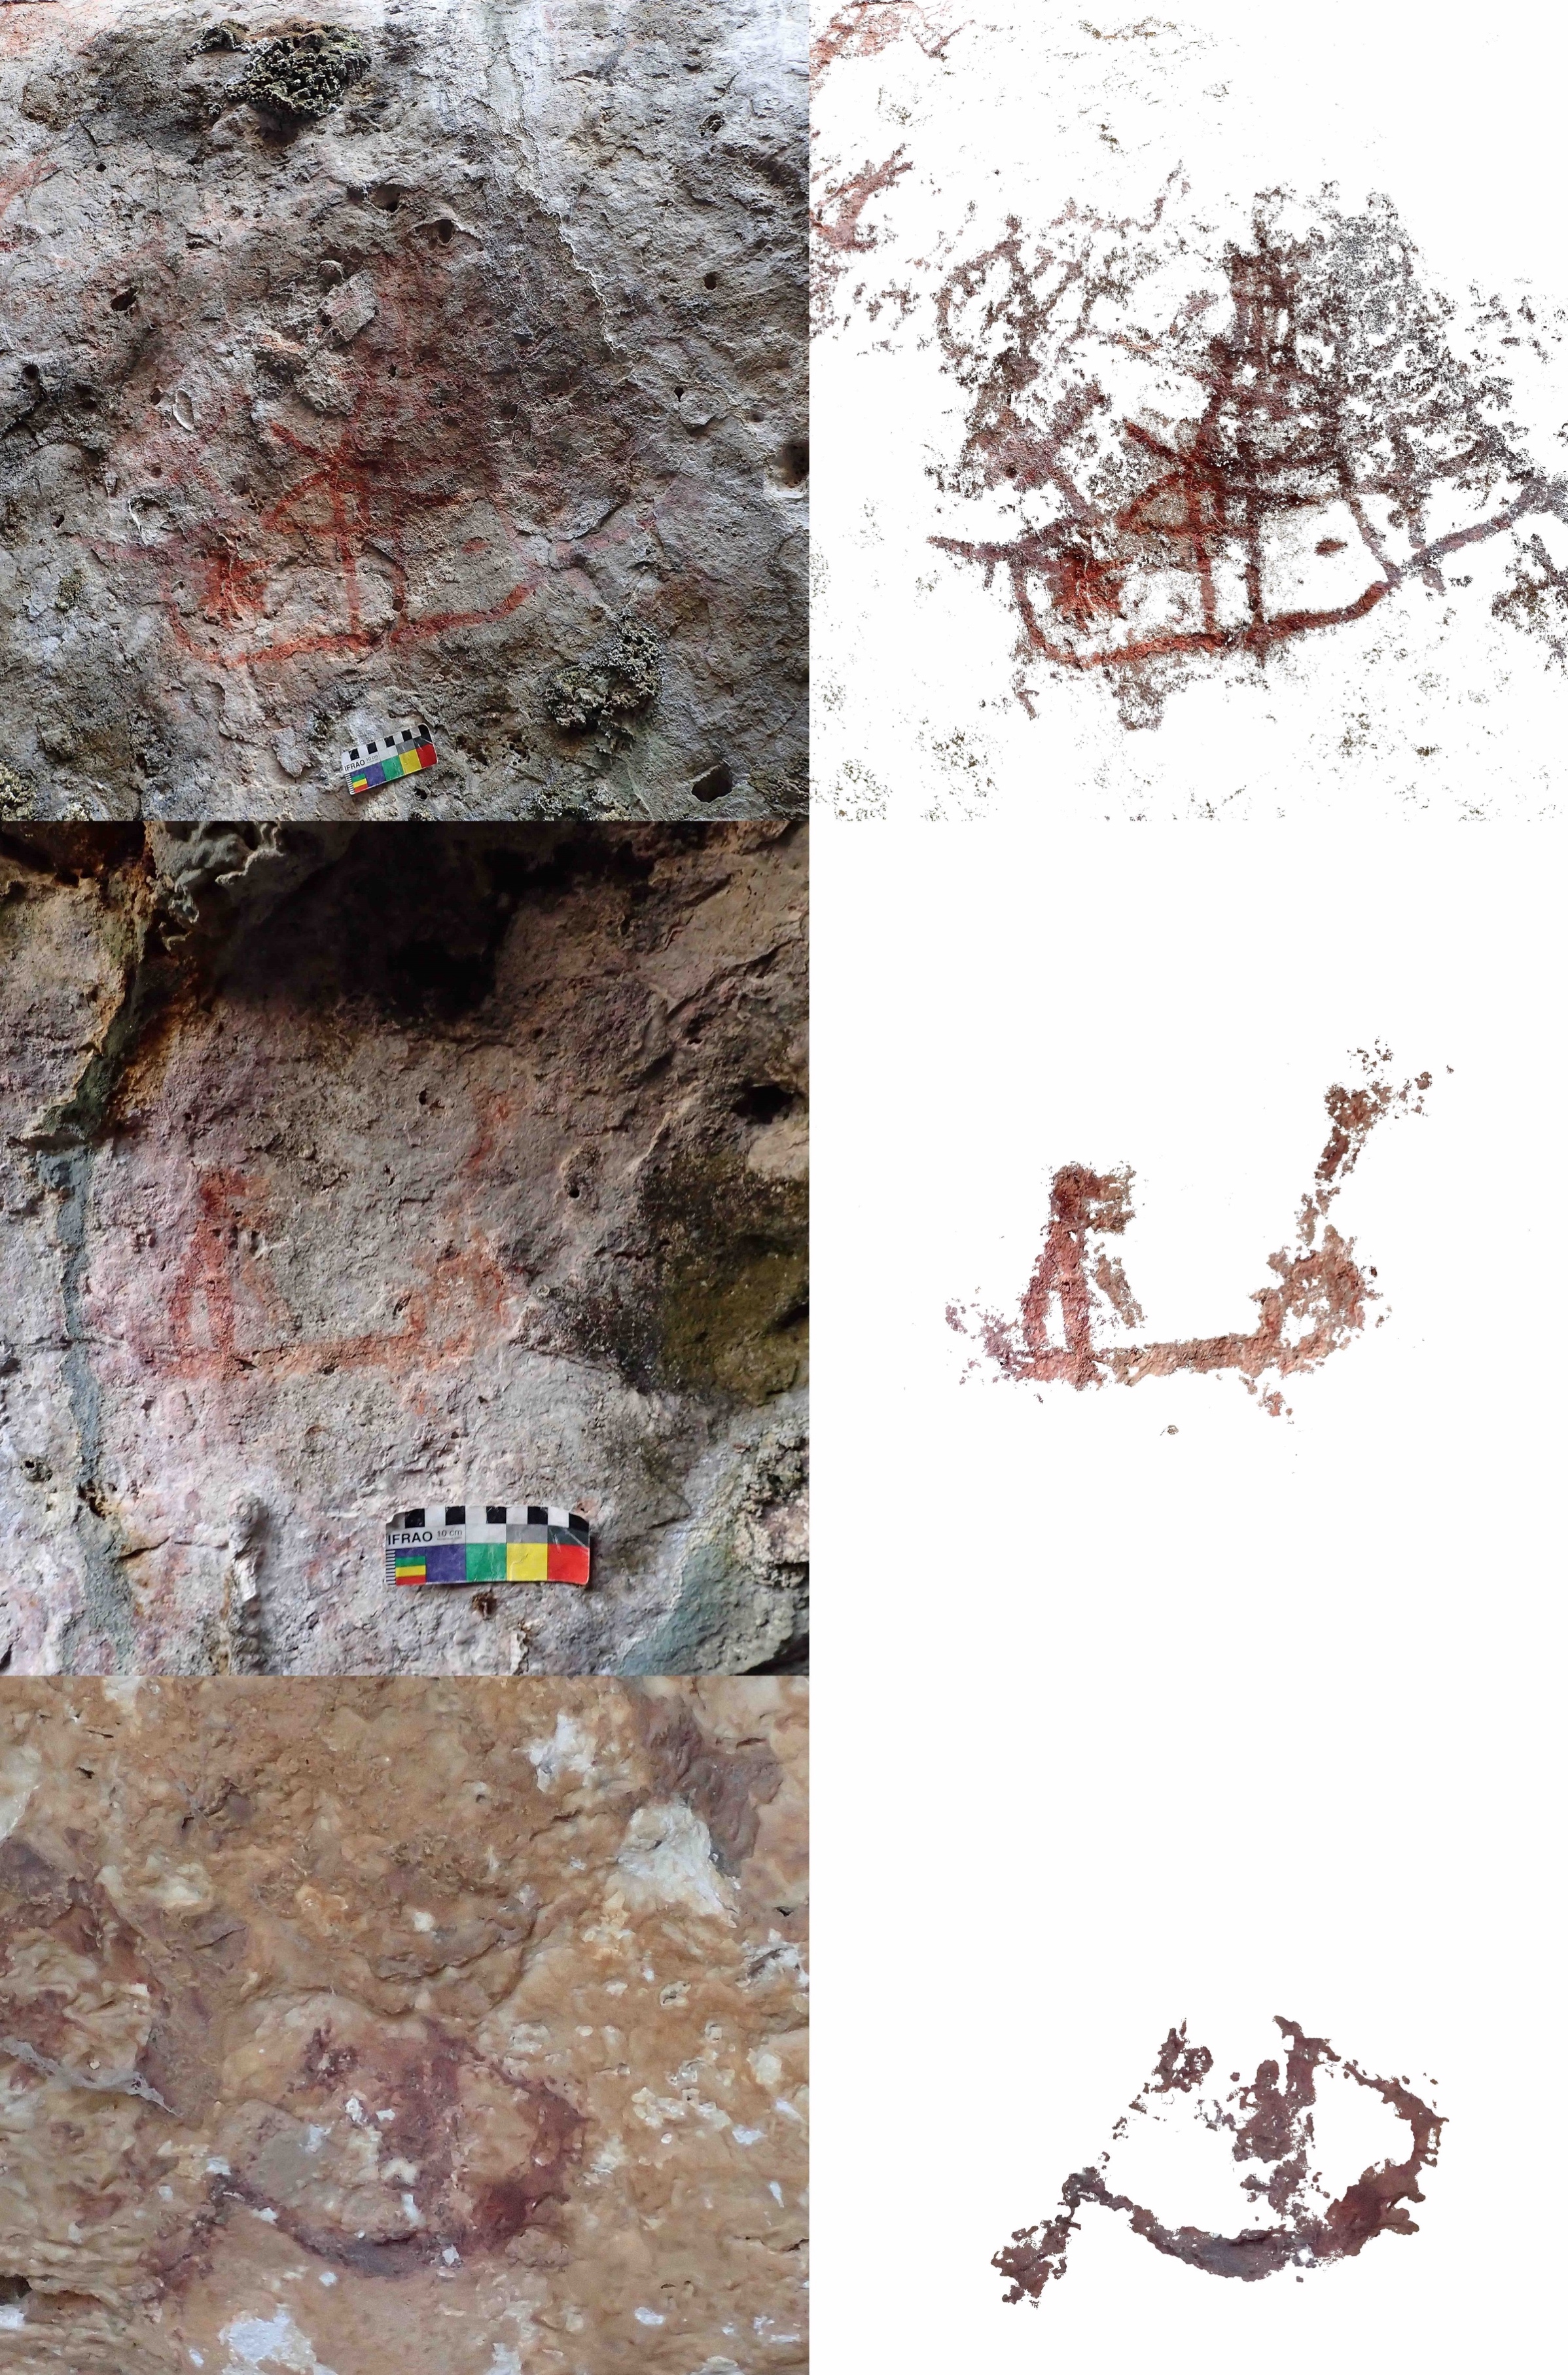
Fig.1 ANU Cave paintings found on the Indonesian island of Timor-Leste.
This level of communication paved the way to an arguably more civilised and inclusive society with the creation of religions, fables and old wives’ tales. It could be said that the need to share stories is so embedded into humankind’s history that it has now become a part of our nature. Storytelling in the 21st century is very much alive and well.
Multi-million pound industries rely on effective storytelling, a great example of this being the advertising industry. Advertising is essentially the creation of a narrative to describe a product or experience and to make it more desirable to the consumer. It was estimated that the UK’s spending on advertising in the year 2016 sat at £21.19bnand was forecast to increase to £22.35bn in 2017 (Fuller 2017: online)
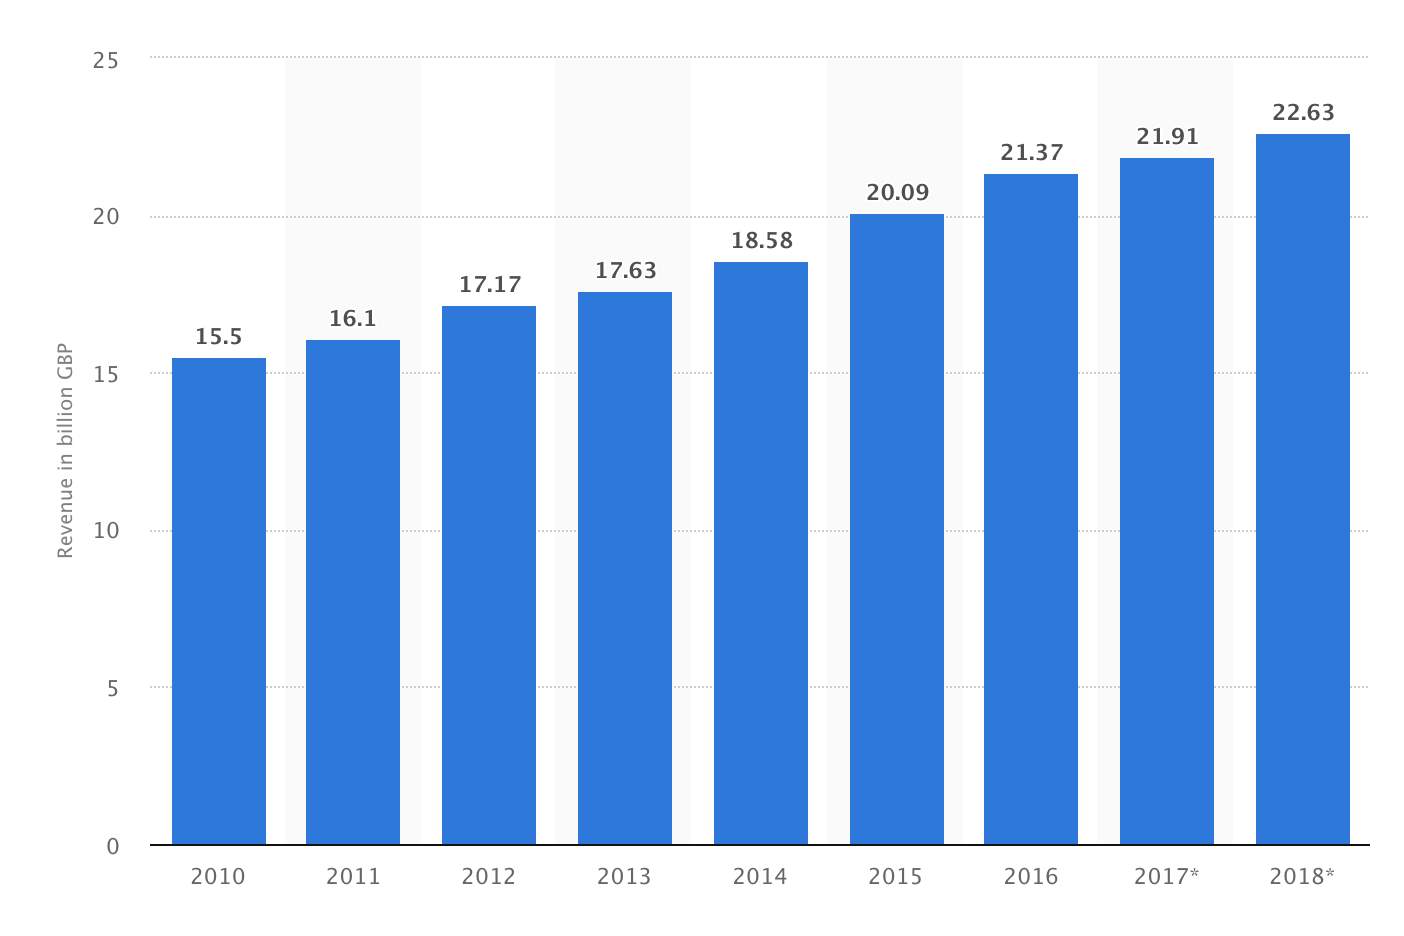
Fig.2 Statista Advertising expenditure in the United Kingdom from 2010 to 2018 (£bn).
As well as the advertising industry, the potential to make money from storytelling can be seen in many forms. Families have made entire careers from telling the story of their lives to others. Take for example the Kardashian family, who launched their reality TV show ‘Keeping Up with The Kardashians’ in October 2007 and whose family members have each built huge online followings of their own. Kim Kardashian alone earned an estimated $51m (USD) between June 2016 and June 2017 (Robehmed 2016: online) and has over 58 million followers of her Twitter account. These figures alone show the extent to which the public takes an interest in others and the stories they have to tell. The viewer ratings of the Kardashians’ reality TV show have slowly declined over the 10 years since it was first aired, but this may not be a direct reflection of the level of the public’s interest in the family.
Today, each Kardashian has millions of followers across their social media profiles all with actively engaged readers. This, evidenced by the thousands of responses received in the form of ‘retweets’ and ‘likes’ of any given post. It could be argued that these changes show a decline in the use of Television and instead a shift towards the use of the internet. This shift has become a large topic of conversation and for some, an area of concern.
With the explosion of social media, stories are no longer passed carefully from person to person or family to family but rather broadcast to thousands and sometimes millions of ‘followers’ or ‘friends’. Some celebrity Twitter accounts give evidence to this, with the singer Katy Perry having 108 million followers as of 7th January 2018 and Barack Obama weighing in at third place of the world’s most followed Twitter accounts with 99 million followers (Unknown: online).
Whilst this is similar in many ways to the previous example of ‘Keeping Up With The Kardashians’, social media makes way for more immediate sharing of a story. A TV show takes time to be filmed, edited and then has to wait for its slot before it is aired. By this point any story covered in the latest episode may already be considered to be old news, by more modern standards, as it is likely that any viewers will have already heard the story online by following the celebrity on Instagram, Twitter or any other social media they may use. This could explain the decline in viewer ratings despite the increase in size of their social media following. Their audience are demanding more instant updates and can find this through social media. Television is no longer up to speed and it could be said that this therefore makes it less desirable in today’s impatient pop culture. Statistics to show this shift can be found in chapter 3.
Twitter allow their users to post their thoughts and feelings instantly to a varied audience, sometimes to a select and chosen few followers, sometimes publicly to the masses. With the addition of hashtags, these posts known as ‘Tweets’ are easily accessed by any user of Twitter. The advantages and disadvantages of this new way of sharing information are up for much debate.
A celebrity or artist sharing information on their recent works or upcoming shows seldom causes harm. However, with politicians and highly influential figures taking to social media, things can quickly become more hazardous.
Often, after an incident of huge public interest, Twitter and many social media erupt with the posting and sharing of information, photographs, videos and witness accounts. It can be said that there is very little in the way of legislation or guidance to ensure that the information shared is accurate, fair and representative of the incident.
Until 7th November 2017, Twitter allowed each user, with the exception of a chosen few accounts, a maximum of 140 characters per Tweet. It could be argued that this very narrow limit provides only a small platform for information, on which it could be almost impossible to hold any substance or give any room for in-depth information and could therefore restrict the understanding of its audience. How can an account of an event such as the Manchester bombing, so tragic and unexpected, be explained with the accuracy and empathy it deserves in just 140 characters?
It could be said that this online environment creates the perfect breeding ground for the spreading of misinformation, be that intentional or not, and perhaps a level of misunderstanding by the public as a result.
When opinions are broadcast instantaneously, a general trend in public response can often be seen. A tweet can be written wherever, whenever by whoever and can be posted for thousands to see in just a split second. When emotions are running high after an event such as a terror attack or during times of turbulent politics, it could be all too tempting for a Twitter user to allow their attention to detail and truth to slip and to post a Tweet which could later be seen as inaccurate or even prejudiced.
For a user with only a small number of followers, this is not such a risk. However, to those with thousands of followers, a quick comment can easily slip out of control. Twitter has played host to many examples of this, with celebrities often facing a backlash from the online public after posting ill-considered Tweets.
It could however be argued that this potential to spread misinformation or questionable opinion is nothing new. Many British newspapers have come under fire for printing inaccuracies or for creating garish headlines to deliberately cause shock and to therefore increase the temptation to read further, thereby increasing sales.
With newspapers however there are many journalists involved in the printing of a story. Usually, a headline and its text will go to press overnight, creating a few hours of lead time before its words are available to the public. This, in most cases, allows for the checking of facts, the amendment of any dubious content and the chance for reflection on the piece as a whole. There are instances where this is not the case, as outlined in the following chapter.
Contrary to this, with a Tweet or a Facebook status, the content is entirely directed by the single user, often without any advice from another party. It can be scribed in a moment of shock or anger and is available in a split second for all to see.
A newspaper headline does not have a face; it is not personal, it’s authors are shielded to an extent and so perhaps its message is not taken as literally or as personally. The opposite is true for users of social media, with their name and photograph the first detail to be seen.
This, in many cases however, can be used to bring about positive change. An influential figure can use their personality and platform on social media to raise awareness of a certain issue or to bring attention to a cause that needs exposure. However, this power also comes with its risks. An example of this can be seen with Donald Trump, President of The United States who to many, is known for his brash behaviour online whilst campaigning for presidency.
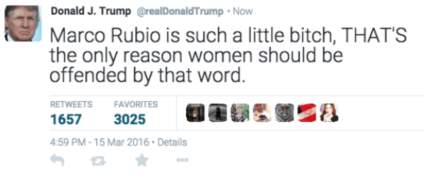
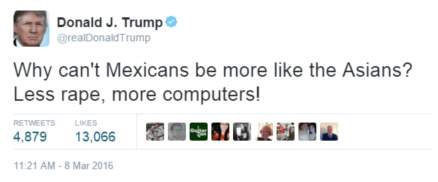
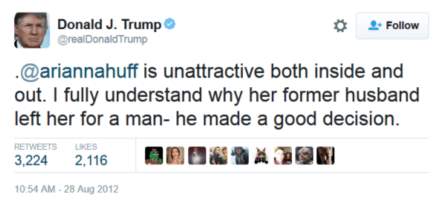
Fig. N Alec, The 29 most ridiculously offensive Donald Trump Tweets (2016)
Despite this, there are many who argue that the short character limit of Twitter and its culture of on-demand immediacy is not something to think of negatively. Barnard (2015: 4) argues that ‘brief narratives can constitute meaningful communication’. We only need to look into history to find proof that with writing, less can sometimes mean more. Short stories such as the Japanese verse form, the Haiku with just 17 syllables and perhaps most notably Julius Caesar’s ‘veni, vidi, vici’ are examples of very few words creating great impact and spreading powerful messages. Perhaps this could help to argue that it is not the number of words used in a story that matter, but the way in which it is distributed.
That said, many users of Twitter were disappointed to hear of the change in structure and the trial of a larger limit of 280 characters, double that of their original 140-character limit.
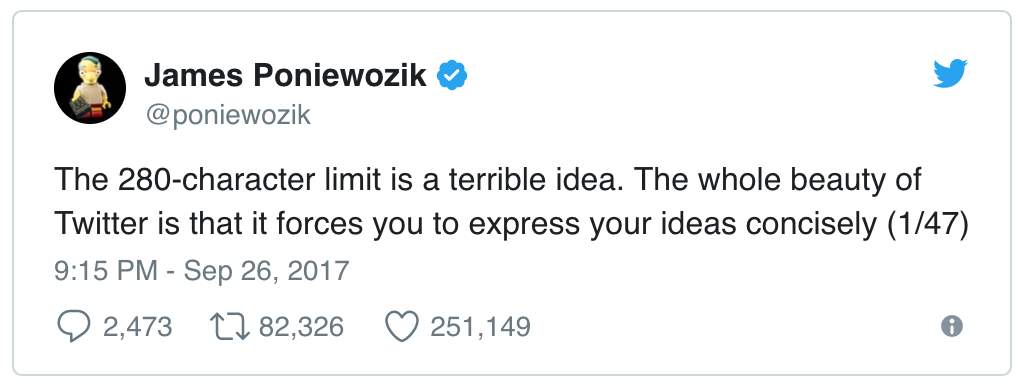
Fig.N Knight, D (2017)
https://www.theguardian.com/technology/commentisfree/2017/sep/27/brevity-soul-twitter-280-characters
This reaction sits well alongside the argument that we are now living in a society in which people are becoming more and more accustomed to having everything on demand, ready and waiting at their fingertips. Parcels can be ordered online within seconds and arrive the very next day. An entire meal can be ordered from a mobile app and be delivered within minutes, without the need to speak to a human. For many, it seems that the thought of having to spend twice the time to read a Tweet is not something to look forward to.
With this in mind, many would argue that our need for instant results now also applies to our sourcing of news and the news industry as a whole. Our 21st century society wants digestible information and they want it immediately. It seems that to sit and wait for the 5 o’clock news is no longer an option. To go out of one’s way to buy a newspaper that does not simply fit into a trouser pocket is no longer desirable to many.
To keep up with this change, most newspapers have had to create online versions of their papers. Apps have been created to send notifications of any breaking news straight to a reader’s mobile phone and online news agencies now email daily updates to their subscribers every morning.
Humankind’s methods of storytelling, from the very first cave paintings through to newspapers and radio broadcasts, are now shifting and evolving at a pace our society has never seen before.
This essay aims to look into these changes and discover what effect this is having on the news industry and what sort of knock on effect, if any, this has on the public.
Is our need for constant news updates putting journalists under too much pressure? Are we reading reliable information and making educated decisions based on this, or are we now becoming increasingly vulnerable to the persuasion machine that is social media?
Chapter 1. Misinformation – The repercussions
Guidelines and legislation for those using social media seems to be something of a grey area. For years, there have been no clear rules for what can and cannot be said or shared online. It is common knowledge that to follow somebody down the street, watching their every move and/or shouting abuse at them would be considered harassment and is very much illegal. However, when something similar occurs online, perhaps on Facebook or Instagram, it is much harder to know what to do about it, if anything at all.
The same is also true for the sharing of information. When a newspaper has printed a false or misleading story, it is often made to apologise and provide a correction in the next issue. When a person has had false news printed about them, they are able to take legal action and have governing bodies such as the Independent Press Standards Organisation (IPSO) to lean on. However, when this sort of misinformation is shared online, it is much harder to fight against as the sharing of content can quickly spiral out of control.
This chapter looks at examples of the sharing of misinformation, both online and in traditional print, and the resulting impact this may have on the public.
One of the largest and most infamous examples of deliberately misinforming headlines could be those of the Sun newspaper following the Hillsborough disaster in 1989. The paper alleged that the Liverpool fans caught up in the nightmare were shouting abuse, attacking police officers and stealing from the victims. To add insult to injury, the claims came underneath the bold heading ‘The Truth’, see (Fig. 5).
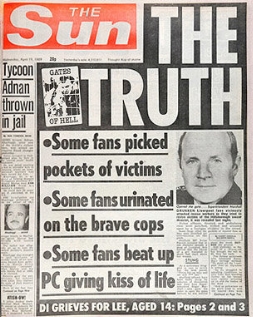
Fig. 5 York, C The Sun front page from 19 April 1989 (2016)
The public were outraged at these allegations. As a result of this shameful headline, many news agents in Merseyside boycotted the Sun and ‘although the editor at the time, Kelvin MacKenzie, later apologised, there will never be any room for the Sun in some Liverpudlian households ever again’ (Gibson, 2004: online). This example shows how the public can revolt against a newspaper. The Sun, and other papers like it are tangible items that must first be bought before they can be used. When readers decided in protest not to buy the Sun, the financial repercussions of the false headlines were felt, as well as their reputation taking a huge blow. However, with the way online news agencies or online versions of newspapers work, it could be much harder to see any such protest against internet-based news. Many newspapers are available to view freely online, so even though a paper’s online viewing figures may decrease, it is unlikely to have any financial impact on them.
This is, however, only true when it is only the readers that decide to turn their backs. Newspapers, including their online presence, can come into difficulty when the companies that pay to advertise amongst their pages decide to pull out. To make a difference in the news industry and to try to reduce the printing of misleading headlines, retailers and consumers had to join forces – some willingly and some after much campaigning. The Stop Funding Hate campaign is a movement which aims to persuade large retailers to think again about where they decide to spend their advertising budgets. This campaign gained speed when newspapers such as the Sun, the Daily Mail and the Daily Express were often found to be printing misleading and derogatory headlines when covering the European migrant crisis. The campaign urged members of the public to ask retailers such as John Lewis and Dove to think again about giving money to newspapers that print insensitive and de-humanising headlines, see (Fig. 6).
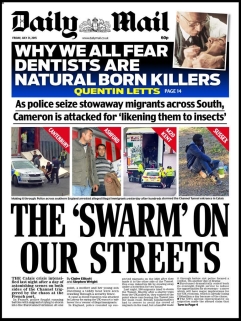
Fig. 6 Nardelli, Daily Mail front cover (2017)
A chain of boycotting threats ensued – consumers were promising to stop spending their money with a particular retailer if that particular retailer did not promise to stop paying for advertising space in the offending newspapers. When looking back to the figures in chapter 1 showing the advertising expenditure in the UK, it is no surprise that these threats to withdraw advertising from such papers may create leverage and a reason for newspaper editors to think again before they print.
The Stop Funding Hate campaign has also taken its efforts to the online news industry, asking retailers to not only pull their adverts from the newspapers who repeatedly print insensitive and ambiguous headlines but also to withdraw their advertisements from the online versions of these papers. By taking the campaign to the internet, the organisation managed to gain momentum as those who backed the efforts made use of Twitter’s hashtag function. When retailers are faced with thousands of online customers demanding they rethink their advertising, it is highly likely that they will respond. The Stop Funding Hate campaign has successfully persuaded many retailers to withdraw their advertising budget from these papers. In November 2016, Lego pulled their advertising from the Daily Mail, in 2017 the Body Shop followed suit and retailers such as ‘Bellroy, Thread and the Phone Co-op have all committed to ethical advertising, promising not to advertise the Daily Mail, Daily Express or Sun’ (Unknown 2017: online) [sic].
Newspapers have long held tendencies to print sensationalist headlines in order to boost their sales, however the findings in this chapter suggest that the public are more aware than ever before of this. Thousands of members of the public including former readers of newspapers both printed and online, like the Sun and the Daily Mail have come together through the Stop Funding Hate Campaign to say that enough is enough. As the campaign circulates online, it can be hoped that many other members of the public will take the time to read about the organisation and will be encouraged to think about which newspapers they buy, if any, and which headlines they choose to believe.
It will be interesting to see in chapter 4 what sort of impact newspapers have suffered over the last few years and whether or not they are still regarded by the public as a trusted source of news.
Chapter 2. The BBC – Our only remaining reliable news source?
The British Broadcasting Corporation has long been regarded as a gem in British culture.
Making its first broadcast via radio on the 14th November 1922, it has lived through and reported on almost a century of British history. After World War II, technology expanded and wealth started to grow. Television sales started to increase and by 1956, 5.7 million homes in Britain had a TV set (Unknown 2018: Online). This meant that the public had a new option as to where to source their information and find their entertainment. People no longer needed to leave their homes to watch a theatre play or to listen to live music, the arts had been brought to their homes.
Through the 1950s, Diggs-Brown (2011: 53) states that ‘television became a prime medium for molding public opinion.’ [sic] The way in which information was being passed to the masses was no longer restricted to radio shows and newspaper prints. Televisions were new and exciting and families would often gather around to watch a show together as it was transmitted into their homes. It could be said that this excitement and intrigue brought about a more captive than ever audience and with that, a new level of engagement with the starry eyed viewers.
The early managers of the BBC were quick to lay their foundations, firstly for radio and later for television. John Reith, a 34-year-old engineer, was interviewed for the first position of General Manager of the BBC. Having almost no knowledge of broadcasting, it was his strong personality and his vision that secured him the role. He was soon promoted to Managing Director in 1923.
Reith made it clear that the BBC was to be for the people, to educate and to entertain. Casting aside the opportunity to cash in on the advances made by advertising agencies, Reith made it clear that broadcasting was ‘too precious to be used merely to deliver audiences to advertisers.’ (Crisell 2002: 18). Instead, he sought to create ‘a comprehensive public service’ (ibid) for which he laid down 5 ground rules.
The 4th and 5th entries to these guidelines are arguably the most integral to the setting aside of the BBC from all other broadcasters.
The BBC was and always has been funded solely by the viewer, through the payment of a TV licence. This meant that the BBC could adhere to their 4th ground rule and ‘ensure that the cost of programmes were not related to audience sizes’ (ibid) and therefore ‘expensive programmes could be made for minorities’ (ibid). This allowed the corporation to realise its goal to not only deliver programming that would appeal to the masses by sticking carefully to the norm when scripting its storylines, but also to create documentaries and narratives covering niche topics that may only appeal to a few. In doing this, the BBC were able to cover a wide range of conversations and were not restricted to sticking to the status-quo therefore, arguably, broadening minds.
The 5th guideline was that the BBC was ‘to be institutionally and editorially independent’ (ibid) of pressures both commercially and governmental. This meant that the BBC would only air information that was ‘true and honest and just’ (Reith 2012) and did not need to have its scripts approved for the purpose of politicians or anyone of status. The TV licence meant that the BBC was not owned by anybody else and so it did not need to alter its broadcasts to please them.
These moral values and guidelines can still be seen in many ways. To this day, the BBC’s television channels do not feature advertisements. This could be so that, as outlined above, the corporation do not have ties to or hold obligations to any outside companies. It could also create a benefit that perhaps, decades ago, was never originally intended.
Looking back at the statistics shown in Chapter 1, it is clear to see that the advertising industry has boomed. Many people today do not like to see advertisements and some actively avoid watching or listening to them. One factor to evidence this could be the sales of advertisement blocking apps on the Apple App Store. In September 2015, Peace, an ad blocking app, sat at first place in the iOS paid apps (Bergen 2015: Online). This confirms that people are paying to avoid seeing advertisements and it could be argued that this may also apply to television. By not broadcasting adverts, programmes are not interrupted and as a result, unintentionally perhaps, viewers may have less reason to switch channels and therefore the BBC’s viewing figures may be benefitted.
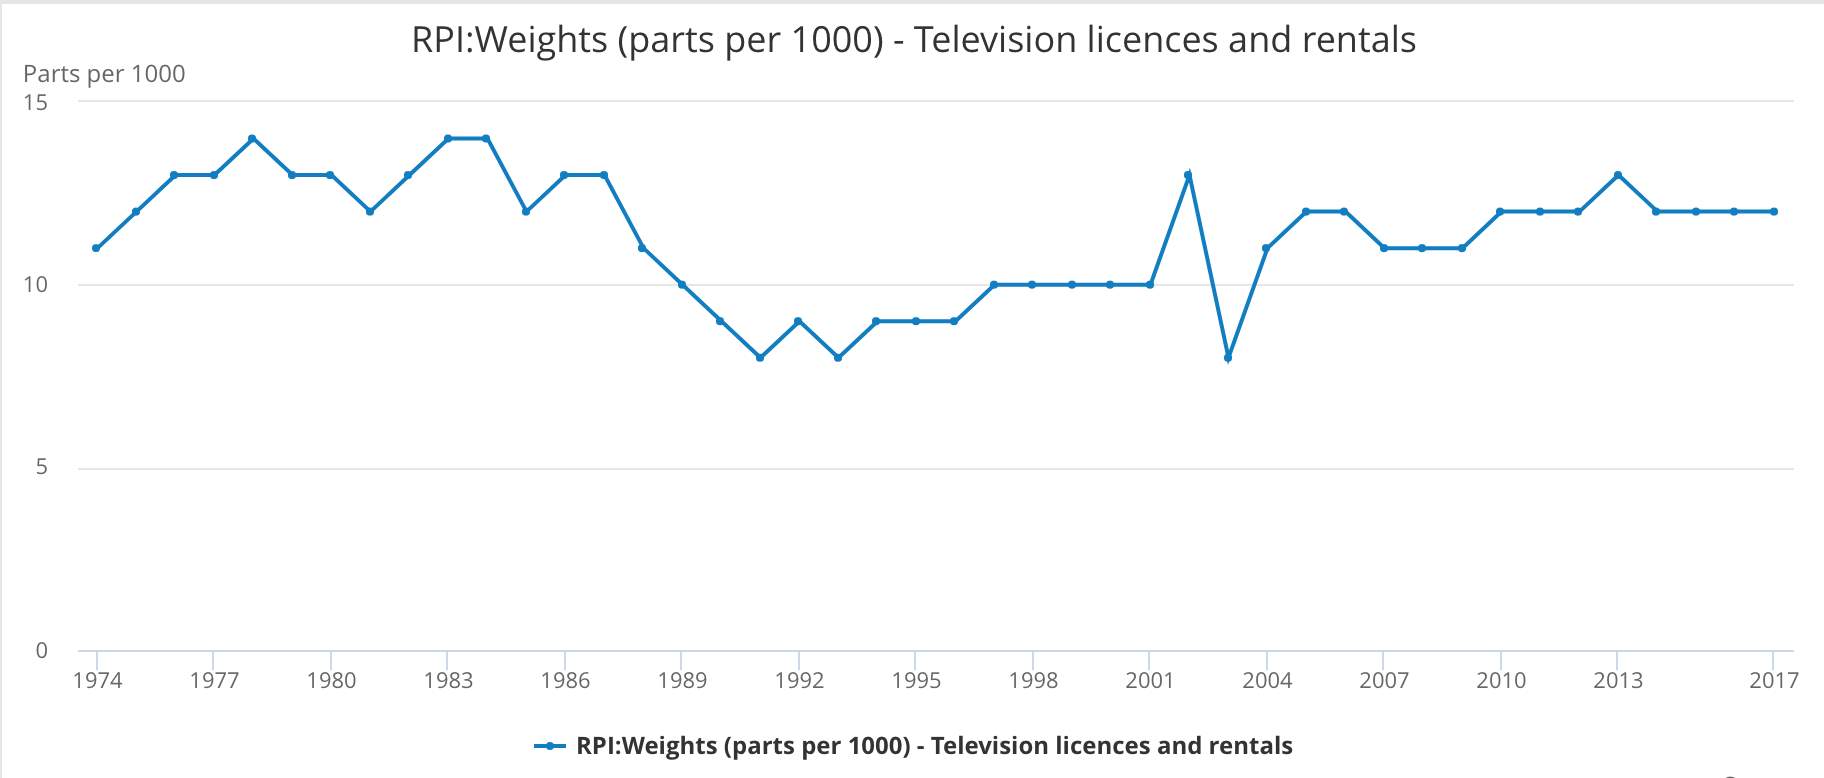
Fig.3 ONS RPI: Weights (Parts per 1000) – Television licences and rentals.
Chapter 3. Statistics – A secondary research task
Chapter 4. Primary research methodology
It was decided that, to gain a better understanding of today’s public and their preferences in sourcing news, primary research would need to be gathered. Statistics found through secondary research were useful for providing information gathered from a much larger pool of participants but did not provide much in the way of in depth, qualitative insights.
A questionnaire was designed to allow the researcher to gather much more personal responses and also provided more recent, up to date information and therefore increased validity.
The questionnaire was designed and structured in a way that would encourage both precise and definitive answers from 7 closed ended, multiple choice questions as well as more personal responses to the open ended question. It was vital to gather both quantitative and qualitative data in order to generate precise, numerical information as well as rich and in depth insights. The quantitative data allowed for direct comparison between categories and therefore allowed for identification of patterns, trends, and correlations. For example, it allowed the researcher to look for links between members of a particular age range and their tendencies to use social media.
The questions were as follows;
Q1 – Which age range do you fall in?
Q2 – Which gender do you associate with?
Q3 – Do you use any of the following social media platforms? Please circle all that apply.
Q4 – If you do use social media, how many times per day, on average do you access it? This includes using mobile apps.
Q5 – How often do you buy a newspaper?
Q6 – From where do you feel you most often hear/read about breaking news, political discussion etc.?
Q7 – Did you vote in the EU referendum? (Brexit)
Q8 – Other than your political opinion, which factors persuaded you to vote/note vote? e.g., party political broadcasts, discussions on social media, tabloids etc.
Question 1 intended to provide data on perhaps the most pivotal aspect of the research. Many of the following questions would be compared with and against the age of the participant. Question 2, gender, did not matter so much but was asked in case it was later found to be useful. For question 1, 4 and 6, groups of ranges were created. This was done to avoid having more data than was manageable. For instance, if question 1 were left as an open ended question, there could be around one hundred possible responses. By creating groups of ages and asking the participant to select the group that applies to them, the number of possible answers was reduced to 7. This in some ways may reduce the accuracy of the findings but meant that the resulting data was much more practicable and easier to digest for the researcher and any readers. This approach also applied to question 4 and 5, for similar reasons as well as a way of helping the participant to decide on an answer. It may be over facing for a participant to be asked exactly how many times a day they access social media or how often they buy a newspaper. Often, the number will vary from day to day or week to week. By creating categories, it was hoped the questions would be much more manageable for the participant and may therefore generate more reliable responses. Impatience
Question 7 was asked as a way of determining just how great an impact the participants’ day to day exposure to news and their favoured news source affected their everyday life and the decisions they make. An event such as a referendum, for many, is something to consider in depth and a choice that is not made lightly. Asking this question provided a sort of anchor point for the rest of the research. The question could only be answered with a ‘Yes’ or a ‘No’ and as such, it provided reliable, quantitative data. With this question came a slight limitation, some participants who were 18 years of age at the time of completing the questionnaire may not have been 18 when the referendum took place. Many of those to whom this limitation applied, highlighted this in their response to question 8. For some areas of the analysis of the questionnaire, these participants were omitted from the data. For other areas, their responses to other questions were still useful.
The questionnaire was shared online using SurveyMonkey.com as well as printed as a paper version to be handed out to the public. SurveyMonkey.com provided an online platform that allowed for easy sharing and therefore quick access to a large pool of potential participants. The questionnaire was shared on Social Media, giving people from all over the world the opportunity to click on the URL link and complete the questionnaire. This generated many responses however provided limited validity. Sharing the questionnaire in this way only would limit the variety of participants. It is likely that those who click on a link on social media are of a certain age and are already active users of the internet. In order to achieve its purpose, the questionnaire needed to be completed by a wider range of participants.
To overcome this limitation, the questionnaire was handed out to members of the public of all ages and backgrounds. Bean Loved coffee bar of Skipton kindly agreed to provide a platform for the research. Copies of the questionnaire were printed and placed into envelopes.
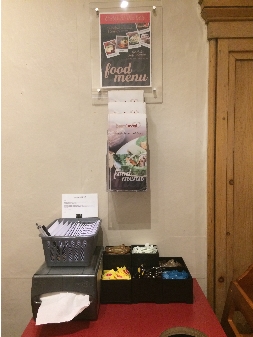
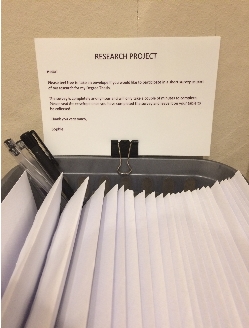
Fig.4 Wright Placement of questionnaires at Bean Loved coffee bar.
A brief explanation was left, inviting customers of the coffee bar to take an envelope and participate in the research, should they be interested. It was decided, with ethics in mind, that the envelopes would be left in a basket for customers to take freely, rather than being asked directly to participate and potentially feeling pressured or obliged to do so. Participants were made aware that the questionnaire was completely anonymous and were asked to seal the envelope once completed and leave it on their table to be collected and put away into the office by the wait staff. The researcher then collected the envelopes at the end of each day. In this way, the researcher would not know who had completed the questionnaire, therefore maintaining the anonymity of the participants.
The explanation of the questionnaire was brief so that the hypotheses of the research was not clear to the participant. This decision was made in order to avoid issues in validity caused by demand characteristics, the potential of participants to alter their responses to questions due to their interpretation of the questionnaire’s purpose (Orne 2009: 110).
A short paragraph at the end of the questionnaire thanked participants for their time and provided contact details for the researcher, should the participant have any questions or concerns.
The hypotheses of the primary research were as follows;
- The younger the participant, the more often they will access social media and vice versa.
- The main source of news for 18-24 year olds will be social media. Social media as a preference of news source will decrease as the age of the participant increases.
- The more frequently a participant accesses social media, the less likely they are to vote in the referendum.
- The more frequently a participant accesses social media, the less likely they are to buy a newspaper.
- Those who favour an internet based news source are less likely to vote in the referendum and those who prefer a non-internet based news source are more likely to vote.
Chapter 5. Primary research – findings and reflection
The results of the questionnaire were collated and inputted into a number of different graphs, tables and pie charts to better show the results and to allow for visualisation of the findings. The raw data can be found in the master spread sheet, see appendices.
Answers to each question were recorded individually, allowing the researcher to see any links between each individual’s responses on their own questionnaire as well as to highlight trends through the entirety of the data gathered. Some of the following sets of data support the original hypotheses of the primary research, whilst other sets neither prove nor disprove the assumptions.
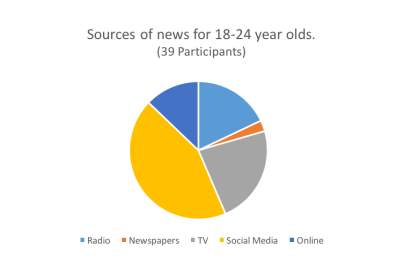
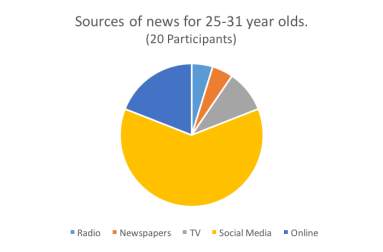
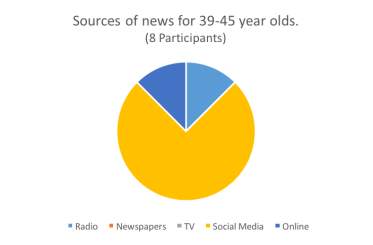
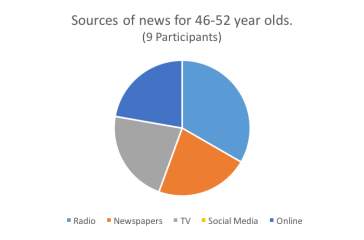
When looking at the previous pie charts, it is interesting to see the shift in preference of social media as a news source (question 6). It was expected that 18-24 year olds would hold the largest segment of the chart, yet it is the 39-45 year olds that show the highest percentage.
There could be a number of reasons to explain this result. 39-45 year olds may be more settled in their careers, homes and family life for example. As a result, they may feel they have more spare time to browse social media than somebody in their twenties and thirties who could still be starting out in a new career, studying and/or managing the task of raising a young family. This could limit the time they may have free to spend scrolling through Facebook and Twitter for instance.
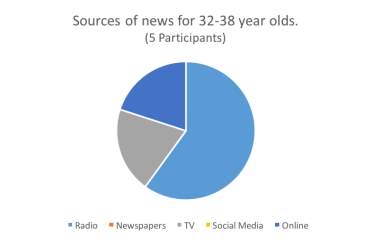
It should however be noted that the number of participants in the age ranges 18-24 and 25-31 years is significantly higher than the number of participants in the 39-45 years category. This could allow for more variation in responses in the larger categories and therefore a smaller segment for the response ‘social media’. To explain, between the 39 participants in the 18-24 years group, it is highly unlikely that all or most of them would select social media as their response. However, with only 8 participants in the 39-45 years category, similar responses are more likely. This however, does not explain the complete absence of social media as a response for the 32-38 years category, with only 5 participants. Perhaps 32-38 year olds do not access social media as often as others? To try to shed some light on this, the data was arranged into the graph below, showing the responses to question 4 of the questionnaire – If you do use Social Media, how many times per day, on average, do you access it? The graph shows the spread of responses in each age category.
A graph to show the average frequencies of social media access per day of members of each age range
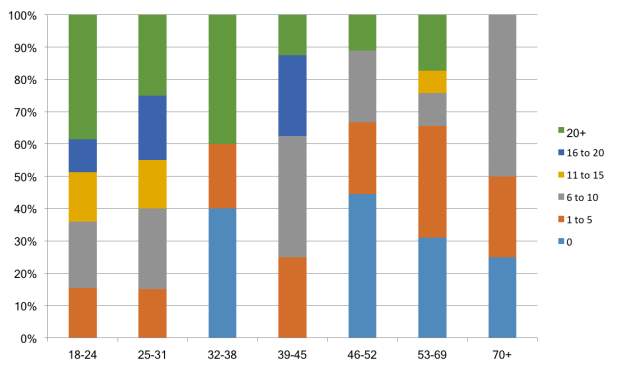
Response to question 4. (SM access frequency/day)
Percentage of total responses
Age Category (Years)
From this graph it can be seen that despite the 32-38 years category showing no responses of ‘social media’ to question 6, 60% of the group said they access social media (question 4) more than 20 times per day on average. This shows that it is not their time spent online that alters their preference of news source. This is also true for the 18-24 years category, with 60% of the group accessing social media more than 20 times on average per day, yet their responses to question 6 were not the same.
Whilst the 18-24 year olds and 32-38 year olds involved both access social media as many times per day as each other, their choices of news sources are different. The most popular news source for the 18-24 years category was social media, whilst for the 32-38 years category it was online news agencies.
Looking back at the pie charts, it could be argued that the members of the 32-38 years category use social media more for reasons related to keeping in touch with friends, sharing photographs and their own stories etc. whilst sourcing their news elsewhere, mainly from online news agencies as the data shows. It can be said that members of the 18-24 years category however, are using social media for many more reasons than the other age groups. It seems for them, Facebook, Twitter, Instagram and so on are acting both as a social tool and a news source. This then raises questions as to how reliable the 18-24 year olds’ news sources are. Thinking back to Chapter 2, there could be some concerns relating to accessing news mainly from social media.
To see whether those who access social media often or who list it as their main news source are exposed to news elsewhere, the following graph was generated. The analysis of this set of data allows the researcher to see the relationship between participants’ use of social media and their likelihood of buying a newspaper. It also allows for identifying trends across the age categories.
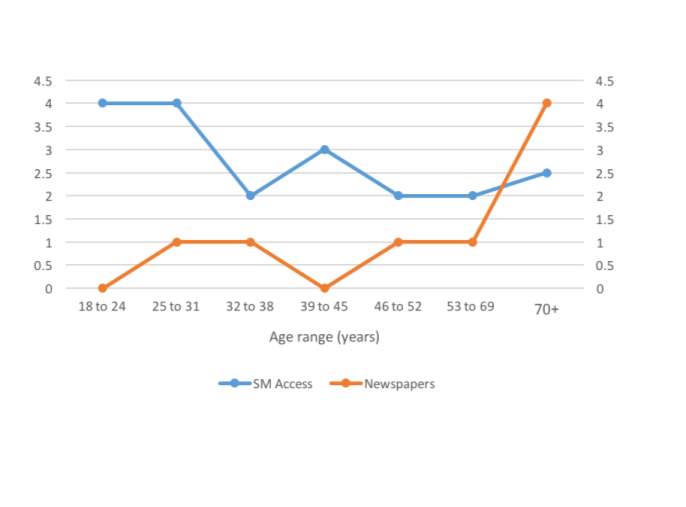
The graph shows a clear, inverse correlation between the frequency of using social media and the likelihood of buying a newspaper. We can see that 18-24 year olds show the greatest difference, with their average access to social media falling between 16 and 20 times a day and their tendency to buy a newspaper sitting at ‘never’. The opposite can be said for participants at the other end of the age categories where the two lines have now crossed over. This shows that participants aged 70 years or above are more likely to buy a newspaper than to access social media. This graph provides another visualisation of the differences in exposure, across the age groups, to various types of news sources.
It was decided that, to see whether or not an internet based news source had any bearing on the participants’ everyday life, their responses to question 6 would be compared with their responses to question 7.
Question 6 asks the participant from where they feel they most often hear or read about breaking news. The possible answers are listed below, showing whether the response is classed as an internet or non-internet based news source.
Radio = Non-internet
Newspapers = Non-internet
Television = Non-internet
Social media = Internet
Online news agencies = Internet
Each response to question 6 was then recorded against the same participant’s response to question 7 – Did you vote in the EU referendum?
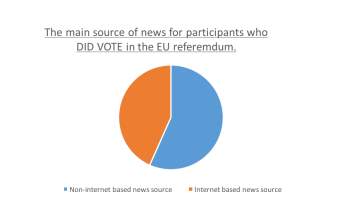 The findings of this analysis can be seen in the 2 pie charts below;
| Participants who voted; | |
| Non-internet based news source | Internet based news source |
| 56.67% | 43.33% |
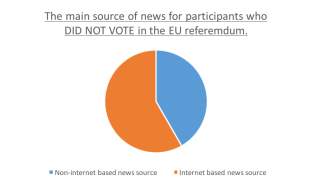
| Participants who did not vote; | |
| Non-internet based news source | Internet based news source |
| 41.67% | 58.33% |
It is astonishing to see the almost mirrored results of this set of data. The two pie charts are almost opposites of each other, with the majority of those who preferred a non-internet based news source choosing to vote (56.67%) and the majority of those who preferred an internet based news source choosing not to vote (58.33%). This result strongly supports one of the hypotheses of the primary research – the greater the participant’s use of the internet, the less likely they are to vote.
One explanation for this could be linked to the bystander effect – a socio-psychological phenomenon where people tend to take no action in a situation when other people are present (Cherry 2017: online). This links to the use of social media and the way Facebook make use of algorithms. When users like, share and click on content, Facebook then generates more of the same or similar content. This means that the majority of users will only see posts that sit alongside their existing opinions, and little of what they disagree with. This can lead the user into believing that everybody else holds the same opinion as they do. In situations such as a referendum, they may believe that because everybody else feels the same way – or so it seems – they do not need to worry about voting. Perhaps, if Facebook did not create such a tunnel vision for its users they may be more aware of conflicting opinions and feel that their vote matters.
Summary of findings
- Participants aged between 32 and 38 years access social media, on average, more times per day than participants in any other age group between 18 and 70 years. This disproves the first hypothesis of the research.
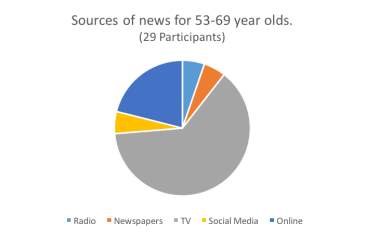
- Social media is the main source of news for the majority of participants aged between 18 and 31 years as well for those aged between 39 and 45 years.
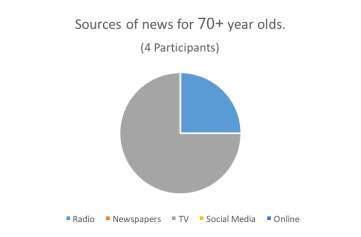
For 32 to 38 year olds and for 46 to 52 year olds, the most favoured source of news is online news agencies. For all other participants, those aged 53 years and above, the main source of news is the television.
This supports the second hypothesis in some ways, although the number of participants who list social media as their main source of news does not decrease steadily as age increases. Instead, it diminishes completely for 32 to 38 year olds before increasing drastically again for 39 to 45 year olds. From then on, it decreases as predicted.
- The more times per day a participant accesses social media, the less likely they are to buy a newspaper.
This proves the 4th hypothesis.
- The majority of participants who voted in the EU referendum favoured a non-internet based news source, whilst those who did not vote preferred an internet based news source.
This supports the 5th hypothesis.
Conclusion and evaluation
The findings in this dissertation, drawn from both primary and secondary research, show that the news industry is changing and has been doing so for some time. By looking at the statistics presented in chapter 3, we are able to see how the use of television and newspapers is decreasing whilst the use of the internet continues to rise. The figures shown in chapter 3 are drawn from large scale studies and as such, are able to represent the population as a whole. In order to break this down into age groups and therefore provide further insight, primary research was conducted. The primary research allows us to understand the news sourcing habits and preferences of a sample of today’s public. Through the strategic design of the questionnaire, these habits were able to be compared with other factors such as age, social media activity and tendencies to buy newspapers. All of which provides further insight than studying the secondary research findings alone.
When looking at the findings from both the primary and secondary research, it is apparent that the existing legislations, discussed in chapter 4 may not be applicable to the preferred sources of news of many of today’s public. This in itself can bring about a number of problems from online safety through to the accuracy of information being shared.
This dissertation may serve as proof that more needs to be done to keep legislations and guidelines up to date and make sure that the news industry moves and changes to suit the new demands of its readers and listeners.
The primary research conducted could be used as a starting point for a much larger scale investigation. Currently, the findings can only be applied to a relatively small pool of the public. This is due to its limited number of participants as well as the compromised location of the study. If data were to be gathered from a larger number of participants and also from various places in the UK, the findings could be applied to a wider range and therefore provide greater application of the results.
The research may prove useful to governing bodies, allowing them to see who is reading and listening to what, where, when and how often. This could assist with the creation and implementation of much more relevant and up to date guidelines for the news industry. By doing this, it could be hoped that the public have a greater chance of accessing more reliable and well-rounded information and could therefore gain a more accurate understanding of current affairs and the world around us.
As the researcher, a greater understanding and awareness has been gained of the workings of social media, television and the news industry as a whole. This encourages more critical thinking when reading a headline online or a post on social media. From now on, not everything will be taken as the solid truth and instead, further reading will be conducted before forming an opinion on a topic or making a decision based on what has been read online.
The internet and social media has served in many ways as a huge step forward for humankind, allowing us to keep in contact with friends and family who may be hundreds of miles away. As mentioned in the introduction to this work, communication is our greatest tool and the rise of the internet has assisted with the expansion of this. We must however, learn from and take warnings from the research presented here and make sure that the internet is used in a responsible and trustworthy way. When used correctly, social media can be an excellent way of continuing our need to share stories and the internet as a whole can provide us with endless opportunities to do so.
Bibliography
Intro:
Barnard, J (2015) Tweets as microfiction: on Twitter’s live nature and 140-character limit as tools for developing storytelling skills, London
Harari, YN (2014) Sapiens: A Brief History of Humankind, New York
Fuller, S (2017) https://www.statista.com/topics/1747/advertising-in-the-united-kingdom/ Date Accessed 19th December 2017
Robehmed, N (2016) https://www.forbes.com/sites/natalierobehmed/2016/11/16/top-earning-reality-stars-2016-kardashians-jenners-combine-for-122-5-million/#a01171b274d1 Date Accessed 20th December 2017
BBC:
Diggs-Brown, B (2011) Strategic Public Relations: An Audience-focused approach, Belmont
Unknown (2018) http://www.barb.co.uk/resources/tv-ownership/ Date Accessed 9th January 2018
Crisell, A (2002) An Introductory History of British Broadcasting, London
Bergen, M (2015) https://www.recode.net/2015/9/17/11618666/ad-blockers-take-first-and-fourth-spots-on-app-store-in-debut-day Date Accessed 18th December 2017
Reith: (voice)
Archive on 4
http://www.bbc.co.uk/programmes/b01nsyxq
“Lord Reith”. Archive on 4. 10 November 2012. BBC Radio 4. Retrieved 18 January 2014
http://www.bbc.co.uk/programmes/b01nsyxq 00:20 – 00:30
Misinformation:
Gibson, O (2004) https://www.theguardian.com/media/2004/jul/07/pressandpublishing.football1 Date Accessed 2nd January 2018
Unkown (2017) https://stopfundinghate.org.uk/about-the-campaign/ Date Accessed 2nd January 2018
Primary methodology:
Orne, M.T (2009) Artifacts in Behavioural Research: Robert Rosenthal and Ralph L. Rosnow’s Classic Books, Oxford
Primary Findings
Cherry, K (2017) https://www.verywell.com/the-bystander-effect-2795899 Date Accessed 2nd January 2018
List of illustrations
Fig.1. Unknown, (unknown), Cave paintings found on the Indonesian island of Timor-Leste, [Photograph] Available from https://www.heritagedaily.com/2017/12/2500-year-old-cave-paintings-discovered-indonesian-island/11785, Last Accessed 18th December 2017
Fig. 2. Unknown, (April 2017), Advertising expenditure in the United Kingdom from 2010 to 2018 (in billion GBP), [Graphic] Available from https://www.statista.com/statistics/262754/advertising-revenue-in-the-uk/, Last Accessed 2nd January 2018
Fig. 3. Unknown, (12th December 2017), RPI: Weights (Parts per 1000) – Television licences and rentals, [Graphic] Available from https://www.ons.gov.uk/economy/inflationandpriceindices/timeseries/czys/mm23, Last Accessed 2nd January 2018
Fig. 4. Wright, S, (29th December 2017), Placement of questionnaires at Bean Loved coffee bar, [Photograph] Available on request from S. Wright
Fig. 5. York, C, (April 2016), The Sun front page from 19 April 1989, [Photograph] Available from http://www.huffingtonpost.co.uk/entry/hillsborough-inquest-verdict-the-sun-kelvin-mackenzie_uk_571f4311e4b06bf544e0a7fa Last Accessed 2nd January 2018
Fig. 6. Nardelli, A, (13th April 2017), Daily Mail front cover, [Web Image] Available from https://www.buzzfeed.com/albertonardelli/this-is-how-germany-fought-back-against-far-right-populism?utm_term=.miKEB0EJL#.nn3Q9kQwy Last Accessed 4th January 2018
Appendix
To see all online results for the questionnaire undertaken as part of the primary research, please use the following link;
https://www.surveymonkey.com/results/SM-9HNTP3JM8/
Cite This Work
To export a reference to this article please select a referencing stye below:
Related Services
View all


Related Content
All TagsContent relating to: "Internet"
The Internet is a worldwide network that connects computers from around the world. Anybody with an Internet connection can interact and communicate with others from across the globe.
Related Articles

DMCA / Removal Request
If you are the original writer of this dissertation and no longer wish to have your work published on the UKDiss.com website then please: