Radon Exposure: Causes, Effects and Management
Info: 9894 words (40 pages) Dissertation
Published: 9th Dec 2019
Tagged: Health and Social CareMedicine
Chapter Two
2.0 Literature review
2.1 Background
Every person, animal and object present on our planet earth are subjected to radiation and may indeed contain it. We cannot see it, smell it or feel it, but it is with us all the times. Natural radioactivity on earth has been in existence ever since the planet was formed and there are about 60 radionuclides present in nature. About 82% of the environmental radiation is from natural sources, the largest of which is radon. Some areas of the world, called high background radiation areas (HBRAs), have anomalously high levels of background radiations. Extreme HBRAs are found in Guarapari (Brazil), southwest France, Ramsar (Iran), parts of China and the Kerala coast of India (Dissanayake, 2005).
2.2 Definition, Properties, Sources and Movement of Radon gas
Radon is an inert element in the gaseous form, with atomic number of 86. It is colorless, odorless, tasteless and radioactive gas formed from the normal radioactive decay of uranium (Fig 2.1). Uranium is present in small amounts in most rocks and soil. The concentration of radon in the air is measured in units of picocuries per liter (pCi/L) or Becquerel’s per cubic meter (Bq/m3). One Bq is corresponds to one decay per second. One pCi/L is equivalent to 37 Bq/m3. The concentration of radon daughters is measured in units of working level (WL) which is a measure of the potential alpha particles energy per liter of air (Niren, 1994). Measurement data are reported in either of the above units.
It is non- reactive towards chemical agents. It is the heaviest member of the rare gas group (~100 times heavier than hydrogen and ~7.5 times heavier than air). When cooled below its freezing point, radon exhibits brilliant phosphorescence that becomes yellow at lower temperatures and orange-red at the temperature of the liquid air (CRC, 2001). Being a noble gas, it has greater ability to migrate freely through soil, air, etc. (Matiullah et al,1993).
When radon decays, it divides into two parts (Papastefanou, 2008); one part is called radiation, and the second part is called a daughter. The daughter, like radon, is not stable also undergoes radioactive decay. Unlike radon, the daughters are metal and easily attach to dust and other particles in the air. The decay of daughters continuous until a stable, non-radioactive daughter is formed. The decay chain of radon involves the release of five energetic particles which are; three alpha particles (with energies of 5.49, 6.0 and 7.69 million electron volts) (MeV) and two beta particles with endpoints ranging from (0.69 to 3.26 MeV) (Hasan, 1996). Alpha particles are solids and can travel only a short distance. It cannot go through our skin but it can be breathed and deposited in the lung tissue. The energy deposition in lungs is extremely localized and may increase the risk of lung cancer (UNSCEAR, 2000).
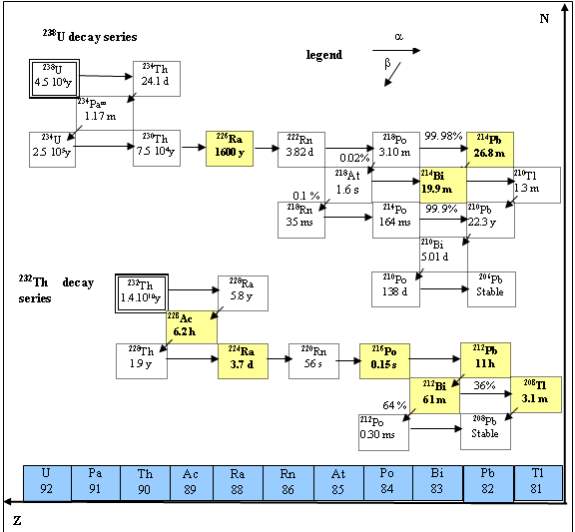
Fig. 2.0 Uranium Decay series
For humans, the greatest importance among radon isotopes is attributed to 222Rn because it is the longest lived of the three naturally produced isotopes (Durrani and Illic1999). It is well-known that airborne short-lived radon and thoron progeny inhalation has a large contribution towards the radiation exposure of the public (NRC, 1999; ICRP, 1994; UNSCEAR, 2000) as shown in fig 2.1
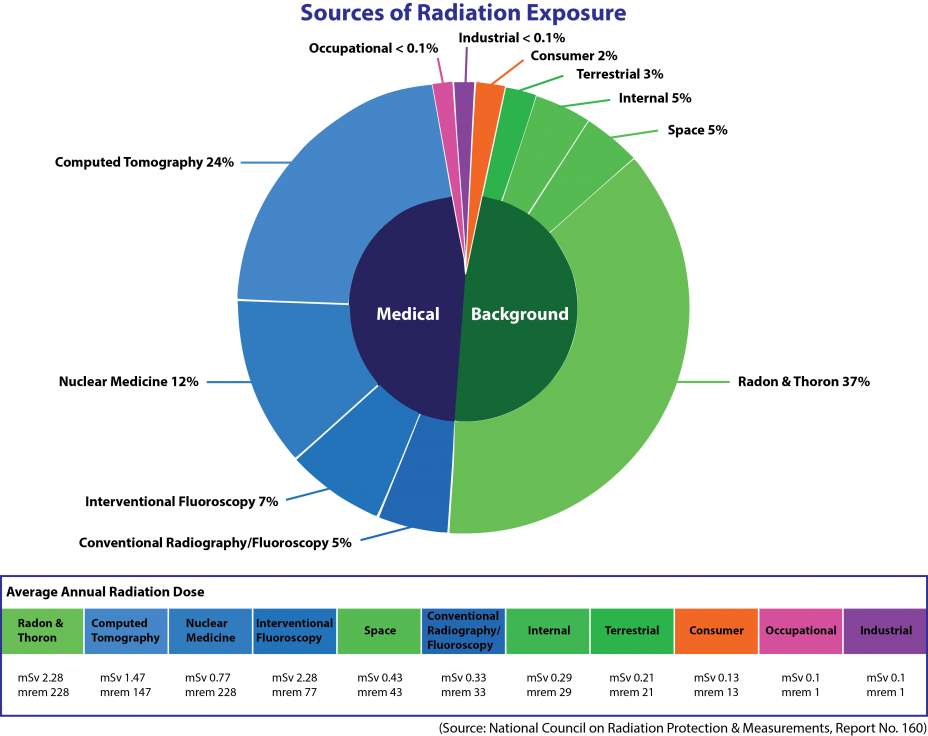 Fig 2.1: Sources of Radiation Exposure
The rate of radon seepage is variable, partly because the amounts of uranium in the soil vary considerably (BEIR VI, 1999). Radon flows from the soil into the outdoor air, ground waters and also into the air in homes from the movement of gases in the soil beneath homes.
Generally sources of radon in dwellings are, radon exhaled from the building materials and the soil/rocks below the building and inflow of radon containing air (Aldenkamp et al., 1992). According to UNSCEAR, indoor radon sources may be classified in the following order as soil beneath the building, building materials, outdoor air, portable water supplies and natural gas (UNSCEAR, 2000) as shown in fig 2.2
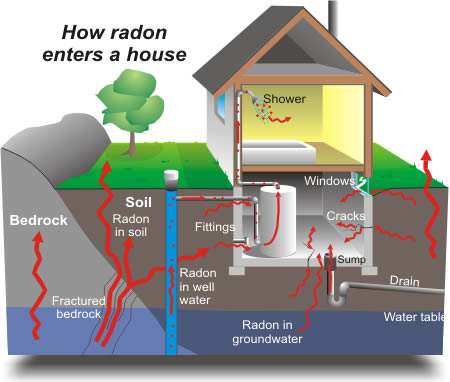
Fig. 2.2 A picture showing how radon enters home: WHO (2009)
Because radon is a gas, it has much greater mobility than uranium and radium, which are fixed in the solid matter in rocks and soils. Radon can more easily leave the rocks and soils by escaping into fractures and openings in rocks and into the pore spaces between grains of soil. The ease and efficiency with which radon moves in the pore space or fracture effects how much radon enters a house. If radon is able to move easily in the pore space, then it can travel a great distance before it decays, and it is more likely to collect in high concentrations inside a building.
The method and speed of radon’s movement through soils is controlled by the amount of water present in the pore space (the soil moisture content), the percentage of pore space in the soil (the porosity), and the “interconnectedness” of the pore spaces that determines the soil’s ability to transmit water and air (called soil permeability).
Radon moves more rapidly through permeable soils, such as coarse sand and gravel, than through impermeable soils, such as clays. Fractures in any soil or rock allow radon to move more quickly.
Radon in water moves slower than radon in air. The distance that radon moves before most of it decays is less than 0.025metres in water-saturated rocks or soils, but it can be more than 1.8metres, and sometimes tens of metres, through dry rocks or soils. Because water also tends to flow much more slowly through soil pores and rock fractures than air, radon travels shorter distances in wet soils than in dry soils before it decays.
2.3 Radiation Hazards
Radiation effects comprise of (1) deterministic effects that occur with certainty after doses high enough to cause major cell killing and (2) stochastic effects that are considered to occur more or less in proportion to the dose at all dose levels. The table 2.0 shows average dose received due to different radiation sources (Bølviken, 2001).
Table 2.0: Average annual effective dose per caput.
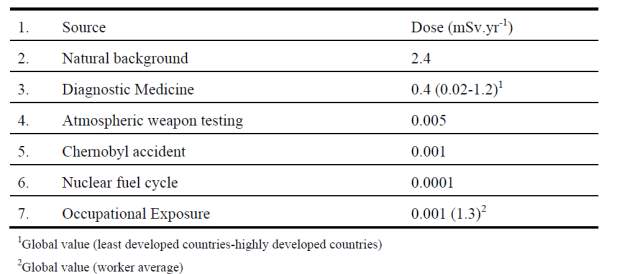
Out of 98% of the average radiation dose received by human beings is from natural sources, about 52% is due to the inhalation of radon, thoron and their progenies present in the dwellings (UNSCEAR, 1988).
2.4 Radon and its health risk
In many countries exposure to indoor radon gas represents the largest proportion of the radiation dose received by the general public (UNSCEAR, 2000). There is direct evidence from human studies of a link between exposure to radon and lung cancer (IARC,1988). For this reason radon has been classified by the International Agency for Research on Cancer, a part of the WHO, as a Group 1 carcinogen. Apart from lung cancer, there is no epidemiological proof of radon causing any other type of cancer (Appleton, 2007). So, living in an elevated level of radon concentration for a long period of time means that the probability of inducing lung cancer increases (Abumurad and Al-Omari, 2008, Nsiah-Akoto et al., 2012).The proportion of all lung cancers linked to radon is estimated to lie between 3% and 14%, depending on the average radon concentration in the country and on the method of calculation (ICRP, 2010;WHO, 2009; USEPA, 1993).
The report of the International Commission on Radiological Protection (ICRP) publication 115 used the lifetime excess absolute risk (LEAR) to estimate the lifetime risk, which is associated to a chronic exposure scenario, expressed in number of death 10-4 per working level per month (WLM) (ICRP, 2010).
2.5 Risk Assessment
Risk assessment is presented as a way of examining risks that they may be better avoided, reduced, or otherwise managed. Risks implies uncertainty, so that risk assessment is largely concerned with uncertainty and hence with a concept probability that is hard to grasp. Risk assessment has been defined by the National Research Council (NRC) of USA as “the characterization of the potential adverse health effects of human exposures to environmental hazards” (NRC 1983). An assessment of all types of hazards, including radiological hazards, requires all or some of the following components:
- Hazard identification which is investigated to determine whether a particular hazard has a corresponding health effect.
- Dose-response assessment, in which the relation between the magnitude of the dose and the probability that the health effect will occur is determined.
- Exposure or dose assessment, which is the determination of the extent to which human will be exposed to the hazard.
- Risk characteristic, which describes the nature and magnitude including uncertainties surrounding that risk (NRC, 1983). It is the last component of risk characterisation that integrates the results of the previous three components into a risk model that includes one or more quantities estimates
2.5.1 Factors that Influence the Risk of Lung Cancer from Radon Exposure:
- Age
- Duration of exposure
- Time since initiation of exposure
- Cigarette smoking
- Other carcinogenic exposures
- Gender
- Physical condition
- Genetic tendency either to resist or be affected by internal radiation exposure
- Geographic location
Certain characteristics of the residence and environmental factors will play a role in determining the indoor radon concentrations. The highest radon levels are typically found in the lowest level of the house. If well water is the major source of radon, upper floors can be affected more than lower floors because of dissolution of radon from the water. Radon levels are elevated in colder climates (Rainy Season) rather than in more mild temperatures (Dry Season).
2.5.2 Annual effective dose
2.5.2.1 Radon Dose from Epidemiological Assessments (Derivation of the Indoor Radon Effective Dose Rates)
Radon doses given in ICRP publications belong to this category. The ICRP has not provided values of the doses per unit intake for radon and its decay products from application of the respiratory tract model. Because lung cancer has been observed and studied extensively in miners exposed to radon-222, the ICRP has adopted a conversion convention for radon exposures that is based on equality of detriments from epidemiological determinations. As stated in ICRP Publication 65, a conversion from radon exposure to effective dose was obtained by a direct comparison of the detriment associated with a unit effective dose and a unit radon exposure.
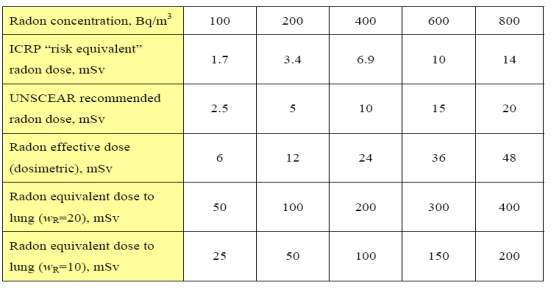
The detriment per unit effective dose is 7.3 × 10⁻⁵ per mSv for the general public based mainly on studies of A-bomb survivors (ICRP, 1993). The detriment per unit exposure to radon progeny is 8.0 × 10⁻⁵ per mJ h m-3 (1 mJ h m-3 = 0.282 WLM, where WLM is the exposure unit of Working Level Month commonly used in workplaces) (ICRP, 1993). In terms of detriment, an exposure to radon progeny of 1 mJ h m-3 is equivalent to an effective dose of 1.10 mSv for members of the public (8.0 × 10⁻⁵/7.3 × 10-5 = 1.10). The ICRP conversion from radon exposure to effective dose has nothing to do with any dosimetric parameters and does not rely on tissue or radiation weighting factors. This is not a dose in the sense of dosimetry. It is solely based on equality of detriments resulting from two totally different exposure scenarios. Assuming 7000 hours per year indoor (an occupancy factor of 80%) and an equilibrium factor of 0.4, then 1 Bq/m3 is equivalent to 1.56 × 10⁻² mJ h m-3. Based on the ICRP radon dose conversion, exposure to radon at 100 Bq/m3 will be equivalent to an annual effective dose of 1.72 mSv.
Thus if, 1mJhm-3 = 1.10mSv, Then 1.56 x 10⁻²mJhm-3 = 1.72 mSv
Direct measurements of the concentrations of all short-lived decay products of radon are difficult and limited. They are estimated from considerations of equilibrium (or disequilibrium) between radon and its decay products. An equilibrium factor F is defined as that permits the exposure to be estimated from the measurement of the radon gas concentration. The equilibrium equivalent radon concentration is directly proportional to the Potential Alpha Energy Concentration (PAEC) in the following manner:
1 Bq/m³ (EEC) = 5.56X 10⁻⁶ mJ/m³ (PAEC) = 0.27 mWL (Working Level)
The equilibrium factor (F) is defined as the ratio of the Equilibrium Equivalent radon Concentration (CEEC) to the radon concentration (CRn).
F=CEECCRn 2.5
With CEEC = 0.105 C218Po + 0.515 C214Pb + 0.380 C214Bi 2.6
Where C218Po, C214Pb and C214Bi are the concentrations of the short-lived decay products in air.
In order to estimate the annual effective doses indoors, one has to take into account the conversion coefficient from absorbed dose in air to effective dose and the indoor occupancy factor. In the UNSCEAR 2000 Report, a value of 9.0 x 10⁻⁶ mSvh-1 per Bq m3 was used for the conversion factor (effective dose received by adults per unit Rn-222 activity per unit of air volume), 0.4 for the equilibrium factor of 222Rn indoors and 0.8 for the indoor occupancy factor. Hence, the effective dose rate indoors in units of mSv y-1, HE, is calculated by the following formula:
HE (mSv y-1) = CRnF. T. D 2.7
Where CRn is the measured Rn-222 concentration (in Bq m-3), F is the Rn-222 equilibrium factor indoors (0.4), T is the indoor occupancy time (0.8 × 24 h ×365 = 7008 h y-1), and D is the dose conversion factor (9.0×10⁻⁶ mSv h-1 per Bq m-3).
2.16.1.2 Radon Dose from Physical Dosimetry
The United Nations Scientific Committee for the Effects of Atomic Radiation—UNSCEAR assessments on sources and effects of ionizing radiation are used as a basis for radiation protection programs and research in the scope of nuclear and radioactivity issues by international organizations, national regulatory bodies, and research institutions (UNSCEAR, 2000).
Many publications have dealt with radon dose to the lung determined from physical dosimetry (Harley and Pastermack, 1972; Harley et al.,1996; Porstendoefer, 2001; Marsh and Birchall, 2000; Marsh et al., 2001). There are absorbed dose, equivalent dose and effective dose. Literature values of absorbed doses to the lung vary from 5 to 71nGy per (Bqhm-3) (UNSCEAR, 2000). The central value is estimated to be 9nGy (Bqhm-3) which represents the effective dose received by adults per unit Rn-222 activity per unit air volume. At a certain radon concentration CRn in Bqm-3, the annual radon (absorbed) dose, DRn is usually expressed in the unit of mSv from the following relation.
DRn (mSv/y-1)= CRn.D.H.F.T 2.8
Where D is the conversion factor used to assess radon dose for unit radon exposure. That is because of the physical difference between the radon concentration and radon dose. Also, two more factors; an occupancy factor, H, of 80% (home), and equilibrium factor, F, of 0.4 as used in ICRP publications. Finally T is hours in a year = 8760 h/y. Now to calculate the annual equivalent dose and effective dose, one has to apply a tissue and radiation weighting factors according to ICRP, 1991. The equivalent dose is the radiation- weighted absorbed dose. The radiation weighting factor for alpha particles is 20 as recommended by ICRP, 1991. With the effective dose, a tissue weighting factor is applied. According to ICRP, the tissue weighting factor for lung is 0.12. With these two weighting factors, the radon (absorbed) dose of 2.5mSv to the lung for one year exposure at 100 Bqm-3 becomes an annual effective dose of 6mSv.
In terms of effective dose, for one year of radon exposure at 100Bqm-3, the estimate from dosimetric approach is 6mSv, while the estimate from an epidemiological approach is 1.7mSv. The dosimetric estimate is thus 3.5 times higher than the epidemiological estimate.
It is, however, apparent that the time spent by individuals in the home varies widely. The occupancy factor of 0.8 over estimates the excess lung cancer risk in the temperate regions but may be valid for the inhabitants of the climate zone. In the temperate regions, people spend most of their time in open air and only go indoors to sleep at night. In this present study, the occupancy factor that will be used for the annual radon dose calculation will be 40% (0.4) for dry season and 0.8 for rainy season.
Table 2.23: Summary of estimated radon doses at different radon concentrations, assuming 7000 hours per year indoor (an occupancy factor of 80%) and an equilibrium factor of 0.4.
2.16.1.3 Annual Dose Equivalent to the Lung due to Inhalation of Radon Gas
The inhaled radon is constantly present in the air volume of the lungs at the air concentration and is partly dissolved in the soft tissues. Taking the solubility factor for soft tissues 0.4, a quality factor of 20 for α radiation, and assuming that the short lived daughter atoms produced decay in the same tissue as radon gas, the annual dose equivalent in soft tissues other than the lung is given by:
H soft tissues (Sv) = 0.9 X 10⁻¹⁰ χRn,air (Bqm-3) (2.9)
Where χRn,air is the concentration of radon in the air where the inhalation occurs. In the case of the lungs the radon content of the lung and air has also to be taken into account, resulting in:
H lung(Sv) = 8 X 10⁻¹⁰ χRn,air (Bqm-3) (2.10)
Applying the weighting factor of 0.12 for the lungs and of 0.88 for the other tissues, the annual effective dose equivalent rate is given by
HE(Sv) = 1.77 X 10⁻¹⁰ χRn,air (Bqm-3) (2.11)
2.6 Radon Measurements and Mapping of Levels in Ghana
Measurement of radon in Ghana gained momentum in the early 90’s and a number of articles are reported in international and local research journals. Radon risk maps can be based on indoor radon gas measurements or alternatively radon risk maps can be based on geological information such as the uranium content of the underlying geology or soil gas radon concentrations. Radon maps developed earlier for the country are all based on soil gas measurements. (Theophilus, 2013, Badoe et al, 2012, Osei et al. 2016). When mapping based on geological information is considered, as a preliminary step it is necessary to consult existing geological maps (for example bedrock or quaternary geology maps) to determine the appropriate areas to be sampled. The parameter of interest, for example, soil gas radon, uranium and/or radium content of soil, or soil gas permeability within each sampling area is then measured. Concerns have been expressed that maps based on geology are not reliable indicators of radon concentrations in dwellings due to the many non-geological factors that influence the entry and retention of radon in dwellings (Synnot and Fenton, 2005). The International Commission on Radiological Protection (ICRP) states that mapping radon prone areas using indoor radon measurements is likely to be more accurate than using geological information (ICRP, 1994). The radon map for the studied areas will be based on statistically designed available indoor radon measurements.
Osei, 2016, in his Mphil thesis collated most of the available national data to date. Below is the available national radon data collated for 2 decades on soil air, water and indoor.
In most of the works the SSNTD was used and counted with the spark counter or the microscope. In this present work SSNTD will be utilized for measurements as well as the RAD 7 Radon electronic monitor for radon in water. This is the first time the RAD7 is been used in Ghana for such work and a new methodology for track counting will also be used in this work.
2.6.1 Radon in Water
Radon can also enter home through water systems. Water in rivers and reservoirs usually contains very little radon, because it escapes into the air; so homes that rely on surface water usually do not have a radon problem from their water. In big cities, water processing in large municipal systems aerates the water, which allows radon to escape, and also delays the use of water until most of the remaining radon has decayed.
Groundwater is increasingly becoming the source of drinking water for inhabitants of both rural and urban settlements due to intermittent water shortage which has been hitting most parts of cities. (Nyarko, 2008). It has been estimated that lack of clean drinking water and sanitation services leads to water-related diseases globally and between five to ten million deaths occur annually, primarily of small children (Snyder and Merson, 1982). Population growth and urbanization have put a lot of pressure on water resources in the world. Both surface and ground water resources are in high demand in order to meet the needs of the ever-growing population. This has resulted in public water provision being woefully inadequate. Individuals have therefore resorted to various means of gaining access to and managing their own water supply such as drilling of boreholes.(Nyarko, 2008).
These boreholes often have closed systems and short transit times that do not remove radon from the water or permit it to decay. This radon escapes from the water to the indoor air as use the water. A very rough rule of thumb for estimating the contribution of radon in domestic water to indoor air radon is that house water with 37,000 Bq/L of radon contributes about 37Bq/L to the level of radon in the indoor air.
The presence of radon in groundwater is predominantly due to the decay of radium (226Ra) found in rock and soils and does not mainly originate from the radium dissolved in water. Radon can also be generated within water distribution systems with high radium concentrations from radium adsorbed iron pipe scales (Field et al. 1995, Fisher et al. 1998a). Radon exposure from waterborne radon sources may occur either from ingestion or from inhalation of radon released from water. The cancer risk resulting from the release of waterborne radon (showering, dish washing, etc.) is generally considered much greater than the risk from drinking water containing radon (NRC 1998). There is also evidence from epidemiology and modeling studies that ingestion of radon can cause stomach cancer (NRC, 1999).
The four main sources of water in the Offinso municipality are borehole, river stream, public tap and pipe borne water. Majority of households (43.0%) drink water from pipe borne. and that of Obuasi municipality are borehole, protected well, public tap and pipe borne water. About half of households (53.3%) drink water from boreholes.(GSS,2014)
Several well-established methods exist for the collection (Field and Kross 1996) and measurement (Vitz 1991) of radon in water. Techniques for measuring radon in water include direct gamma counting (Galli et al. 1999), electret ion chambers (Kotrappa and Jester 1993), and gas transfer by membranes (Surbeck 1996, Freyer et al. 2003). Liquid scintillation counting and the de-emanation radon measurement techniques are the most prevalent methods for measuring radon concentrations in water (Prichard et al. 1991, Prichard and Gesell 1977, Lucas 1957, 1964)
Although the radiation risk from radon exposure through ingestion of drinking-water is much smaller of that caused by indoor inhalation of radon, many international organizations introduced some regulations concerning permissible concentrations of this radionuclide in drinking water. The United States Environmental Protection Agency (EPA) proposed in 1991 a maximum contamination level (MCL) for radon of 11 Bq/l in drinking water (USEPA, 1991). However, from practical reasons in 1999 EPA recommends also another alternative maximum contamination level (AMCL) of 148 Bq/l considering the contribution to radon concentration in indoor air from household usage of water (USEPA,2002). The World Health Organization (WHO) guidelines for drinking water quality suggest that repeated measurements should be implemented if radon activity concentration in public drinking water supplies exceeds 100 Bq/l (WHO,2011). Similar approach has been proposed in the EU (European Union) commission recommendations: no remedial action should be required if the concentration of radon in drinking water is <100 Bq/l (EU,2001). Therefore, seven European countries (Denmark, Finland, Germany, Greece, Ireland, Sweden and the Czech Republic) have set their own reference levels in the range 20–1000 Bq/L for radon in drinking water (Synnot and Fenton,2005). Techniques for measuring radon in water include direct gamma counting (Galli et al. 1999), electret ion chambers (Kotrappa and Jester 1993), and gas transfer by membranes (Surbeck 1996, Freyer et al. 2003). Liquid scintillation counting and the de-emanation radon measurement techniques are the most prevalent methods for measuring radon concentrations in water (Prichard et al. 1991, Prichard and Gesell 1977, Lucas 1957, 1964). In this work RAD7 manufactured by Durridge, USA was used for radon in water measurement and will be discussed in detail in chapter 3. However, at present there is no reference level for radon in drinking water in Ghana.
2.6.2 Radon Concentration Indoors
2.6.2.1 Seasonal Variation of Indoor Radon Levels
Radon levels indoors are known to vary from house to house which in turn depends on the radon source, building characteristics, natural daily cycle, other longer temporal and spatial cycles, related to occupancy, geological and meteorological factors, dwelling characteristics and habits of the occupants (Arvela, 1995; Majborn, 1992; Groves-Kirkby et al., 2006). In countries with relatively higher contributions from building materials, the winter to summer ratios should be lower (Arvela, 1995). From the recent measurements, in the very same room the yearly average of radon concentration changed by 25–50%. Radon concentration varied throughout the year with the greatest concentrations occurring during the rainy months in homes. For radon concentration temporal variations, a 12-month total period of measurement is generally considered the best estimate of the average value. To determine the annual average from the indoor radon levels, measured for a less than a year, seasonal correction factor has to be applied (Grainger et al., 2000; Baysson et al., 2003; Karpinśka et al., 2005; Bochicchio, 2005).
In this work, measurement of seasonal concentration will be measured for the two municipalities which will help set a baseline data for seasonal variation. The areas understudy has two distinct seasons and a possible variation of indoor, water and soil air concentration were expected.
2.6.3 Radon Concentration in Soil
2.6.3.1 Radon Exhalation Rate
The release mechanism of radon from the grain to the indoor environment is governed by emanation and exhalation. The release of radon form mineral grain to the pore space is called emanation. Emanation is described by emanation coefficient which is the ratio of the radon produced in the grain of the materials to the radon in the pore space of the material. Its value is different for different materials and it depends on the grain size of the materials. Smaller the grain size will cause more emanation and vice versa. Emanation is governed by the law of conservation of momentum. The value of the emanation coefficient is of the order of 0.2–0.3 (Durrani and Ilic, 1997) for common constituents of building material (e.g., sand).
If the radium concentration, porosity and emanation for a type of soil or the material are known then maximum radon concentration ‘C’ that can occur in the pore space can be calculated by the following equation
2.0
Where ‘A’ is radium content, ‘e’ is emanation coefficient, ‘d’ is diffusion coefficient and ‘p’ is the porosity of the material.
The other mechanism which affect radon concentration is exhalation. The release of radon from pore space into the air is called exhalation. A measure of exhalation is given by the exhalation rate, which is defined as the number of radon atoms leaving the material per unit surface area per unit time. Radon exhalation rate is highly affected by the parameters like atmospheric pressure, temperature and wind force. The most important factor, controlling exhalation of radon from soil is geological structure of the top layer of the ground. Another important factor is rocks underlying the soil to the depth of about 10m because radon cannot migrate from deeper levels due to its relatively short half-life.
The measurement technique of radon exhalations using nuclear track detectors (NTDs) will be determined by using the Can technique (Alter and Price, 1972; Somogyi,1990, Abu-Jarad, 1980).
In order to calculate effective time of the radon exposure, the following relation is used
(Durrani and Iliç, 1997) :
2.1
Where τ is the mean life of radon (5.5 days), t is the total exposure time (days) and λ is the 222Rn decay constant. Measured radon concentration values were used to calculate the exhalation rate using the following equations (Rehman et al., 2006).
The radon exhalation rate (in terms of surface area) is calculated by using equation (Alter and Price, 1972, Somogyi, 1990, Khan et al 1992)
Where
A = Surface area of the sample (cm2), V = volume of the void space in a closed chamber,
t = 222Rn accumulation time in a closed chamber.
ω =ελ Z0 , known as back diffusion constant for given material.
Z0 = Thickness of the sample in the sealed chamber.
C(t) = 222Rn concentration just on the surface of the sample which has to be exhaled from the surface of the sample to the void space of the chamber.
F0 = RρbλEZ0 2.2
λ = 222Rn decay constant (h-1).
ρb= Bulk density of the sample (kg.m-3 ).
E = Sum of fractional emanation coefficient of 222Rn in air, water and adsorbed phase.
Eair + Ewater + Esolid 2.3
R = Concentration of 226Ra (Bq.kg-1)
In a closed chamber, which contains a sample, 222Rn concentration increases with the passage of time from zero to its maximum value. After reaching its maximum value, back diffusion of radon also take place, which reduces the 222Rn concentration by a factor ω in the chamber. Therefore exhalation rate F, corrected for back diffusion, was determined using Eq 2.4 . Exhalation rate was also calculated using the following equation (Abu-Jarad et al., 1980)
2.4
Where Ex is radon exhalation rate (mBq.m-2.h-1), C is mean radon concentration as measured by CR-39 detector (Bq.m-3), V is volume of the can (m3), t is the exposure time, λ is the radon decay constant and S is the surface area from which radon is exhaled into the closed can.
2.6.3.2 Radium Concentration in Soil
Uranium is present in all rocks and soils, so are radon and radium because they are daughter products formed by the radioactive decay of uranium. The location of the radium atom in the mineral grain (how close it is to the surface of the grain) and the direction of the recoil of the radon atom (whether it is toward the surface or the interior of the grain) determine whether or not the newly formed radon atom enters the pore space between mineral grains. If a radium atom is deep within a big grain, then regardless of the direction of recoil, it will not free the radon from the grain, and the radon atom will remain embedded in the mineral. Even when a radium atom is near the surface of a grain, the recoil will send the radon atom deeper into the mineral if the direction of recoil is toward the grain’s core. However, the recoil of some radon atoms near the surface of a grain is directed toward the grain’s surface. When this happens, the newly formed radon leaves the mineral and enters the pore space between the grains or the fractures in the rocks.
The concentration of 226 Ra, using models by (Singh et al, 2005, Prasad et al, 2008):
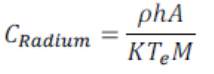 2.5
2.5
where C Radium is the effective radium content of soil sample (Bq kg−1), M is the mass of soil sample (250g), A is the area of cross-section of bottle (6.079 x 10⁻²m2), h is the distance between the detector and the top of the soil sample (0.005 m), K is the sensitivity factor, which is equal to 0.0245 tracks cm−2 d−1 per Bq m−3 (Azam et al., 1995), Te is the effective exposure time
2.5.3.2 Review of Radon Measurement Techniques in Soil
Radon measurements in soil has been performed in many parts of the world, using different techniques. This section is focusing on radon measurements in soil gas. Soil-gas radon concentration can be measured in-situ (passive or active) or ex-situ (passive or active). A measurement can be passive when the radon concentration is measured under natural conditions, with radon entering the detection volume by diffusion; or active, involving a pumping of the gas into a detector. In the case of the direct measurement of the radiation, the detector sensor is usually placed inside a container that has an opening to let radon enter it. The container is meant to protect the detector and to make room around the detector for a sensitive volume large enough so as to have as many alpha particles produced and detected in as short time as possible. Since alpha particles from radon and its progeny have a range of the order of 5 cm in the air, it is indeed easily understood that a free space of this order in front of the detector will ensure maximum efficiency.
Abumurad et al. (2001) performed radon measurements in the north and western part of Jordan using SSNTDs. The CR-39 film was mounted inside the bottom of cylindrical cups and planted at different depths (20, 40, 60, 80, 100 cm).
Kullab (2005) conducted radon experiments in Al-Ruseifa and Amman, Jordan using
SSNTDs. Measurements were performed seasonally (summer, winter, spring and autumn) at a depth of 50cm. Radon concentrations in Jordan (Amman and Al-Ruseifa) were low in winter compared to other seasons.
Speelman et al. (2005) measured radon concentrations in gold mine tailings soil in
Gauteng, South Africa with RAD7 detector at depths of 25, 50, 75, 100 and 120 cm.
The soil gas radon concentration was measured with SSNTDs at a depth of 70 cm in Tomsk (Russia) (Iakovleva, 2003).
The Can technique proposed by Alter and Price (1972) later developed by Somogyi (1990) and adapted by several researchers (Henshaw et al., 1972, Samuelsson and Pettersson, 1984, Andam 1992, Abu-Jarad, 1998, Ramola and Choubey, 2003, Prasad et al. 2008) has been used widely where soil samples of various types are collected and dried. Soil samples are transferred into a can where pieces of SSNTDs film are attached inside the can’s lid and the can was closed for radon measurements. In Ghana, most of the radon in soil measurements are done in-situ but this work was done ex-situ (can technique) to know the effectiveness of this measurement technique so as to employ in our national radon measurements.
2.5.1 Review of Radon works in Ghana
Radon works over the past two decades has been collated and documented for the purpose of a national radon database. Table 2.1-2.7 is a compilation of some documented radon works in Ghana. (Osei, 2016) and the methods used in analysis and updated in the present study.
2.6 National Radon Data
2.6.1 Ashanti Region
Table 2.1 Soil radon concentration in Ashanti Region
| Year | Name of researcher(s) | Location | Method | Conc. (Bqm-3) |
| Abonu | RDU-200, RDA‑200 | 5571.80 | ||
| Susuano | RDU-200, RDA‑200 | 18846.30 | ||
| Adwafo | RDU-200, RDA‑200 | 3276.50 | ||
| Kusuasi | RDU-200, RDA‑200 | 4549.00 | ||
| Tepaso | RDU-200, RDA‑200 | 6206.70 | ||
| Konongo | 10740.00 | |||
| 1991 | A. A. B. Andam | Ashanti Goldfields, Obuasi | SSNTD | 21.00 |
| 1991 | A. A. B. Andam | Obuasi | SSNTD | 921.00 |
| 1991 | A. A. B. Andam | Kumasi | SSNTD | 971.30 |
| 1991 | A. A. B. Andam | Ayeduasi | SSNTD | 14.10 |
| 2017
2017 |
Irene Nsiah-Akoto
Irene Nsiah-Akoto |
Obuasi
Dry Rainy Offinso Dry Rainy |
SSNTD
SSNTD |
5997.38
3256.81 3776.89 3176.26 |
Table 2.2 Indoor radon concentrations in Ashanti region
| Year | Name of researcher(s) | Location | Method | Conc. (Bqm-3) |
| 1991 | A. A. B. Andam | Ayeduasi | SSNTD | 137.00 |
| 1991 | A. A. B. Andam | Obuasi | SSNTD | 114.00 |
| 1991
2017 2017 |
A. A. B. Andam
Irene Nsiah-Akoto Irene Nsiah-Akoto |
Kumasi
Obuasi Dry Rainy Offinso Dry Rainy |
SSNTD
SSNTD SSNTD |
92.00
47.89 137.46 60.64 88.76 |
Table 2.3 Water radon concentration in Ashanti Region
| Year | Name of researcher(s) | Location | Method | Conc. (Bq/l) |
| 2017 | Irene Nsiah-Akoto | Obuasi | RAD7
SSNTD |
0.12
0.10 |
| 2017 | Irene Nsiah-Akoto | Offinso | RAD7
SSNTD |
0.10
0.09 |
2.6.2 Brong Ahafo Region
Table 2.3 Soil radon concentration in Brong Ahafo region
| Year | Name of researcher(s) | Location | Method | Conc. (Bqm-3) |
| 2007 | Frank Brobbey | Dormaa-Ahenkro | RDU-200 | 5671.7 |
| 2007 | Frank Brobbey | Sunyani | Rolle’s | 4049.6 |
| 2007 | Frank Brobbey | Wamfie | RD-200 | 3646.0 |
| 2007 | Frank Brobbey | Maasu | SSNTD | 3037.3 |
| Sunyani | 4375.3 | |||
| Tanoso | 4381.9 | |||
| Bechem | 4363.8 | |||
| Duayaw Nkwanta | 4361.2 | |||
| Average | 4235.9 | |||
| Maximum | 5671.7 | |||
| Minimum | 3037.3 | |||
2.6.3 Central Region
Table 2.4 Soil radon concentrations in Central region
| Year | Name of researcher(s) | Location | Method | Conc. (Bqm-3) |
| 1991 | A. A. B. Andam | Ankaful | SSNTD | 1226 |
| 1991 | A. A. B. Andam | Gomoa Mprumaim | SSNTD | 1050 |
| 1994 | Cape Coast | 1300 | ||
| Average | 1192 | |||
| Maximum | 1300 | |||
| Minimum | 1050 | |||
Table 2.5 Indoor radon concentration in Central region
| Year | Name of researcher(s) | Location | Method | Conc. (Bqm-3) |
| 1991 | Agyemang Oduro | Cape Coast | 276 |
2.6.4Eastern Region
Table 2.6 Indoor radon concentration in the Eastern region
| Year | Name of researcher(s) | Location | Method | Conc. (Bqm-3) |
| 2014 | Sandra Oduro | Aburi | SSNTD | 49.78 |
2.6.5 Greater Accra Region
Table 2.7 Soil radon concentrations in Greater Accra region
| Year | Name of researcher(s) | Location | Method | Conc. (Bqm-3) |
| 1989 | Oppong et al. | Dome | SSNTD | 91.8 |
| 1990 | Oppong et al. | Kwabenya | SSNTD | 9.4 |
| 1991 | A. A. B. Andam | Accra | SSNTD | 926 |
| 1991 | A. A. B. Andam | Afienya | SSNTD | 1110 |
| 1999 | Oppong et al. | Dunkonah | SSNTD | 27000 |
| 2008 | Amponsah et al. | Accra | SSNTD | 25920 |
| 2011 | Asumadu-Sakyi et al. | GAEC | SSNTD | 1720 |
| 2012 | Amoah et al. | GAEC | SSNTD | 37390 |
| 2012 | Amoah et al. | McCarthy Hill | SSNTD | 9050 |
| 2012 | Asumadu-Sakyi et al. | Dunkonah | SSNTD | 1620 |
| 2015 | Emmanuel A. Olukoya | Dome Kwabenya | 2550 | |
| 2016 | P. Osei | Accra Central | SSNTD | 1193 |
| Average | 9048.35 | |||
| Maximum | 37390 | |||
| Minimum | 9.4 | |||
Table 2.8 Indoor radon concentrations in Greater Accra region
| Year | Name of researcher(s) | Location | Method | Conc. (Bqm-3) | |
| 2012 | Ofosuhene Djan Felix | Ashongman estate | 169 | ||
| 2010
2010 2010 |
Nsiah-Akoto et al.
Eric Akortia et al Eric Akortia et al |
Dome
Sakumono Sakumono |
SSNTD
SSNTD Radon Scout plus |
466.9
10.18 10 |
|
| Average | 317.95 | ||||
| Maximum | 466.9 | ||||
| Minimum | 169 | ||||
Table 2.9 Water radon concentration in Greater Accra region
| Year | Name of researcher(s) | Location | Method | Conc. (Bqm-3) |
| 2016 | P. Osei | Accra Central | SSNTD | 0.16872 |
2.6.6 Northern Region
Table 2.10 Soil radon concentration in Northern region
| Year | Name of researcher(s) | Location | Method | Conc. (Bqm-3) |
| Tamale | 2711.89 |
2.6.7 Upper East Region
Table 2.11 Soil radon concentration in Upper East region
| Year | Name of researcher(s) | Location | Method | Conc. (Bqm-3) | ||
| 2009 | F. K. Quarshie et al. | Kasena Nankana | SSNTD | 132.7 | ||
Table 2.12 Indoor radon concentration in Upper East region
| Year | Name of researcher(s) | Location | Method | Conc. (Bqm-3) |
| 2011 | F. K. Quarshie et al. | Kassena Nankana | SSNTD | 130.03 |
Table 2.13 Water radon concentration in Upper East region
| Year | Name of researcher(s) | Location | Method | Conc. (Bqm-3) |
| 2012 | Asumadu Sakyi et al. | Kasena Nankana District | SSNTD | 723.7 |
2.6.8 Upper West Region
Table 2.14 Indoor radon concentrations in Upper West region
| Year | Name of researcher(s) | Location | Method | Conc. (Bqm-3) |
| 2014 | A. B. Youni | Jirapa | Model 1029 Continous Radon Monitor | 32.3 |
| 2014 | A. B. Youni | Sombo | Model 1029 Continous Radon Monitor | 39.2 |
| Average | 35.75 | |||
2.6.9 Volta Region
Table 2.15 Soil radon concentrations in Volta region
| Year | Name of researcher(s) | Location | Method | Conc. (Bqm-3) |
| 1994 | Oppong et al. | Biakpa | SSNTD | 80.4 |
| Oppong et al. | South eastern part of Ghana | SSNTD | 518.7 | |
| 2014 | Keta | 753.51 | ||
| 2015 | Charles Ansre | South-Dayi | SSNTD | 1760 |
| Average | 778.15 | |||
Table 2.16 Indoor radon concentration in Volta region
| Year | Name of researcher(s) | Location | Method | Conc. (Bqm-3) |
| 2015 | Charles Ansre | South-Dayi | SSNTD | 34.9 |
2.6.10 Western Region
Table 2.17 Soil radon concentrations in Western region
| Year | Name of researcher(s) | Location | Method | Conc. (Bqm-3) |
| 1993 | Oppong et al. | Prestea | SSNTD | 144.4 |
| 1994 | Oppong et al. | Prestea | SSNTD | 16200 |
| 1994 | Oppong et al. | Tarkwa | SSNTD | 4600 |
| Average
Minimum Maximum |
6981.47
144.4 16200 |
|||
2.7 International Guidelines for Indoors, Water, Radium concentration and Radon Exhalation in Soil.
A reference (action) level for radon represents the maximum accepted radon concentrations in a dwelling and is not a rigid boundary between safety and danger. It represents a level at which one should consider taking action to reduce the radon concentration. (Nsiah-Akoto et al, 2011). Indoor radon levels recommended action levels by European Union(EU) is between 500 and 1500 Bq m3 (Espinosa et al., 2009). The USA uses a reference level of 148 Bq m3 for dwellings and schools and a level of 400 Bq m3 for other workplaces (EPA, 1993). In the UK the Health and Safety Executive (HSE), has adopted a radon action level of 400 Bq m3 for workplaces. While the action level for workplaces in Hungary is 1000 Bq m3 (Espinosa G et al., 2009). Israel uses a mandatory reference level of 150 Bqm-3 for existing schools (Richter et al., 1997).
For radon in water, the United States Environmental Protection Agency (US-EPA) recommends a limit of 11 Bql-1(EPA, 1991). 100Bq/l is recommended by WHO (WHO, 2006) and European Union (EU, 2001) and UNSCEAR recommends a limit of 10 Bq/l (UNSCEAR 2000).
For radon Radium concentration and exhalation rate, a value of 370 Bq.kg-1 is recommended by Organization for Economic Cooperation and Development (OECD) OECD and UNSCEAR recommends a global average of 16mBm-2s-1 for exhalation in soil.(UNSCEAR,2000). There are no specific reference level or safe limit value in Ghana relating to radon levels indoors, water or soil for Ghana.
2.8 Radon Concentration Measurement Devices
A quantitative measurement of radon and its daughter products concentration is essential for the assessment and control of radiation exposure to the general public. Conceptually, measurement techniques can be divided into three broad categories:
- Grab Sampling
- Continuous and Active Sampling
- Integrative Sampling
The choice between these categories will depend on the costs involved, the time over which an instrument can be devoted to measurements at a single location, the kind of information required, and the desired accuracy with which measurements can be related to an estimate of risk.
2.8.1 Grab Sampling
Grab sampling provides instantaneous measures of radon or radon progeny in air. Since values fluctuate widely depending on various factors, grab sampling techniques are used in industrial monitoring.
2.8.2 Continuous and Active sampling
Continuous and Active sampling involves multiple measurements at closely spaced time intervals over a long period. The result is a series of measurements which can give information on the pattern with which the concentration varied throughout the measurement interval. These are costly and only recommended when other measures indicate a problem and the source of radon entry needs to be pinpointed precisely.
2.8.3 Integrative sampling
Integrative sampling devices are passive, and collect data on radon levels over a fixed period of time. Integrating devices collect information on the total number of radiation events which occur throughout some fairly long period of time, usually on the order of several days to months. The result from integrating devices is an estimate of the approximate average concentration through the environment interval.
The choice and method used for measurement depends on the particular information required, the type of radon survey and cost of apparatus involved. (Seitz, 1949)
2.9 Radon Measurement Methods
The environmental radon concentration is a function of time and climatic conditions. To monitor radon, both active and passive techniques have been developed. Active methods are usually used for short-term measurements of radon and mostly battery powered. Passive methods are more suitable for the assessment of radon exposure over long time scales and can be used for large-scale surveys at a moderate cost (Ahn and Lee, 2005) and does not run on batteries. Below are some of the commonly used methods and the methods used for this thesis will be discussed below:
2.9.1 Passive Techniques
Some of the passive techniques available are:
- Charcoal Canister Technique
- Solid State Nuclear Track Detectors (SSNTDs)
- Electrets ion chamber (EICs)
- Thermoluminescent Detectors (TLDs)
2.9.2 Active Techniques
Some of the available active techniques are:
- Ionization Chamber
- Scintillation Cell
- Two Filter Method
- Active Pylon Detectors /Continuous Monitoring
- Surface Barrier Detector (SBD)
- RAD7
2.9.3 Solid State Nuclear Track detection (SSNTD) and their Applications (Passive Technique)
As this research work has been performed using SSNTDs, it would be informative to briefly discuss track formation materials and basic principles of the formation of tracks in it.
Solid State Nuclear Track Detectors (SSNTDs) are insulating solids both naturally occurring and man-made. There are several types of these detectors including inorganic crystals, glasses and plastics. When a heavily ionising charged particle passes through such insulating solids, it leaves a narrow trail of damage about 50 Å in diameter along its path. This is called ‘Latent Track’ as it cannot be seen with the naked eye. These latent tracks can be enlarged / developed so that they can be viewed under an optical microscope by etching with some chemicals such as sodium hydroxide and hydrofluoric acid. Examples of some commonly used solid state nuclear track detectors are given in Table 2.18. A list of chemical etchants generally used along with the etching conditions for different detectors, particle sensitivity and the critical angle of etching are also given in Table 2.19. General properties of some of the most widely used plastic track detectors are listed in Table 2.20.
Table 2.19: Examples of Solid State Nuclear Track Detectors
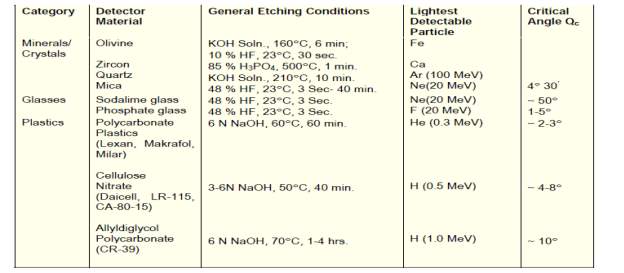
Table 2.20: Properties of some Plastic Nuclear Track Detectors
Cite This Work
To export a reference to this article please select a referencing stye below:
Related Services
View all


Related Content
All TagsContent relating to: "Medicine"
The area of Medicine focuses on the healing of patients, including diagnosing and treating them, as well as the prevention of disease. Medicine is an essential science, looking to combat health issues and improve overall well-being.
Related Articles

DMCA / Removal Request
If you are the original writer of this dissertation and no longer wish to have your work published on the UKDiss.com website then please: