Optimisation of Process Parameters of Machining Titanium Alloy (Ti6Al4V)
Info: 18351 words (73 pages) Dissertation
Published: 16th Dec 2019
Tagged: Chemistry
Optimisation of process parameters of machining titanium alloy (Ti6Al4V) using Taguchi and PCA method on CNC lathe machine
Abstract
Titanium alloy are one of the most prominently used materials in bio-medical field due their high tensile strength, corrosion resistance and light weight property. This paper deals with the experimental study to determine the effects that various cutting parameter have on the surface roughness and Material Removal Rate (MRR) while turning of Ti-6Al-4V metal on CNC Lathe machine. CNC turning according to the operation in the machine shop is method of machining part in which pointed cutting tool is feed parallel to the surface of the material being rotated. The desired rotation is performed by a lathe, consider among one of the oldest machining tool dated back to ancient Egypt. The lathe generally secure and spin the part that is being machined, allows for a simple single point cutting tool to remove and to shape material to create the desired part. Turning allow creation of the varying complex shape like filleted, threaded, plain, tapered, contoured and radius profiles. Turning in the pure form involve spinning of lathe and steady hand of operator to apply cutting tool on the material being machined. Advancement in the technology led to creation of CNC lathes and turning processes. An automated system hold the cutting tool in the lathe and follow a pre-programmed design allows for the precise turn, exact tolerances and many choices of shapes. The design of experiment (D.O.E) has been developed with the help of Taguchi method and Principal component Analysis (PCA) has been used for the optimization of the process parameters involved in the experiment. Analysis of Variance (ANOVA) is utilized to study the contribution of each parameter. Four parameters have been chosen as process variables: cutting speed, feed, depth of cut and nose radius each working combinedly at three different levels. The experiment plan is designed using Taguchi’s L9 Orthogonal Array (OA) as the degree of freedom of the variables available is nine .The effects of various parametric combinations on the turning process are studied and an optimization strategy for a pre decided set of parameter combination is developed in order to get a better surface finish and high MRR of the turned product.
Keywords: CNC (computer numeric control), Taguchi method, PCA (principle component analysis) method, Surface roughness, MRR (material removal rate)
Chapter 1
Introduction
1.1 Introduction to experimental work
Metals play a very vital role in modern medical science as far as fractured bones, joints and hip replacements are considered. For over a century now the use of metals such as steel, cobalt chromium alloy (Co28Cr6Mo), titanium alloy (Ti6Al4V) and many other materials have been prominent in the medical field. In modern industry, the goal is to manufacture high quality product with low cost in shorter period of time. Flexible manufacturing system (FMS) are employed for the purpose along with Computerized Numerical Control (CNC) machines that are capable to achieve very low processing time along with high accuracy. Turning is the most widely used among all cutting processes. Surface roughness has become the most significant technical requirement and it is an index of product quality along with material removal rate. CNC machining is the process used in the field of manufacturing involves use of computer to control the machine tool. Tools that can be controlled in machines includes lathes, mills, routers and grinders. CNC basically stands for computer numerical control. From the surface it look similar to normal PC that controls the machine but the computers has an unique software and control console that sets the system for use in CNC machining. Machine tools function mainly through the numerical control. The computer program is customized for an object and machines that is programmed with CNC machining language ( called G-Code) and it controls all features like feed rate, coordination, location and speed. These days the CNC machines are found in almost all industries, from a small scale industry to big companies. It is used for many purposes such as for making the shaft, gears and many other parts. It can be the manufacturing industries for making the various rounded, square, rectangular, threaded and other job. It is used for fabricating metal, in Electrical Discharge Machining (EDM) industry. CNC machines are also used extensively in the wood working industries to perform various operations like routing and drilling.
1.2 Optimization of process parameters.
In the past various research work has been conducted by researchers with the objective been optimization of process parameters of machining metals to best fit an industrial application in terms of capital investment & quality required. The present research work deals with optimization of process parameters of machining a titanium alloy on CNC lathe & the main objective being machining of titanium alloy in order to suit the various medical application.
The medical industry has been making use of metals in order to replace the broken bones, teeth & in special cases to replace the knee joint & hip joint for over a century now. The various metals which are used in transplant application are cobalt alloy, stainless steel & titanium alloy.
The problem with stainless steel is that it is slightly corrosive in nature & hence we chose to work with Titanium alloy because of its light weight, high fatigue strength & non corrosive nature. Titanium alloy is mainly used in medical transplant of bone joint & aerospace industry. The major issue with these implants are cost of implants because cost of these material and machining is very high the reason being high surface finish .There are various parameters which decide the material, those parameters are high surface finish & cost of machining. Surface finish is very important factor because poor surface finish can lead to various reactions of metal with body, which leads to the entering of metal ions in the bones which will be responsible for many health issues. Thus surface finish is most vital factor which is to be kept in mind while machining. Optimising is also one of vital factor in machining because titanium being a hard material (36 HRC), it is impossible to operate it with normal carbide cutting tool. Basically for harder materials diamond or CBN tool is used. Diamond is the hardest material but cost is quite high, thus CBN is used.
1.3 Vital Application:
Titanium alloy is used for many purposes such as in aircraft as well as in different mechanical components but our project mainly focuses on its use in medical field.In medical field it is used in bone fiting due to its light weight and anticorrosive properties.while selecting the material for medical puposes we have to give extra care for that because it is used in our body, so if any mishappening takes then it may cause serious issue, so we have read many books and journal papers and find titanium is the best suited for this purpose.
Another vital use of titanium alloy is in dental purposes, it is very crucial thing to select best material for dental purposes because many diseases took place through food intake so if we do not select the proper material then it may react with our food that we intake and may suffer from a number of diseases. Teeth is a lifeline for a human being ,by keeping this word in mind we read many books and journal papers and also discussed with our guide and then we select that titanium can safely used for implantment process.It is also used in surgical instrument which play an vital role in image guided surgery,wheel chair,crutches etc.
Titanium also find its uses in aircraft construction as the material used in aircraft should be light in weight and it should be anticorrosive in nature,should be of high tensile strength.so after readind many books we find that titanium has all this properties.Titanium has property to osseo integrate. The most common titanium alloy used is grade5(Ti-6Al-4V).
1.4 Introduction to our future work
Our main objective in future would be selection of various process parameters under different levels and make use of Taguchi DOE to design various experiments combining different levels of process parameters. The selection of various process parameters and their levels is based on studies we have made on different journal papers and books. After this we will conduct the experiment in CNC lathe machine to turn the titanium alloy under different conditions then with help of machined product determine the output parameters which are surface roughness obtain under various experiment and the corresponding material removal rate.
Chapter 2
Literature review
2.1 Overview
Our project is based on the turning of titanium alloy to optimize their process parameter. Many research work have been done on machining of titanium alloy but we focus here on the use of it in bone fitting and dental purposes. Many people are using steel, cobalt ,stainless steel but after studying many books and journal papers, we find that titanium is best suited for this purposes due to its properties like light weight, anti corrosive nature. So we decided to go with titanium alloy
2.2 Review about the material used
Our project is mainly focusing on the bone fitting and dental purposes. So after reading many books and journal paper as well as the current thought of researcher we find titanium is the best alloy which can be implemented successfully for this process due the properties like anti corrosive nature, lighter than steel. This is the most important part of our project to select a effective material because we are going to deal with human body.
2.3 Review about the process used
After selecting proper material, our main work is to find the best process that can done it in effective manner. So again after reading many books and journal papers we find that CNC lathe can do it in a proper manner, then we decide the basic input parameter of machining process that is speed, tool nose radius, depth of cut, feed to implement the turning process in a effective manner in order to find an optimize value. Then we machine it and got several reading
Yallese et al studied statistical model for the cutting forces in the dry turning operation of AISI H11 hot work piece steel (50 HRC). To achieve this, they performed 27 experiments and specified effects of parameters like cutting speed, depth of cut & feed rate.With the help of MINITAB it was determined that the most important factor affecting the cutting force is depth of cut.
In one another experiment by Gupta wherein the RSM, SVR & NN method was used to analyze the surface roughness , tool wear & power involved in turning operation based on cutting speed, feed rate & cutting time; it was found that SVR & NN method gave better result than regression & RSM.
Experiments carried out by D.Manivel & R.Gandhinathan in order to optimize the surface roughness & tool wear in hard turning of austempered ductile iron (grade 3) where they made use of Taguchi method and L18 orthogonal array by choosing the cutting parameters as cutting speed, feed rate, depth of cut with 3 levels & 2 levels of nose radius. It was found that the cuuting speed is the most dominating factor that affects the surface roughness & tool wear. The optimal cutting condition were predicted using signal to noise ratio & regression analysis.
The study conducted by Sayak Mukherjee , Anurag Kamal, Kaushik Kumar for optimizing the material removal rate (MRR) during turning of SAE 1020 material in CNC lathe where they made use of Taguchi method employing L25 orthogonal array for 3 parameters namely speed, feed & depth of cut with 5 different levels. The study produced predictive equation to determine the MRR with given set of parameters in the CNC lathe. Thus it was later found that with proposed optimal parameters it can be possible to increase efficiency of machining process & decrease the cost of production.
The study conducted by Meenu Gupta & Surinder Kumar in order to investigate the surface roughness & MRR for turning Of UD-GFRP using PCA & Taguchi method. The paper investigates the machinability of unidirectional GFRP composite in turning process. A taguchi L18 orthogonal array is used for designing the experiments. The parameters such as node radius, feed rate, depth of cut, cutting speed, tool rake angle & cutting environment are selected to investigate their effect on the output response. PCA has been used to transform correlated responses inro uncorrelated quality indices. It was determined that surface increases as feed rate increases also it was found that the order of significant parameters lead by feed rate = 0.2 are depth of cut = 1.4 , cutting speed = 159.66 m/min produced the an optimal value of surface roughness equivalent to Ra = 1.498mic.metre & Optimal MRR = 330.267mm3/sec.
The influence of cutting fluid conditions & cutting parameters in turning process of mild steel bar using coated carbide tool insert on CNC lathe were studied by Sujan Debnath, Moola Mohan, Qua Sok Yi to determine their effects on surface roughness & tool wear. They made use of Taguchi orthogonal array to minimize the number of experiments. It was found that effect of feed rate is most dominating factor which contributed to about 34.3% of surface roughness of workpiece & the flow rate of cutting fluid contributed to about 33.1% . Whereas cutting speed & depth of cut prominent factors that influenced the tool wear contributing about 43.1% & 35.8% respectively.
In a study conducted by B.Singarvel , T.Selvaraj, R.Jeyapaul , in multiple objective optimization of turning EN25 steel. They estimated the optimal machining parameters using Taguchi based utility concept coupled with Principal Component Analysis (PCA).This method has been used for simultaneous minimization of surface roughness, cutting force & maximization of MRR. PCA is used to find the weight factor involved in all objectives, WRa = 0.035, Wcutting force = 0.448, WMRR = 0.515 . ANOVA employed on SN ratio to determine their individual contribution in percentage. It was found that the optimal cutting speed equals 244m/min, Feed rate = .1mm/rev, depth of cut = 1mm.
Optimization of machining parameters of SS 316 for SR & MRR in CNC turning was done by Prajapati et al. Dimension of work material is respectively diameter = 45mm & lenght= 35mm. In this paper study was regarding effect & optimization of machining parameters (namely cutting speed, depth of cut & feed rate ) on SR & MRR. In this process an L27 orthogonal array , grey relation analysis & analysis of variance is used.
A study was conducted by Chandrasekaran et al in which he focused on the machinability of AISI 410 on CNC lathe (FANUC) for SR using taguchi method. ANOVA & L27 orthogonal array was involved in this study. Dimension of work piece was Diameter = 32mm & lenght = 60mm. They studied on the effect of process parameters in turning operation of copper by combination of Taguchi & Principle component analysis method. Output parameters which were on focus was material removal rate & surface roughness, which are quality parameters. They concluded that Taguchi with PCA method can be recommended for continuous quality parameters & off line quality control of a process or products.
A study was conducted by Anish et al. in which multi objectives were optimized in CNC end milling of Aluminum using PCA . Input parameters were depth of cut, speed & feed rate. He took surface roughness index Ra & Rq as quality parameters. Total 25 experiments were conducted. He found the optimal setting to assure the lowest quality loss i.e., Depth = 0.10mm, Feed = 1000mm/min, Speed = 4750rpm. He finally concluded that PCA can be used in industries & places where there are large number of response variables.
In order to Optimize the machining parameters of wire electrical discharge machining for multiple performance characteristics on EN 31 tools steel using weighted principal component analysis was studied by Milan Kumar Das et al. The L27 orthogonal array of taguchi is used along with four machining parameters i.e., pulse on time, discharge current, pulse off time, voltage. The output parameter was surface roughness (Ra, Rsk, Rsm, Rq, Rku) & material removal rate(MRR). He found the optimal setting for minimization of roughness & maximization of MRR which was verified through confirmatory test & it was finally concluded that increase in S/N ratio at the optimal condition was about 21%.
Another optimization was carried out by Rina Chakravorty et al. In which she optimised the output of EDM processes using Principal component analysis based utility theory approach .In this experiment she analyzed the two sets of past experimental data on EDM process using the modified PCA based PQLR method & PCA based UT method. The comparison was found out for the optimization performances at the optimal conditions using two methods which concludes that modified PCA based UT method gives better optimization performance.
Sanjit Moshat et al. conducted an experiment on multi objective optimization for end milling operation in CNC end milling using PCA based hybrid taguchi method. Input parameters were depth of cut, speed & feed rate. For quality parameters surface roughness & material removal rate was chosen. L9 orthogonal array of taguchi was used in this experiment. They found that PCA based hybrid Taguchi method is the best way to optimize the multi objective quality parameters.
A research was conducted regarding effect process parameters of EDM on material removal rate & wire wear rate by Miss Swati D.Lahane et al. They used weighed principal component method to interpret the result data. They found that weighed principal component method reduces the uncertainty & complexity of engineers judgment related with Taguchi method. Finally they concluded that WPC offer better overall quality.
A study was conducted by Aouici et al. regarding effect of feed rate, cutting speed & cutting time using RSM & ANOVA. They made use of CBN tool to machine AISI H11 steel & under these cutting forces they analyzed the tool wear & values of surface roughness. They concluded that most influential factor in tool wear is cutting time interval whereas for surface roughness, the feed rate was most influential parameter.
An investigation was conducted by Suresh et al. regarding effects of cutting speed, depth of cut, machining time & feed rate on cutting forces, surface roughness & tool wear during turning of an AISI 4340 hardened steel by involving RSM method. They focused to minimize the surface roughness & cutting forces in which they found that it is mandatory to keep high cutting speed, short machining time, low depth of cut & low feed rate. For minimization of tool wear it is must to keep feed rate & cutting speed low.
Chavosi & Tajdari conducted an experiment in which operated AISI 4140 steel with CBN cutting tool on a lathe with variables as cutting speed & hardness, also keeping feed rate & depth of cut as constant. Output parameters was surface roughness (Ra). They made use of artificial neural networks & regression methods, they developed an approximate model that gives an optimum surface roughness. They concluded that hardness has significant effect on surface roughness.
Sahoo investigated on effects of feed rate, depth of cut & cutting speed on the formation of surface roughness for AISI 1040 steel when the machine was employed on CNC lathe for turning operation. Three input parameters were used whose role is analyzed by the ANOVA analysis & genetic algorithm was used for the purpose of optimizing the parameter results.
Ranganath et al. conducted an experiment in which effects of feed rate, cutting speed & depth of cut on surface roughness of various materials during machining was studied. They concluded that RSM method gives better results.
Kopac & Krajnik investigated the robust design of flank milling parameters with optimization of the milled surface roughness, material removal rate & the cutting speed in the machining of an Aluminum alloy casting plate for injection moulds. He made use of Grey Taguchi method which combined the design of experiment, orthogonal array with grey relational analysis. They concluded with the optimal data of milling parameters for multiple process responses.
A study was conducted by Yang & Chen regarding systematic method of using Taguchi parameter design in process control of milling machine.In order to identify the optimum surface roughness performance with combination of cutting parameters in an operation of end milling, taguchi parameter design was taken in order.
Ghani et al investigated on optimization of cutting parameters in end milling machine on hardened steel work piece using Tin coated carbide insert tool. He conducted experiment under finishing & semi finishing conditions of high speed cutting considering parameters: feed rate, depth of cut & cutting speed.
A study was conducted by Dileep kumar, Arun, Abraham K Varughese for the effect of tool node radius on suraface finish & optimization of machining parameters of turning operation of titanium alloy(Ti-6Al-4V). Taguchi & Grey relational analysis was used to obtain desired result. L9 orthogonal array is selected with four input parameters namely: nose radius, feed rate, cutting speed & depth of cut. A rod of Ti-6Al-4V of 52 mm diameter & 137mm length is used as work piece along with uncoated carbide tools of CNMG. Main output parameters were surface roughness & material removal rate which was further processed using MINITAB statistical software. Finally they found from S/N analysis and ANOVA that tool nose radius (15.26%) & feed rate(77.14%) are the important factors which affects the surface finish. Also a predictoin model is developed for both surface roughness & material removal rate using multiple regression analysis.
2.4 Conclusion
So after these all steps like finding the best suited material.process.machine and parameters, we conducted our experiment and we got different reading by setting different parameter and we adopted taguchi and pca methodology for further analysis to optimize the parameter
Theoretical concept and application
3.1 Introduction to CNC
CNC stands for computer numerical control is basically a form of soft automation and now it application covers almost of all kind, as it was initially developed to control motion and operation of machine tool.
Computer Numerical Control is operated by the means of command in the form of discrete values that are feed into the machine with required input technical information being stored in the storage devices like USB, floppy disk, hard disk, flash drive and RAM card etc. the machine always follows the pre-determined sequence of operations at predetermined spped necessary to produce the workpiece of desired size and shape and as per the predictable results. In short CNC receives the numerical data, interpret the data and then control the actions of machine accordingly.
Basic elements of automated system are:
- Power to accomplish process and to operate system
- A programme of instruction for the process
- Control system that actuate the instructions.
Control system in CNC machine
a). Open loop control system:
In this type of control system input is directly feed into the system and output is obtained as there I no provision for the feedback system. This system has no access to real time data and therefore no corrective action can be taken in case of the system disturbance. This system is only applied in the case where the output is almost constant and predictable. For wire cutting machine still prefer the open loop control system as virtually there is no cutting forces in this type of machining process.

SYSTEM
Fig. 3.1: Block diagram of an open loop system
b). Close loop control system:
In close loop control system the output is closely monitored by the feedback devices and they disturbances occurring is corrected in the first instance. Therefore high accuracy is achieved. This system is more powerful when compared with the open loop control system and can be applied where the output id subjected to the frequent changes. Nowadays this control system is used almost in all CNC.
Fig. 3.2: Block diagram of close loop system
Elements of CNC system
CNC system consists mainly of 6 major elements:
- Input device
- Machine control unit
- Machine tool
- Driving system
- Feedback devices
- Display system
- Introduction to the biomedical material
Biomedical material are those material that can be used in conjugation with the human body. An ideal biomaterial is expected to exhibit the properties like high biocompatibility and there should be no adverse tissue response. Also its density must be low as that of the bones, high mechanical strength and fatigue resistance, good wear resistance and low elastic modulus. It is very difficult to combine all the desired property of the element into one material. Selected materials are used as biomedical material due to their high excellent mechanical properties and high biocompatibility. Metallic bonds in this material are non-directional, position of metal ions can be altered without destroying crystal structure results in plastically deformable solids. The principal disadvantage of using metal as biomaterials is its corrosion in vivo environment. Some metals can be tolerated by the body in small amount as metallic ions. The consequences of corrosion weakens the implants and leads to its disintegration and have harmful effect on the surrounding tissues and organs. Some metals are used as substitute for the replacement of knee and hip joints in the body and also to integrate the fractured bones ih the body. For fractured bone plate and screws are used and also dental implants can be used in the teeth. Some metallic alloys are even used for more active roles like actuator for vascular stent and orthodontic arch wires. Metallic biomaterial can be grouped into following categories:
- Stainless steel
- Titanium base alloys
- Cobalt base alloys
- Speciality metallic alloys
Vanadium steel was the first metal alloy that was developed for human use but no longer in use in implants because corrosion resistance of this material is not adequate in vivo environment. Later in 1950s 18-8s with low carbon content stainless steel was introduced and it was widely used for the purpose of implant fabrications. These alloy have good resistance to the chloride solutions. Castable CoCrMo alloys used for decades recently in making joints and in dentistry purpose. Currently CoNiCrMo are used for the purpose of making heavily loaded joints such as knee and hip joints. Above both the alloys have excellent properties of corrosion resistance.
Attempts to use the titanium alloys as biomaterial was made in the year 1930s. Titanium light weight and good mechanical chemical properties made it suitable for implants applications. Titanium tolerance is similar to that of stainless steel and cobalt alloys. Titanium have bioactive behaviour due to which there is slow growth of hydrated titanium oxide on titanium implant surface that incorporate calcium and phosphorous. Titanium is the only material that have the property to osseo integrat. So the light weight, high mechanical strength, fatigue strength and excellent corrosion resistance property made it the best biomedical material among all the material used now a days. Titanium cannot react with the body fluids even in the very long terms of its service.
- Titanium alloys
Ti-6Al-4V is alpha beta alloy of titanium contains about 6% aluminum and 4% vanadium and rest titanium. The vanadium acts as the beta stabilizer and provide greater amount of ductile in the beta phases during its hot working. The aluminum mainly stabilize and strengthen the alpha phase by raising the beta-transus temperature as well as by reduction in the density of the alloys. These titanium alloys have excellent tensile property even at the room temperature, annealed materials have a typical tensile strength of 1000-1100 MPa (145-160 ksi) and is found useful creep resistances up to 300°C of about 570 MPa (83 ksi) for about 0-1% total plastic strains in 100 hour. Heat treatment gives guaranteed minimum tensile strength of 1100 MPa (160 ksi) for application such as springs, bolts or other fasteners.
Like as the most grade among the titanium alloy Ti-6%Al-4%V has an excellent resistance to corrosion in natural and industrial environment. Its density is 4.0-4.2 g/cm3 even lower than pure form of titanium. Resistance to fatigue and crack propagation is being excellent. It can be formed and forged readily and also use in many welding operations are possible.
Table 3.1 Chemical composition of Ti-6Al-4V:
| Element | Al | V | Fe | H2 | Ti |
| Wt % | 5.5-6.75 | 3.5-4.5 | 0.30 max | 0.0125 max | Remainder |
Titanium alloy is available as the annealed plate, hot worked rod, sheet, bar and billet for future working and also as an annealed rod and bar for machining purposes. Pipes can also be supplied as extrusion or formed and welded from the plate. Heat-treatable rod is used for the purpose of fasteners manufacturing and also bar-drawn wire can be made for spring application.
General Characteristic:
The outstanding corrosion resistance and high strength or low weight ratio inherent in titanium and its alloys has led to the wide range of successful application which demand in high level of reliable performance in aerospace, auto-motive, chemical plant, power generation, oil and gas extraction, sport, surgery and medicine as well and in other major industries. In majority of this and other engineering application titanium has replaced other material heavier, less serviceable or less cost effective materials. Designing anything with titanium taking all factors into account has resulted in reliable, economic and durable systems and component, which in many situation has substantially exceeded the performance and service life expectation. Titanium is also available in several different grades. Pure titanium is not much strong as the different titanium alloys are.
Table 3.2 Mechanical properties:
| Properties | Metric |
| Tensile strength | 220 MPa |
| Modulus of elasticity | 116 GPa |
| Shear modulus | 43 GPa |
| Hardness, Brinell | 70 |
| Elongation at break | 54 % |
| Poisson ratio | 0.34 |
Table 3.3 Physical properties:
| Properties | Metric |
| Density | 4.50 g/cm3 |
| Melting point | 1650-1670 C |
| Boiling point | 3287 C |
3.3.1 Why titanium alloy:
Titanium alloy is incredibly used for the number of different industries like including the automotive, aerospace and architectural world. As titanium can resist corrosion it is biocompatible and also has an innate ability to join with the human bones and now it acts as the staple in field of medical. Now from starting from surgical titanium instruments to the orthopedic titanium rod plate and pin all medical and dental titanium truly become the fundamental material used in field of medicine.
Because of the high specific strength and excellent corrosion resistance, titanium alloys are used in the engineering field, namely in the aerospace, automotive and biomedical parts widely. In many application these material replaced the steels and aluminum alloys which usually results in the weight or space saving increase of system efficiency by rising service temperature and removal of the need of protective coatings that should be use in steels.
3.4 Medical Grade titanium
Titanium 6AL4V alloy made of 6% Aluminum and 4% Vanadium is the most commonly type of titanium used in the field of medicine. Because of its combining factor with human body titanium alloy are widely used in almost all the medical procedures and also in body Piercings.
Ti-6Al-4V offers us the greater fracture resistance when it used in dental implant. The implant steps begin with insertion of titanium screw in the jaw. The screw behaves like the root of the tooth. After a certain period of time passed for the bone grow into medical grade titanium screw the fake tooth is connected to the implant.
Advantages of Medical titanium:
- Stronger
- Light in weight
- Corrosion resistant
- Cost efficient
- Non toxic in nature
- Bio compatible
- Long-lasting
- Non- ferromagnetic
- Osseo integrated ( the joining of bone with artificial implants)
- Long range availability
- Flexibility and elasticity rivals that of human bone
Fig.3.3: Properties of titanium alloy
One of the greatest benefit to use titanium is its higher strength-to-weight ratio and corrosion resistance property. Coupling it with non-toxic state and ability to fight from body fluid and its no wonder that titanium has became the metal of choice in field of medicine.
| Titanium is incredibly durable and used long-lasting. When the rod, cages, plates and pins made up of titanium is inserted in the body it lasts for over 20 years. And the dental titanium like that of titanium posts and implants can last even longer than that.
Other benefit of using titanium for medicine is its non-ferromagnetic property which allow the patients with titanium implant to be safely examined with the help of MRIs and NMRIs. Osseo integration is an amazing phenomenon in which the body natural bone and tissue bond to artificial implant. This anchor titanium dental and medical implant into place. Titanium is the only one metals that allows for this integration. |
3.5 Uses of medical titanium:
Most of us know only that someone requires the orthopedic surgery is replaced by the failing hip socket, shoulder joint or severely broken bone. Its likely medical grade titanium that is only material of choice for the surgeon when they are reconstructing these parts of the body are required. As the evidence in the previous section, natural titanium properties make it perfect alloy to be use in the human body.
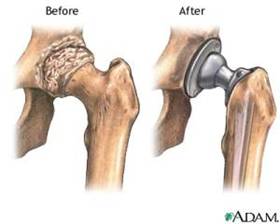
Fig.3.4: Titanium alloy used in body
Medical grade titanium can be used in producing:
|
Among some of commonly uses of the titanium are basically in the hip and knee replacement surgeries. It can be used to replace shoulder and elbow joint and also to protect the vertebrae and invasive back surgery. Titanium peg are mainly used to attach the false eyes and ears and titanium heart valves that are even competing with the regular tissue valves.
Surgical titanium instruments:
There are so many special features that makes the titanium material of perfect choice for surgical instrumentation:
- It is even harder than some steel, but yet lighter in weight.
- It is also bacteria resistant.
- It can also be used in the conjunction with instrument emitting radiation.
- Titanium is most durable giving the instruments greater longevity.
Because of the following properties, it can be used in creating the surgical devices of titanium:
|
3.6 Machinability and biomedical applications of titanium alloys:
Machinability of titanium alloy:
Titanium alloys are most widely used in the engineering field namely like in the aerospace, automotive and biomedical parts because of the high specific strength and corrosion resistance property. However machinability of titanium alloy is difficult due to low thermal conductivity and elastic modulus, high hardness at elevated temperature and high chemical reactivity.
Table 3.4 Influence of titanium properties on its machinability:
| Property | Description |
| Thermal conductivity | Low thermal conductivity causes concentration of heat on the tool cutting edge and face, influencing negatively the tool life |
| Chemical reactivity | Reactivity with common gases such as oxygen, hydrogen and nitrogen leads to formation of oxides, hydrides and nitrides, respectively. These phases cause embritlement and decrease of the fatigue strength of the alloy. Surface hardening by formation of hard solid solution due to internal diffusion of oxygen and nitrogen cause decrease of the fatigue strength of machined surface and increase of tool wear. Reactivity with cutting tool material causes galling, smearing and chipping of the work piece surface and rapid tool wear |
| Elastic modulus | Low elastic modulus allows deflection of slender work piece under tool pressure, inducing chatter and tolerance problems. |
| Hardness and strength | The high temperature strength and hardness of titanium alloys require high cutting forces which results in deformation on the cutting tool during cutting process.
High dynamic shear strength during cutting process induces abrasive saw-tooth edges, generating tool notching. |
Biomedical application of titanium alloy
- Stent Implants:
Stent implantation is the stage of development of invasive cardiology. The stent is the miniature metallic mesh, mainly made from stainless steel filaments and recently of special nickel-titanium or cobalt chromium alloys that is mounted on dilatation balloon and implanted into dilated arterial site.
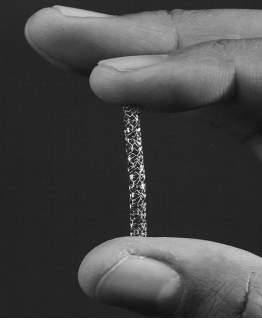
Fig.3.5: An example of stent
Routine stent use in practice has now significantly reduces the incidence of complication, restenosis and repeat re-vascularisation after coronary angio-plasty. A great number of study result including this from 8 to 10 year follow-ups of patients, have shown the superiority of coronary stent placement over cardio surgical re vascularisation. However tendency to prevalent recurrent complaints and repeat re vascularisation still observed in the patients with stents. A possible decision of this problem is introduction of the drug-eluting stents. These are stents that are loaded with a specific drug mainly the cytostatic agent that inhibit the endothelial and fibro muscular excessive proliferation induced by the presence of a foreign body in the blood vessel. Presently the increasing number of interventions is performed in other than the coronary arteries – carotid artery stenting, endoaortic prosthesis, laser atherectomy and rotablation, angioplasty of peripheral visceral and renal arteries closure of atrioventricular fistulas vascular embolisation insertion of inferior vena cava filters in case of the pulmonary thromboembolism, super selective fibrinolysis in cases of pulmonary thromboembolism, percutaneous mitral and aortic valvulo plasty, etc.
- Dental Titanium:
Being the artificial substitute of lost tooth, the dental implant is mainly used in dental prosthetics as support of bridge and crowns. There are several other types of dental implants, generally classified as osseo integrated and fibro integrated implants. Presently the commonly used and successful implant are the osseo integrated titanium screw implant which are mainly based on the fundamental inventions of the Swedish Professor Per-Ingvar Braine mark, who puts the basis of contemporary implantology 30 years before. He proved experimentally that the intraosseously implanted titanium is surrounded by the newly formed bone adhering to it this phenomenon is called “osseo integration”. This is the rarely observed natural process –the creation of a bond between the living tissue (bone) and the foreign body (titanium/metal). The structural and functional relationship among the bone and implant are formed, making the bone-implant complex unit.
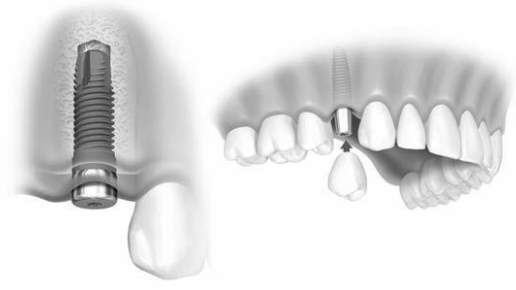
Fig.3.6: Appearance of most commonly used dental implants
As mentioned earlier the titanium has an ability to fused with living bone of the body. This property make it the widely beneficial in the world of dentistry. Titanium dental implants has became one of the widely accepted and successfully type of implant due to its property to osseo integration. When the forming cells of bone attach themselves with the titanium implant structural and functional bridge forms between body bone and the newly implanted foreign object.
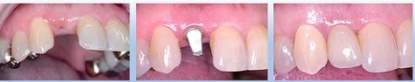
Fig.3.7: Titanium alloy used in dental application
Titanium orthodontic braces now also emerging among popularity. They are more stronger, secure and even lighter than their steel counterpart. And its medical grade titanium biocompatibility make it useful in the braces and even more beneficial than its competing alloys.
3.7 Future of biomedical titanium:
It is expected that the use of titanium alloy within the field of biomedical industry will be continue to grow for titanium in coming year. With the baby-boomer demographic continuing to age and the health industry pushing people to live more active live, it is the only logical that the medical industry will be continuing to research the new and innovative uses for this popular metal alloy. And with the health care reform the current major issue, titanium cost-efficiency add even more appeal for those looking to cut health care costs.
Chapter 4
Experimentation
4.1 Introduction
In this project we basically optimize the process parameters of titanium alloy in its machining with CNC lathe using Taguchi as design of experiment and have combined it with the PCA in order to get the optimal result for the experiment. The main aim is to obtain an optimal condition upon which the surface finish so obtained is best and the material removal rate should be maximum. For this we basically select certain input cutting parameters like feed rate, depth of cut, cutting speed and tool nose radius.

STUDY OF MATERIAL SPECIFICATION AND PROPERTIES
SELECTING OF INPUT PARAMETER AND DESIRED OUTPUT PARAMETERS

SELECTION OF NOISE SIGNALS AND SIDE EFFECT

MATERIAL MACHINING USING CNC LATHE WITH DIFFERENT INPUT PARAMETERS

TAGUCHI METHOD FOR OPTIMIZATION OF PROCESS PARAMETERS

RESULT AND DISCUSSUION ABOUT OPTIMAL CONDITION
Fig 4.1: METHODOLY OF PROECT
4.2 Setup of material, machine and tool
Experimental Setup
In this chapter the experimental work was discussed which consists of experimental setup, selection of work piece material, machining and other experimental process. By taking all this information into account material removal rate and surface roughness is calculated. In this experiment the entire work has been carried out by CNC lathe machining of titanium alloy from PARISHUDH TC 250 Horizontal CNC lathe. On this machine by adjusting different parameters the different output are obtained. The maximum RPM utilised in turning o titanium alloy is 800.
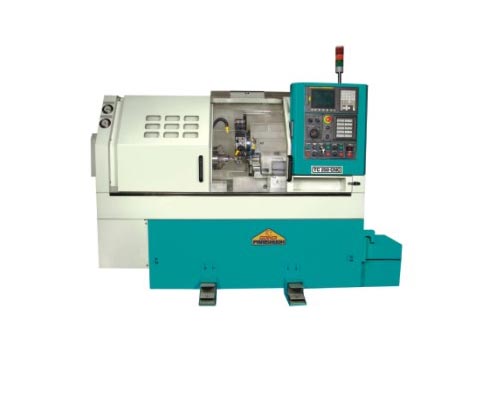
Fig. 4.2: CNC lathe machine used for experimental procedure
Table 4.1 The specification of machine used is as follow:
| Model | TC 250 |
| Swing over bed | 450 mm |
| Maximum turning Diameter | 280 mm |
| Maximum turning length | 500 mm |
| Chuck size | 200/250 mm |
| Spindle power continuous | 7.5 KW |
| Speed range | 50-3500 RPM |
| Full power | 750-3250 RPM |
During machining of titanium alloy we choose input parameter as Cutting speed(RPM), Feed rate (mm/rev.), Depth of cut (mm) and Nose radius (mm) for these input parameters we obtained outcomes in form of surface roughness and MRR.
Tool Used:
Tool used for carrying experimental work is CNMG tool. This tools are basically rhombic in shape and have positive rake angle, low cutting forces, provides very reliable performance and excellent tool life. The surface roughness is found less by using this tool and also this tools are having less wear and tear rate.
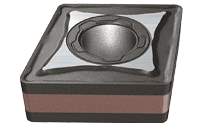
Fig. 4.3: CNMG tool used for experimental procedure
Another tool used for experiment is surface roughness tester. As the main outcome of our experiment is to measure surface roughness under different conditions. By using this tool in close proximity with the workpiece one can easily get the surface roughness Ra value under different machining conditions.
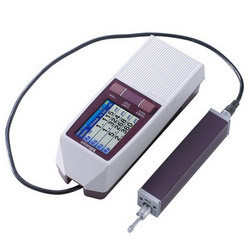
Fig. 4.4: Surface roughness tester
For another outcome parameter i.e. MRR, we used weight loss method. In this method we measure the initial weight of the work piece before machining and the weight after machining. The different in the before and after weight of work piece one can measure the MRR.
Input parameters:
- Cutting speed
- Feed
- Depth of cut
- Nose radius
Output parameter:
- Surface roughness
- Material removal rate (MRR)
Table 4.2 For the experimental process we choose input machining parameters at three levels:
| Levels | Parameters | |||
| Cutting speed
(RPM) |
Feed rate
(mm/rev) |
Depth of
cut(mm) |
Nose radius(mm) | |
| Level 1 | 400 | 0.05 | 0.3 | 0.4 |
| Level 2 | 600 | 0.15 | 0.5 | 0.8 |
| Level 3 | 800 | 0.25 | 0.7 | 1.2 |
4.4 Design Of Experiment
For obtaining the optimal conditions for any experiment we have to conduct number of experiments in order to get the best result among the various observations made. Actually one conduct design of experiment in order to get the optimal result for the experiment in less number of experiments. For our experimentation procedure we have chosen Taguchi method for optimization and to get one optimal desired result we used Principal component analysis as the tool.
Taguchi method
Taguchi method is the statistical tool that is mainly used in making a robust design. This method is now widely used in controlling the various machining parameter in less numbers of experiments are being conducted.
Taguchi methods are the statistical method that basically improve quality of the manufactured goods and this is being applied to engineering, biotechnology, marketing and advertising. This was developed by Genichi Taguchi , Professional statisticians have welcome the goal and the improvement that are brought about by Taguchi methods, particularly by Taguchi development of design for studying the variation, They are sometimes called robust design methods also.
- Robust Design:
Robustproduct design is the concept emerges from the teachings of Dr. Genichi Taguchi a Japanese quality fame. It is basically defined as the reducing variation in the product without eliminating the cause of the variation. In other words, to make the product or process insensitive to the variation. Robustness is an state where technology, product, or process performance is basically minimally sensitive to factors causing the variability (either in the manufacturing or users environment) and aging at the lowest unit manufacturing cost.
- Loss Function:
Statistical methods are relies on the mean unbiased estimator of treatment effects:
Under the certain condition specified as by the Gauss markov theorem, least squares estimators are found having minimum variance among all mean-unbiased estimators. The emphasis put on the comparison of the means also draw (limiting) comfort from the law of large number, according to which the sample is the means converge to the true mean. Thus, loss functions were avoided by Ronald A.
It is the formula that basically estimate the loss in the quality that occurs as the result of a product having a variation in the desired quality. In mathematical optimization, statistics decision theory and machine learning, the loss function or cost function is the function that map an event or value of one or more variable into a real number intuitively representing some of the cost associated with the event.
Goal post philosophy emphasize that if the product feature does not meet the designed specification then it will be termed as a product of poor quality (rejected), irrespective of the amount of deviation from the target value (mean value of tolerance zone). This concept has the similarity with the concept of scoring a ‘goal’ in the game of football or hockey, because the goal is count as ‘one’ irrespective of the location of strike of the ball in the ‘goal post’, whether it is in the center or towards the corner.
After explaining the concepts of the quality loss function Taguchi explained that from the customer point of view this drop of quality is not sudden. The customer experiences a loss of quality the in the moment product specification deviates from the ‘target value’. The ‘loss’ is depicted from the quality loss function and follows a parabolic curve mathematically given by L = k(y–m)2, where m is theoretical ‘target value’ or ‘mean value’ and y is the actual size of the product, k is a constant and L is the loss. This means that if the difference between ‘actual size’ and ‘target value’ i.e. (y–m) is large, loss would be more irrespective of the tolerance specifications. In Taguchi view tolerance specifications are given by engineers and not by the customers; what the customer experiences is ‘loss’. This equation is true for a single product; if ‘loss’ is to be calculated for multiple products.
The three characteristics that shape the definition of Taguchi loss function are:
- Nominal, where the best characteristic or target value is the median of the specified upper and lower acceptable limits, and the losses owing to deviance from the target value rise proportionate to the extent of deviance on either side of the mean. Here an example includes the frequency settings in radio and wireless equipment. For instance, the equipment not confirming exactly with the set frequency is defective increases the social costs for repair or replacement
- Smaller-the-Better, where the ideal target value or best quality standard is zero, and the higher the actual value, the higher the private and social costs. Examples of such instances include heat loss in heat exchanger, or carbon dioxide emissions. For instance, the more heat lost by the heat exchanger, the less efficiently it functions, and the higher the social costs.
- Larger-the-Better, where the ideal characteristic or best quality standard is infinity, and the higher the actual value, the better, and the lower the actual value, the more the private and social costs. Examples of such instances include maximizing product yield from a process, agricultural output, and the like. For instance, the higher yields indicate better quality seeds, and lower yields increase the social costs.
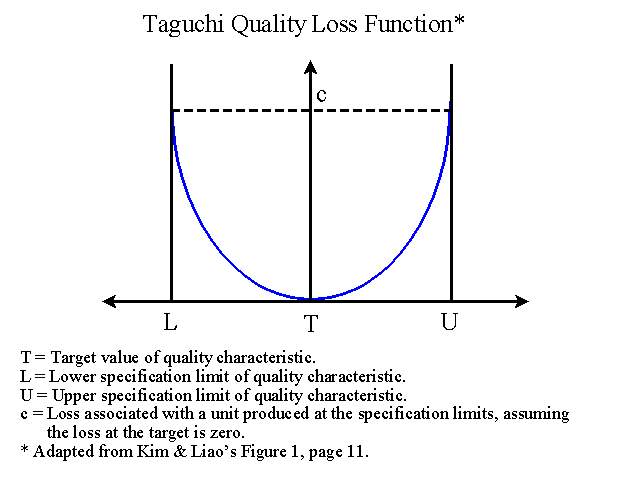
The QLF is a “U” shaped parabola. The horizontal axis is tangent with the parabola at the target value. This is a quadratic loss function because it assumes that when a product is at its target value (T) the loss is zero.
The unit loss is determined by the formula:
L(y) =k(y-T)2
Where:
k = a proportionality constant dependent upon the organization’s failure cost structure,
y = actual value of quality characteristic,
T = target value of quality characteristic.
The value of k must first be determined before the loss can be estimated.
To determine the value of k:
k= c/d2
Where:
c = loss associated with the specification limit, and
d = deviation of the specification from the target value.
The value of k determines the slope of the QLF, the larger the value of k the steeper the parabola. This is a symmetric QLF because it is assumed that there is a constant k for the whole loss function. The value of c is a major component in the loss function. This value represents the intangible quality costs of a product.
Off-line Quality Control
Off-line quality control methods are quality and cost control activities conducted at the product and process design stages to improve product manufacturing and reliability, and to reduce product development and lifetime costs. Parameter design is an off-line quality control method.
At the product design stage the goal of parameter design is to identify settings of product design characteristics that make the product’s performance less sensitive to the effects of environmental variables, deterioration, and manufacturing variations. Because parameter design reduces performance variation by reducing the influence of the sources of variation rather than by controlling them, it is a very cost-effective technique for improving product quality. This paper introduces the concepts of off-line quality control and parameter design and then discusses the Taguchi Method for conducting parameter design experiments.
In the early 1950s the Department of Defense and the electronics industry commissioned a task force called the Advisory Group on Reliability of Electronic Equipment (AGREE). The AGREE report recommended that a special discipline be imposed during the development phases to ensure that designs would be reliable. To be included in the discipline was design analysis techniques and formal reliability demonstration testing.
Recent developments in reliability have tended to reduce the emphasis on predicting and demonstrating reliability. More emphasis is being placed on design analysis and on testing to discover potential weaknesses so that improvements could be made early in the development cycle. This approach has long been used by the best of the commercial industries, and the purchasers and developers of large systems.
In addition to reliability studies, the off-line quality control methods common in the U.S. include maintainability, sensitivity analysis, and prototype testing. Maintainability is concerned with implementing principles basic to future equipment repair while the equipment is being designed, developed, or fabricated. Sensitivity analysis deals with making products robust to operating and environmental variation. Prototype testing is done to insure optimum design, layout, operation, and/or safety.
Taguchi realized that the best opportunity to eliminate variation is during the design of a product and its manufacturing process. Consequently, he developed a strategy for quality engineering that can be used in both contexts. Stages in this manufacturing process include:
- System design
II. Parameter design
III. Tolerance design
- System design: This is the scratch level of the process. Here, the design is at the conceptual level, involving creativity and innovation. System design is applying engineering and scientific knowledge to product and prototype design. The prototype defines the initial settings of product or process design characteristics.
- Parameter design: Once the concept is established, the nominal values of the various dimensions and design parameters need to be set, the detail design phase of conventional engineering. This is sometimes called robust engineering. The central theme of parameter design is to reduce costs by reducing variability. A product or process can perform its intended function at many settings of its design characteristics but some may give more uniform service than others. Topics included in the area of parameter design are minimizing variation by making products robust to environmental and component variation.
- Tolerance design: With a successfully completed parameter design, and an understanding of the effect that the various parameters have on performance, resources can be focused on reducing and controlling variation in the critical few dimensions. Tolerance design is a method for specifying the tolerances that minimize the costs associated with manufacturing. Taguchi emphasizes that tolerances can be assigned scientifically rather than by engineering convention.
NOISE FACTORS
- Taguchi calls common cause variation the “noise.”
- Noise factors are classified into three categories: Outer Noise, Inner Noise, and Between Product Noise.
- Taguchi’s approach is not to eliminate or ignore the noise factors; Taguchi techniques aim to reduce the effect or impact of the noise on the product quality
SIGNAL TO NOISE RATIO
Taguchi’s emphasis on minimizing deviation from target led him to develop measures of the process output that incorporate both the location of the output as well as the variation. These measures are called signal to noise ratios.
The signal to noise ratio provides a measure of the impact of noise factors on performance. The larger the S/N, the more robust the product is against noise.
Calculation of the S/N ratio depends on the experimental objective:
- Bigger-the-Better
- Smaller-the-Better
- Nominal-is-Best
DERIVATION OF TAGUCHI MATRICES
- Taguchi matrices are derived from classical Full Factorial arrays.
- As with Plackett-Burman designs, Taguchi designs are based on the assumption that interactions are not likely to be significant.
- Taguchi designs have been developed to study factors at two-levels, three-levels, four-levels, and even with mixed levels.
- The levels in Taguchi matrices have historically been reported as Level 1 and Level 2 for two-level experiments.
- These levels are no different than the Low (-) Level and the High (+) Level used in Full Factorial designs and by Plackett and Burman.
- For more than two levels, experimenters typically use Level 1, Level 2, Level 3, etc. for Taguchi designs.
Steps Involved in Taguchi Method:
The use of Taguchi’s parameter design involves the following steps.
- Identify the main function and its side effects.
- Identify the noise factors, testing condition and quality characteristics.
- Identify the objective function to be optimized.
- Identify the control factors and their levels.
- Select a suitable Orthogonal Array and construct the Matrix
- Conduct the Matrix experiment.
- Examine the data; predict the optimum control factor levels and its performance.
- Conduct the verification experiment
- Identification of Main Function and its side effects:
Machining function: Turning on Cobalt alloy using CNC lathe machine.
Side effect: Variation in surface finish
Before proceeding on to further steps, it is necessary to list down all the factors that are going to affect or influence the facing process and from those factors one has to identify the control and noise factors. The “Factors” that affect facing operation on a lathe machine are listed in the table.
Table 4.3: Factors that affect facing operation
| Control factors | Noise Factors |
| Cutting speed | Vibration |
| Depth of cut | Raw material variation |
| Feed rate | Machine Condition |
| Nose radius | Temperature |
| Coolant | Operator Skill |
After listing the control and the noise factors, decisions on the factors that significantly affect the performance will have to be ascertained and only those factors must be taken in to consideration in constructing the matrix for experimentation. All other factors are considered as Noise Factors.
- Identifying the Testing Conditions and Quality Characteristics To Be Observed
Quality Characteristic: Surface finish
Work piece material: Titanium alloy
Cutting tool: Carbide Tipped tool (CNMG)
Operating Machine: Lathe machine
Testing Equipment: Portable surface tester
- Identify The Objective Function
Objective Function: Smaller-the-Better
S/N Ratio for this function: 
Where, n= Sample Size, and y= Surface Roughness in that run
- Identifying the Control Factors and their levels
The factors and their levels were decided for conducting the experiment, based on a “brain storming session” that was held with a group of people and also considering the guide lines given in the operator’s manual provided by the manufacturer of the lathe machine. The factors and their levels are shown in table 4.2.
Table 4.4: Selected Factors and their Levels.
| FACTORS | LEVELS | ||
| 1 | 2 | 3 | |
| Cutting speed(v, rpm) | 400 | 600 | 800 |
| Feed rate (f, mm/rev) | 0.05 | 0.15 | 0.25 |
| Depth of cut (t, mm) | 0.3 | 0.5 | 0.7 |
|
|
|||
| Nose radius(mm) | 0.4 | 0.8 | 1.2 |

- Selection of Orthogonal Array
To select an appropriate orthogonal array for conducting the experiments, the degrees of freedom are to be computed. The same is given below:
Degrees of Freedom: 1 for Mean Value, and
8= (2×4), two each for the remaining factors
Total Degrees of Freedom: 9
The most suitable orthogonal array for experimentation is L9 array as shown in Table 4.3. Therefore, a total nine experiments are to be carried out.
Table 4.5 Orthogonal Array (OA) L9
| Experiment No. | Control Factors | ||||
| 1 | 2 | 3 | 4 | ||
| 1 | 1 | 1 | 1 | 1 | |
| 2 | 1 | 2 | 2 | 2 | |
| 3 | 1 | 3 | 3 | 3 | |
| 4 | 2 | 1 | 2 | 3 | |
| 5 | 2 | 2 | 3 | 1 | |
| 6 | 2 | 3 | 1 | 2 | |
| 7 | 3 | 1 | 3 | 2 | |
| 8 | 3 | 2 | 1 | 3 | |
| 9 | 3 | 3 | 2 | 1 | |
6. Conducting the Matrix Experiment
In accordance with the above OA, experiments were conducted with their factors and their levels as mentioned in table 3.2. The experimental layout with the selected values of the factors is shown in Table 3.4. Each of the above 9 experiments were conducted 4 times (36 experiments in all) to account for the variations that may occur due to the noise factors. The surface roughness (Ra) was measured using the surface roughness tester. The table 4.5 shows the measured values of surface roughness obtained from different experiments.
Table 4.6 OA with Control Factors
| Experiment No. | Control factors | ||||
| Cutting speed (v) | Feed (mm/rev) | Depth of cut (mm) | Nose radius (mm) | ||
| 1 | 400 | 0.05 | 0.3 | 0.4 | |
| 2 | 400 | 0.15 | 0.5 | 0.8 | |
| 3 | 400 | 0.25 | 0.7 | 1.2 | |
| 4 | 600 | 0.05 | 0.5 | 1.2 | |
| 5 | 600 | 0.15 | 0.7 | 0.4 | |
| 6 | 600 | 0.25 | 0.3 | 0.8 | |
| 7 | 800 | 0.05 | 0.7 | 0.8 | |
| 8 | 800 | 0.15 | 0.3 | 1.2 | |
| 9 | 800 | 0.25 | 0.5 | 0.4 | |
Table 4.7 Measured values of surface roughness
| Experiment no. | Surface roughness (micro meter) | ||||
| 1 | 2 | 3 | 4 | Mean | |
| 1 | 1.25 | 1.06 | 1.15 | 1.27 | 1.1825 |
| 2 | 1.22 | 1.24 | 1.24 | 1.22 | 1.23 |
| 3 | 1.43 | 1.35 | 1.28 | 1.33 | 1.3475 |
| 4 | 0.71 | 0.72 | 0.71 | 0.68 | 0.705 |
| 5 | 0.93 | 0.85 | 0.84 | 0.97 | 0.89 |
| 6 | 2.40 | 2.49 | 2.42 | 2.38 | 2.4225 |
| 7 | 0.38 | 0.46 | 0.39 | 0.43 | 0.4151 |
| 8 | 1.21 | 1.22 | 1.18 | 1.30 | 1.2275 |
| 9 | 2.84 | 2.95 | 3.02 | 2.97 | 2.945 |
Table 4.8: Measured value of MRR
| Experiment No. | MRR (gm/min.) |
| 1 | 1.940 |
| 2 | 5.842 |
| 3 | 7.920 |
| 4 | 3.070 |
| 5 | 11.606 |
| 6 | 17.910 |
| 7 | 5.050 |
| 8 | 14.840 |
| 9 | 24.210 |
Principal Component Analysis:
Principal component analysis (PCA) involves a mathematical procedure that transforms a number of (possibly) correlated variables into a (smaller) number of uncorrelated variables called principal components. The first principal component accounts for as much of the variability in the data as possible, and each succeeding component accounts for as much of the remaining variability as possible.
Principal component analysis (PCA) is one among the most widely utilized multivariate techniques in statistics. Usually it is used to minimize the dimensionality of data and thus examine its underlying structure and the covariance/correlation structure of a set of variables. Where as the singular value decomposition gives a simple means for identification of the principal components (PCs) for classical PCA, the solutions thus achieved may lack certain desirable properties such as robustness, smoothness, and sparsity. New techniques for PCA can be developed by altering the optimization problems to which principal component loadings are the optimal solutions
Objectives of principal component analysis
- To discover or to reduce the dimensions of the data set.
- To identify new meaningful underlying variables.
It is a method of analysis which involves finding the linear combination of a set of variables that has maximum variance and removing its effect, repeating this successively
Steps involved in PCA
Step 1: Obtain the required data
Let Za(b) represents the response.
Where a = (1,2……..m) & b = (1,2……n) where m, n are no of experiments & quality characteristics respectively.
Step 2: Normalize the quality characteristics:
i,e, minimisation of surface roughness & maximisation of MRR.
Step 3: covariance matrix is calculated.
Step 4: Eigen value & eigen vector of covariance matrix is calculated.
Step 5: Feature vector is formed i.e., eigen values are arranged in their descending order.
Step 6: Derive the new data set.
Chapter 5
Result and discussion
Taguchi Analysis: MRR(g/min.) versus Speed, Feed, DOC, TNR
Linear Model Analysis: SN ratios versus Speed, Feed, DOC, TNR
Table 5.1 Estimated Model Coefficients for SN ratios
| Term | Coefficient | |
| Constant | 17.8149 | |
| Speed 400 | -4.7944 | |
| Speed 600 | 0.8845 | |
| Feed 0.05 | -7.9601 | |
| Feed 0.15 | 2.2029 | |
| DOC | 0.3 | 0.2673 |
| DOC | 0.5 | -0.2303 |
| TNR | 0.4 | 0.4282 |
| TNR | 0.8 | 0.3380 |
| S = | * | |
| Analysis of Variance | for SN ratios | |||||
| Source | DF | Seq. SS | Adj. SS | Adj. MS | F | P |
| Speed | 2 | 117.165 | 117.165 | 58.583 | * | * |
| Feed | 2 | 304.081 | 304.081 | 152.041 | * | * |
| DOC | 2 | 0.378 | 0.378 | 0.189 | * | * |
| TNR | 2 | 2.655 | 2.655 | 1.327 | * | * |
| Residual Error | 0 | * | * | * | ||
| Total | 8 | 424.279 | ||||
Linear Model Analysis: Means versus Speed, Feed, DOC, TNR
Table 5.2 Estimated Model Coefficients for Means
| Term | Coef |
| Constant | 10.2653 |
| Speed 400 | -5.0313 |
| Speed 600 | 0.5967 |
| Feed 0.05 | -6.9120 |
| Feed 0.15 | 0.4973 |
| DOC 0.3 | 1.2980 |
| DOC 0.5 | 0.7753 |
| TNR 0.4 | 2.3200 |
| TNR 0.8 | -0.6647 |
| S = * | ||||||
| Analysis of Variance | for Means | |||||
| Source | DF | Seq SS | Adj SS | Adj MS | F | P |
| Speed | 2 | 136.010 | 136.010 | 68.005 | * | * |
| Feed | 2 | 267.513 | 267.513 | 133.757 | * | * |
| DOC | 2 | 19.754 | 19.754 | 9.877 | * | * |
| TNR | 2 | 25.693 | 25.693 | 12.846 | * | * |
| Residual Error | 0 | * | * | * | ||
| Total | 8 | 448.970 | ||||
Table 5.3 Response Table for Signal to Noise Ratios
Larger is better
| Level | Speed | Feed | DOC | TNR |
| 1 | 13.021 | 9.855 | 18.082 | 18.243 |
| 2 | 18.699 | 20.018 | 17.585 | 18.153 |
| 3 | 21.725 | 23.572 | 17.778 | 17.049 |
| Delta | 8.704 | 13.717 | .498 | 1.195 |
| Rank | 2 | 1 | 4 | 3 |
| Response Table | for Means | |||
| Level | Speed | Feed | DOC | TNR |
| 1 | 5.234 | 3.353 | 11.563 | 12.585 |
| 2 | 10.862 | 10.763 | 11.041 | 9.601 |
| 3 | 14.700 | 16.680 | 8.192 | 8.610 |
| Delta | 9.466 | 13.327 | 3.371 | 3.975 |
| Rank | 2 | 1 | 4 | 3 |
Taguchi Analysis: MRR(g/min.) versus Speed, Feed, DOC, Table 5.4 TNR Predicted values
| S/N Ratio | Mean |
| 5.7560 | 1.940 |
| 15.3312 | 5.842 |
| 17.9745 | 7.920 |
| 9.7428 | 3.070 |
| 21.2937 | 11.606 |
| 25.0619 | 17.910 |
| 14.0658 | 5.050 |
| 23.4287 | 14.840 |
| 27.6799 | 24.210 |
Factor levels for prediction
| Speed | Feed | DOC | TNR |
| 400 | 0.05 | 0.3 | 0.4 |
| 400 | 0.15 | 0.5 | 0.8 |
| 400 | 0.25 | 0.7 | 1.2 |
| 600 | 0.05 | 0.5 | 1.2 |
| 600 | 0.15 | 0.7 | 0.4 |
| 600 | 0.25 | 0.3 | 0.8 |
| 800 | 0.05 | 0.7 | 0.8 |
| 800 | 0.15 | 0.3 | 1.2 |
| 800 | 0.25 | 0.5 | 0.4 |
Taguchi Analysis: MRR(g/min.) versus Speed, Feed, DOC, TNR Predicted values
S/N Ratio Mean
28.1775 24.7327
Factor levels for predictions
Speed Feed DOC TNR
800 0.25 0.3 0.4
Taguchi Analysis: Ra surface roughness versus Speed, Feed, DOC, TNR
Linear Model Analysis: SN ratios versus Speed, Feed, DOC, TNR
Table 5.5 Estimated Model Coefficients for SN ratios
| Term | Coefficient | |
| Constant | -1.45306 | |
| Speed 400 | 4.52614 | |
| Speed 600 | 0.57332 | |
| Feed 0.05 | 3.44899 | |
| Feed 0.15 | -1.26147 | |
| DOC | 0.3 | 0.27869 |
| DOC | 0.5 | 0.21648 |
| TNR | 0.4 | 0.83828 |
| TNR | 0.8 | 1.00813 |
| S = | * | |
| Analysis of Variance | for SN ratios | |||||
| Source | DF | Seq. SS | Adj. SS | Adj. MS | F | P |
| Speed | 2 | 140.457 | 140.457 | 70.2286 | * | * |
| Feed | 2 | 54.816 | 54.816 | 27.4080 | * | * |
| DOC | 2 | 1.109 | 1.109 | 0.5546 | * | * |
| TNR | 2 | 15.385 | 15.385 | 7.6924 | * | * |
| Residual Error | 0 | * | * | * | ||
| Total | 8 | 211.767 | ||||
Linear Model Analysis: Means versus Speed, Feed, DOC, TNR
Table 5.6 Estimated Model Coefficients for Means
| Term | Coef | |
| Constant | 1.37472 | |
| Speed 400 | -0.60722 | |
| Speed 600 | -0.25639 | |
| Feed 0.05 | -0.48806 | |
| Feed 0.15 | 0.25194 | |
| DOC | 0.3 | 0.15444 |
| DOC | 0.5 | -0.03306 |
| TNR | 0.4 | -0.01889 |
| TNR | 0.8 | -0.28139 |
| S = | * | |
| Analysis of Variance | for Means | |||||
| Source | DF | Seq SS | Adj SS | Adj MS | F | P |
| Speed | 2 | 3.54083 | 3.54083 | 1.77042 | * | * |
| Feed | 2 | 1.07227 | 1.07227 | 0.53613 | * | * |
| DOC | 2 | 0.11904 | 0.11904 | 0.05952 | * | * |
| TNR | 2 | 0.50911 | 0.50911 | 0.25455 | * | * |
| Residual Error | 0 | * | * | * | ||
| Total | 8 | 5.24126 | ||||
Table 5.7 Response Table for Signal to Noise Ratios
Smaller is better
| Level | Speed | Feed | DOC | TNR |
| 1 | 3.0731 | 1.9959 | -1.1744 | -0.6148 |
| 2 | -0.8797 | -2.7145 | -1.2366 | -0.4449 |
| 3 | -6.5525 | -3.6406 | -1.9482 | -3.2995 |
| Delta | 9.6256 | 5.6365 | 0.7739 | 2.8545 |
| Rank | 1 | 2 | 4 | 3 |
Table 5.8 Response Table for Means
| Level | Speed | Feed | DOC | TNR |
| 1 | 0.7675 | 0.8867 | 1.5292 | 1.3558 |
| 2 | 1.1183 | 1.6267 | 1.3417 | 1.0933 |
| 3 | 2.2383 | 1.6108 | 1.2533 | 1.6750 |
| Delta | 1.4708 | 0.7400 | 0.2758 | 0.5817 |
| Rank | 1 | 2 | 4 | 3 |
Main Effects Plot for Means
Main Effects Plot for SN ratios
Taguchi Analysis: Ra surface roughness versus Speed, Feed, DOC, TNR Predicted values
S/N Ratio Mean
7.80889 0.1525
Factor levels for predictions
Speed Feed DOC TNR
400 0.05 0.3 0.8
Taguchi Analysis: Ra surface roughness versus Speed, Feed, DOC, TNR Predicted values
S/N Ratio Mean
-9.38171 2.945
Factor levels for predictions
Speed Feed DOC TNR
800 0.15 0.3 1.2
We have obtained the different values of surface roughness under different machining conditions that are obtained with the help of orthogonal array by Taguchi method. Under that we have four different factors and nine different conditions. For every condition we obtain four values of surface roughness and by finding their mean we get the output for surface roughness. For MRR we calculated the initial and final weight and by difference in weight we calculate material removal rate for the given machining time.
After getting all the output parameters we put them in Minitab software and obtain two response table one for mean value and other for signal to noise ratio. So we have total of four response table two for each surface roughness and MRR.
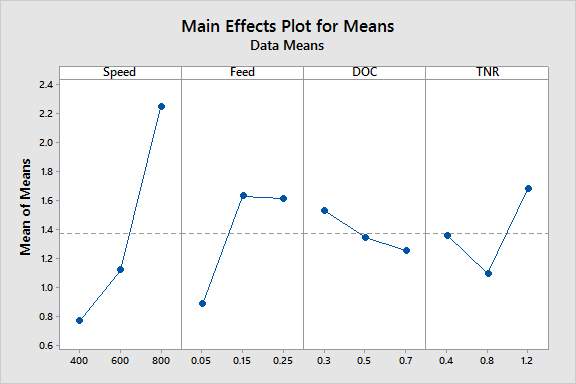
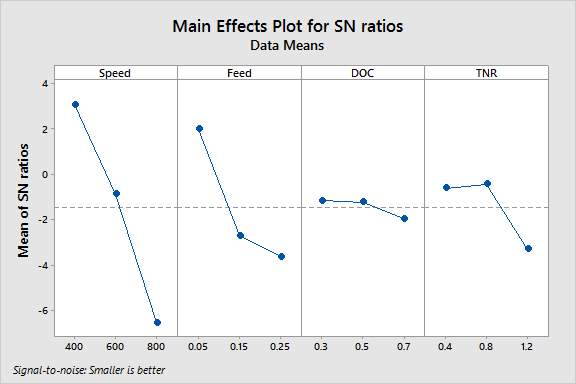
The above graph explains the variation of S/N ratio and mean with respect to various process parameters for the output response which is surface roughness we have chosen smaller is the better design of Taguchi DOE because our objective is to minimize surface roughness as far as possible.With the help of mean response graph it can be interpreted that the minimum point in the graph explains the optimal condition whereas with help of S/N ratio graph it can be interpreted that maximum point is the optimal condition
The optimal condition to obtain the minimum surface roughness while machining titanium alloy is found to be Speed: 400 RPM, Feed: 0.05mm/rev, DOC: 0.3mm, TNR: 0.4mm
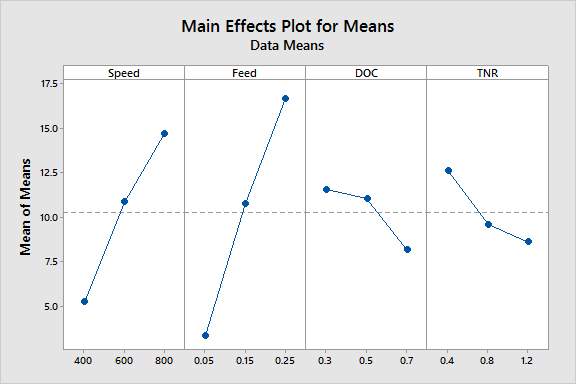
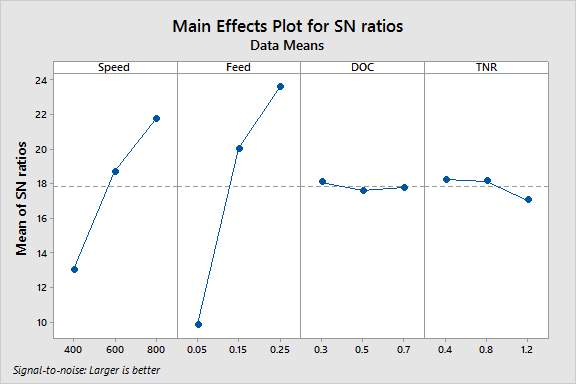
The above graph explains the variation of S/N ratio and mean with respect to various process parameters for the output response which is MRR we have chosen larger is the better design of Taguchi DOE because our objective is to maximize MRR as far as possible.With the help of mean response graph it can be interpreted that the maximum point in the graph explains the optimal condition whereas with help of S/N ratio graph it can be interpreted that maximum point is the optimal condition.
The optimal condition to obtain the maximum MRR while machining titanium alloy is found to be Speed: 800 RPM, Feed: 0.25mm/rev, DOC: 0.7mm, TNR: 1.2mm
For the optimum result among the two response table we need to apply PCA
Principal Component Analysis: MRR(g/min.), Ra(Mic.Met.)
Table 5.9 Quality loss table
Ideal value=1.414 and 0
| Nor. MRR | Nor. Ra | PC 1 | PC 2 | Quality loss |
| 0.0801 | 1 | 0.7636 | 0.6504 | 0.6504 |
| 0.2413 | 0.5886 | 0.5866 | 0.2456 | 0.8274 |
| 0.3271 | 0.3509 | 0.4792 | 0.0168 | 0.9348 |
| 0.1268 | 0.4623 | 0.4164 | 0.2372 | 0.9976 |
| 0.4793 | 0.3373 | 0.5772 | -0.1004 | 0.8368 |
| 0.7397 | 0.3380 | 0.7619 | -0.2841 | 0.6521 |
| 0.2085 | 0.3079 | 0.365 | 0.0702 | 1.049 |
| 0.6129 | 0.1409 | 0.5329 | -0.3337 | 0.8811 |
| 1 | 0.1713 | 0.8281 | -0.5859 | 0.5859 |
Table 5.10 Eigen analysis of the Correlation Matrix
| Eigenvalue | 1.7309 | 0.2691 |
| Proportion | 0.865 | 0.135 |
| Cumulative | 0.865 | 1.000 |
| Variable | PC1 | PC2 |
| MRR(g/min.) | 0.707 | -0.707 |
| Ra(Mic.Met.) | 0.707 | 0.707 |
The above table shows the eigen values and eigen vactor of output parameters MRR and surface roughness respectively.
From the table it is found that the eigen value of MRR is greater then 1 and is responsible for the variation in data upto 86.5% and hence it is the parameter which needs to be optimised through PCA by determining its quality loss, the calculations are shown below.
The eigen value of Ra is less then 1 and hence can be neglected.
Taguchi Analysis: Ql. loss versus Speed, Feed, DOC, TNR
Linear Model Analysis: SN ratios versus Speed, Feed, DOC, TN
Table 5.11 Estimated Model Coefficients for SN ratios
| Term | Coef |
| Constant | 1.84193 |
| Speed 400 | 0.14730 |
| Speed 600 | -0.08121 |
| Feed 0.05 | -0.72801 |
| Feed 0.15 | -0.41101 |
| DOC 0.3 | 1.00794 |
| DOC 0.5 | 0.26143 |
| TNR 0.4 | 1.46723 |
| TNR 0.8
S = * |
-0.19397 |
Table 5.12 Analysis of Variance for SN ratios
| Source | DF | Seq SS | Adj SS | Adj MS | F | P |
| Speed | 2 | 0.0980 | 0.0980 | 0.04899 | * | * |
| Feed | 2 | 5.9890 | 5.9890 | 2.99448 | * | * |
| DOC | 2 | 8.0867 | 8.0867 | 4.04337 | * | * |
| TNR | 2 | 11.4348 | 11.4348 | 5.71740 * | * | |
| Residual Error | 0 | * | * | * | ||
| Total | 8 | 25.6085 |
Linear Model Analysis: Means versus Speed, Feed, DOC, TNR
Table 5.13 Estimated Model Coefficients for Means
| Term | Coef |
| Constant | 0.823900 |
| Speed 400 | -0.019700 |
| Speed 600 | 0.004933 |
| Feed 0.05 | 0.075100 |
| Feed 0.15 | 0.024533 |
| DOC 0.3 | -0.096033 |
| DOC 0.5 | -0.020267 |
| TNR 0.4 | -0.132867 |
| TNR 0.8 | 0.018933 |
| S = * |
Table 5.14 Analysis of Variance for Means
| Source | DF | Seq SS | Adj SS | Adj MS | F | P |
| Speed | 2 | 0.001891 | 0.001891 | 0.000946 | * | * |
| Feed | 2 | 0.048506 | 0.048506 | 0.024253 | * | * |
| DOC | 2 | 0.069476 | 0.069476 | 0.034738 | * | * |
| TNR | 2 | 0.092978 | 0.092978 | 0.046489 | * | * |
| Residual Error | 0 | * | * | * | ||
| Total | 8 | 0.212852 | ||||
Table 5.15 Response Table for Signal to Noise Ratios
Smaller is better
| Level | Speed | Feed | DOC | TNR |
| 1 | 1.9892 | 1.1139 | 2.8499 | 3.3092 |
| 2 | 1.7607 | 1.4309 | 2.1034 | 1.6480 |
| 3 | 1.7758 | 2.9810 | 0.5726 | 0.5687 |
| Delta | 0.2285 | 1.8670 | 2.2773 | 2.7405 |
| Rank | 4 | 3 | 2 | 1 |
Table 5.16 Response Table for Means
| Level | Speed | Feed | DOC | TNR |
| 1 | 0.8042 | 0.8990 | 0.7279 | 0.6910 |
| 2 | 0.8288 | 0.8484 | 0.8036 | 0.8428 |
| 3 | 0.8387 | 0.7243 | 0.9402 | 0.9378 |
| Delta | 0.0345 | 0.1747 | 0.2123 | 0.2468 |
| Rank | 4 | 3 | 2 | 1 |
Main Effects Plot for Means
Main Effects Plot for SN ratios
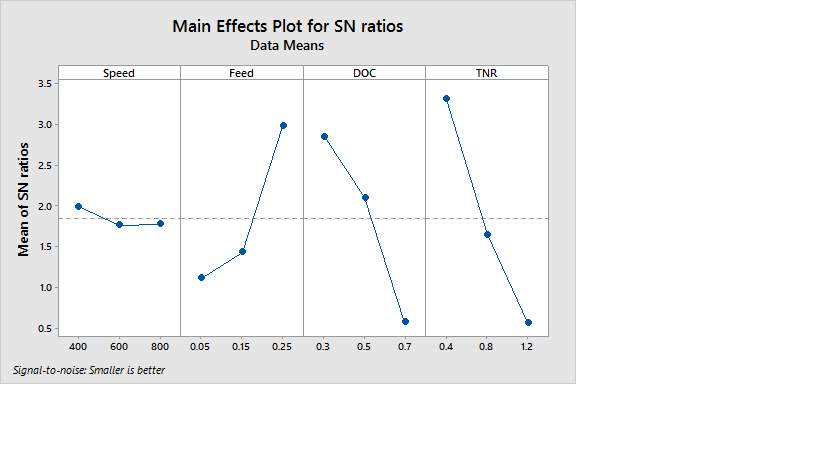
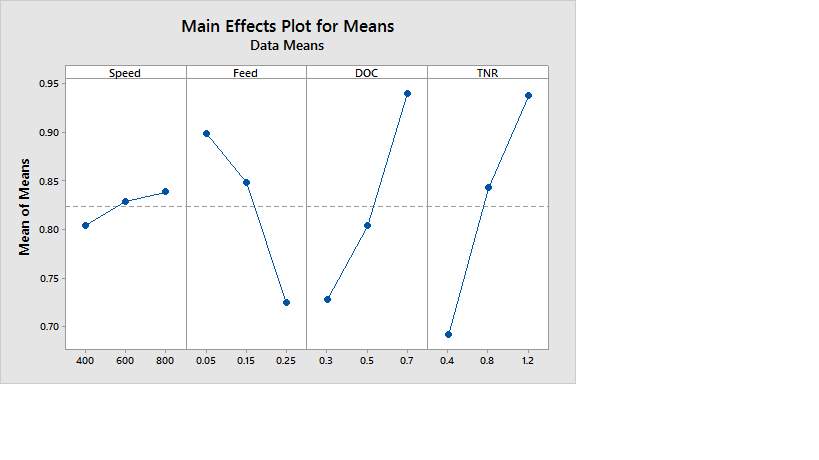
From the above two graphs namely Main Effects Plot for Means, Main Effects Plot for SN ratios of the quality loss it is found that optimum process parameter are Speed: 400 RPM, Feed: 0.25mm/rev, DOC: 0.3mm, TNR: 0.4mm
Chapter 6
Conclusion
Applying Taguchi method of DOE we desghined various experiments which are nine in number . These experiments involve various process parameters and their at different level.then we conducted our experiment that is turning process of titanium alloy on cnc lathe machine with the help of machining parameters like feed,depth of cut,tool nose radius and speed at three different levels. Then each experiment was conducted on cnc lathe and thus two output responses were obtained which are surface roughness of the metal machined under various experimental setting and the corresponding MRR.
These output responses were analysed using minitab software to obtained the value of SN ratio and mean value for MRR and Ra .With the help of these value the response table for SN ratio and mean value are obtained and the mean effect plot against various process parameter for SN ratio and mean value is also obtained for MRR and Ra.When these plots were analyzed it was found that the optimal parameter setting for maximum MRR and minimum surface roughness were found to be as follows
Speed :800rpm and 400rpm, feed:0.25mm and 0.05mm, DOC:0.7mm and 0.3mm, TNR:1.2mm and 0.4mm.
For the optimum result among the two response table we applied Principle component analysis (PCA) using Minitab software. Meanwhile we found out eigen values, eigen vectors, normalized values & quality loss in the process. With the help of these value the response table for SN ratio & mean value were obtained and the mean effect plot against various process parameters for SN ratio & mean value is also obtained for quality loss. When these plots were analyzed optimal parameter setting for minimum quality loss were found, which are as follows: Speed:400rpm, Feed:0.25mm/rev, DOC:0.3mm, TNR
References
- Ross P J, Taguchi Techniques for Quality Engineering
(McGraw Hill, New York) 1995.
- Park S H, Robust Design and Analysis for Quality Engineering
(Chapman & Hall, London) 1996.
- Phadke M S, Quality Engineering using Robust Design
(Prentice-Hall, Englewood Cliffs, NewJercy) 1989.
- Taguchi G, Introduction to Quality Engineering (Asian
Productivity Organization, Tokyo) 1990.
- Ghani J A, Choudhury I A & Hassan H H, Application of
Taguchi method in the optimization of end milling parameters,
J Mater Process Technol, 145 (2004) 84-92.
- Yang W H & Tarng Y S, Design optimization of cutting
parameters for turning operations based on Taguchi method,
J Mater Process Technol, 84 (1998) 122-12
7. I. T. Jolliffe, Principal Component Analysis, 2nd ed. New York: Springer-Verlag, 2002.
8.K. Fukunaga, Introduction to Statistical Pattern Recognition. New York: Academic, 1990
Cite This Work
To export a reference to this article please select a referencing stye below:
Related Services
View all


Related Content
All TagsContent relating to: "Chemistry"
Chemistry is a science involving the study of the elements and matter at the atomic and molecular level including their composition, structure, properties, behaviour, and how they react or combine.
Related Articles

DMCA / Removal Request
If you are the original writer of this dissertation and no longer wish to have your work published on the UKDiss.com website then please: